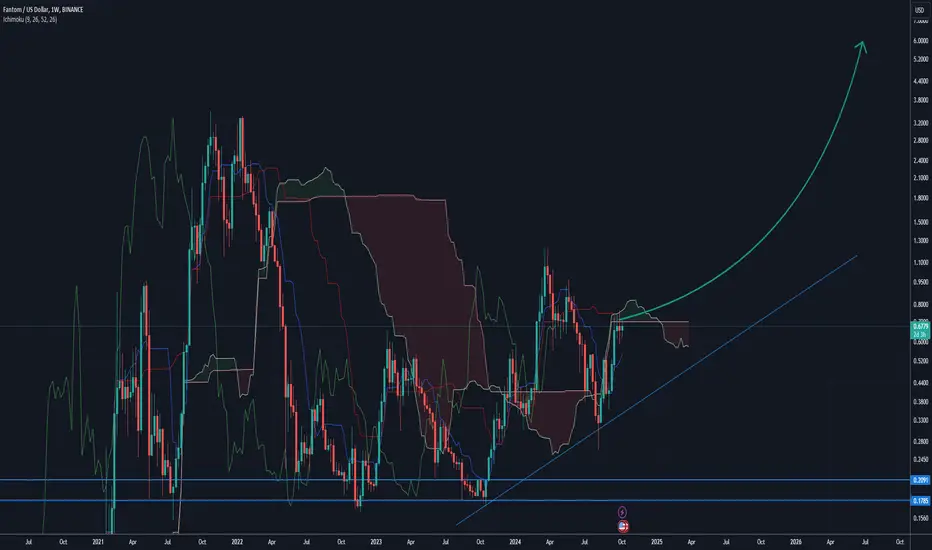
Finally Ftm Getting Ready For 600 % Bullish Rally Ftm Seems Like Fantom Has Bottomed Out & Finally Ready For Massive Breakout Formed Symmetrical Triangle Expecting 500 to 600% In Coming Months After Successful Breakot
FTMUSDT

FTM ON Fire , Sonic Transformation is Loading FTM On Fire , Don't Miss that Rally As FTM is always Performing Massive Upward moves , We are Officially in Bullrun so don't miss having that coin in your portfolio
1.2$ is next then 1.8 in no time

FTMUSDT ONE DAY UPDATEBy hitting our entry range it has pumped 42 percentage so far
we are not selles until FTM reaches the red box
Entering a position at the current price is risky
we already warned we will introduce big oppurtunities that will not be repeated for the next 8 years in vip dont missthe opportunities

FTMUSDT - Inverse Head & Shoulders - A Prime Long Opportunity?1.) Quick Overview
On the FTM/USDT 4-hour chart, an inverse Head & Shoulders pattern is shaping up, often hinting at a bullish reversal. If the pattern completes, this could offer an excellent long setup. The key level to watch is around the mOpen at $0.6555, where the price is expected to dip and complete the “right shoulder,” potentially setting the stage for a strong bounce.
2.) Deep Dive: Chart Analysis
Inverse Head & Shoulders Pattern:
- Left Shoulder: Formed near $0.6342.
- Head: A deeper low at $0.4744, marking the low point of the pattern.
- Right Shoulder (In Progress): Expected to complete around mOpen at $0.6555. If the price touches down here and holds, it could serve as an ideal long entry point.
Fibonacci Retracement:
- The 0.382 Fibonacci retracement level aligns near $0.6555, supporting the right shoulder as a potential bounce zone.
Key Levels to Watch:
- mOpen at $0.6555: This is our primary entry level, where the right shoulder could find support.
- VAL (Volume Area Low) at $0.6324: Another important support zone where the anchored VWAP also aligns, reinforcing this area as a significant base. If the price dips below mOpen, the VAL may act as a secondary support level.
- VAH (Volume Area High) at $0.7262: Our initial target if the inverse Head & Shoulders completes, with potential for further gains.
Volume Profile:
- Increased volume near the head formation suggests accumulation, supporting a bullish scenario if the right shoulder completes as expected.
3.) Trade Setup
- Entry: Look for a long entry around $0.6555.
- Stop Loss: Place the stop loss just below $0.58 to manage risk if the pattern fails.
- Target: Initial target at $0.7262 with room for more upside if the breakout continues.
- Risk-to-Reward: Favorable setup with solid support and a high-probability bounce area.
4.) Final Thoughts
- With the combination of the inverse Head & Shoulders, support at mOpen, Fibonacci, and anchored VWAP at the VAL, this FTM/USDT setup looks promising for a long position. Watch for confirmation around $0.6555 to see if the right shoulder completes.
Disclaimer
This analysis is for educational purposes and should not be taken as financial advice. Always do your own research and manage risk carefully!

FANTOM (FTMUSDT) Surges with Lucrative Long Trade Setup!FANTOM (FTMUSDT) Analysis:
On the 1-hour timeframe, FANTOM (FTMUSDT) has confirmed a clear long entry at 0.6428, indicating strong bullish momentum. The targets appear promising as price action continues to align with the upward trend, potentially unlocking significant profits.
Trade Summary:
Entry Level: 0.6428
FANTOM Target Levels:
TP1: 0.7131
TP2: 0.8268
TP3: 0.9406
TP4: 1.0108
Stop Loss: 0.5860
Leveraging the Risological Dotted Trendline, this setup highlights FTM’s strong upward potential. Keep an eye on this for a steady climb toward the targets!

Still Preferring the downside for $FTMLooking at the chart, thinking we already broke to the downside on a lower time. Seeing at current chart, the moves likely just to wash out all the sellers on perps. Even the dog's shouting liquidation.
Preferring the downside.

FTM has Double Cup Cakes...yum yumWhat's better than one cupcake?...two! and FTM has "Double Cup Cakes"... I'm expecting one more "flush out" down to the mid $0.50 range before it launches upwards completing the Fibonacci Extension.

FTMUSDT: Bearish Head and Shoulders PatternFTMUSDT Technical analsysis update
BINANCE:FTMUSDT has formed a bearish head and shoulders pattern on the daily chart, with price moving the support level below. If a breakdown is confirmed on the daily chart, we could expect a potential drop of 20%-60% in FTM. Additionally, the price has fallen below the 100 EMA, adding further confirmation of a bearish trend.
Short level: Above $0.58
Stop loss : $0.675
Target 1 : $0.530
Target 2 : $0.420
Target 3: $0.260

Fantom (FTMUSDT) Short Signal on 4-Hour Timeframe💡 Technical analysis shows that after completing a 5-wave Elliott pattern, Fantom has entered a corrective phase, forming an ABC correction. Additionally, a Head and Shoulders pattern is in progress, with a potential neckline break signaling an ideal short entry.
🎯 Price Targets:
Target 1: $0.53
Target 2: $0.44
Target 3: $0.32
⏳ Correction Timeframe: Late December 2024 to early January 2025
This time window provides promising shorting opportunities for Fantom. The specified targets can also be considered for re-entry into long positions, as a new bullish wave may begin after the correction completes.
⚠️ Stop Loss: Set a stop loss slightly above the neckline to protect capital.

ALTCOINS Q4 2024 | Ideal Entries | GOOD BUYSHere's an updated list of 10 altcoins that have good chart setups and longer term prospects.
Note that for some, you may have to dollar-cost-average (buy little bits on the way down).
1) NEARUSDT
2) TAOUSDT
3) LTCUSDT
4) TIAUSDT
5) FTMUSDT
6) GRTUSDT
7) AVAXUSDT
8) INJUSDT
9) AAVEUSDT
10) SOLANA / SOLUSDT
___________________________________

FANTOM ideawith a formation of double top we expect a correcion towards the support zone .
Feel free to comment , like and follow fore more ideas and free signals.

#FTM FANTOM COIN LONG POSSIBILITY - ALTCOINI will be watching to marked 'Long Zone' for possible long position.
LTF confirmation will be needed in order to open position.
Possible target would be the purple line.
Risk assests are doing good recently but we have still geopolitical risks currently.
Nothing i share is financial advice. Education purposes only.

FTMUSD long using proprietary multi-timeframe trend detectionExecuting this on M5 and M15 time frames as I usually do, taking into account H1 short term trend retest taking place right now.
Entry: 0.7508
SL: 0.7320
TP: 0.8420
Upon clearing 0.79 and invalidating the H1 T candle that formed I'll move the SL a little higher than BE. H4 close above that 0.8 would likely take this to target relatively quickly.
H1 close above 0.7561 would be ideal now:

FTMUSDT BUY SIGNAL. Don't forget about stop-loss.
Write in the comments all your questions and instruments analysis of which you want to see.
Friends, push the like button, write a comment, and share with your mates - that would be the best THANK YOU.
P.S. I personally will open entry if the price will show it according to my strategy.
Always make your analysis before a trade

Fantom (FTMUSDT) Trade Update: 700% Profit -All Targets AchievedWe entered the trade on 9th September at 0.4026, and by 17th September, all targets up to TP4 were successfully achieved. The trade has now moved into a bigger profit, marking a 70% gain from the entry. With 10x leverage, this results in a 700% total profit.
We'll continue to monitor the position using the Risological Swing Trader closely as the market unfolds.

FTMUSDT - The Monster!One of the best performing currencies this year
We have previously published many analyzes of it, and all of them actually achieved their targets
This time I expect a strong rise and new ATH, and this will be so quick!
best regards ceciliones🎯

FTM correctionhello.
I think in few week we will see ftm at level .54
why:
1.price action signals
2.rsi in day conot brack moving 14
3.in weekly time frame ichimoco cloud is green and the price i dont think can brake it.
4.btc down trend
target: .54
why:
level .54 is neck line of reversal head and shoulder

FTM Looks Braish (4H)From where we placed the red arrow on the chart, it seems that FTM has entered the correction phase.
It seems to correct an ABC with a more complex pattern.
Now it seems that wave A and B are completed and the price is entering wave C. Wave C is bearish.
The targets are marked on the chart.
Closing a daily candle above the invalidation level will violate the analysis
invalidation level : 0.7695
For risk management, please don't forget stop loss and capital management
When we reach the first target, save some profit and then change the stop to entry
Comment if you have any questions
Thank You

FTM potential mid/long term view FTM / USDT
Fantom is trying to print huge I H&S on HTF which is great bullish pattern if completed
If my plan succeeds and the pattern is completed …the right shoulder is located between 1.2$ -1.5$ (first TP)
And if we breakout the neck line the next targets zones will be 2.9$-3.5$ and 5$-6.8$ (optimistic)
Note : We bought this coin around 0.48$ area few weeks ago which was a great entry…. price could also pullback again to low 0.6$ - 0.5$ (buy back zone if market provides)
Invalidation: Weekly support must hold to remain bullish

FTM Long Spot Position (200-day EMA Flip)Market Context: FTM is attempting to hold the $0.50 buy zone as a higher low while flipping the 200-day EMA from resistance into support, creating a promising setup for an upward move with a strong risk-to-reward ratio.
Trade Setup:
Entry: Around the $0.50 zone.
Take Profit:
First target: $0.82
Second target: $1.10
Third target: $1.66
Stop Loss: Daily close below $0.36.
This trade aims to capitalize on the higher low and potential EMA flip for the next leg up. #FTM #EMA

FTM TRADE IDEAFTMUSDT is forming a very eye catching setup as you can see on the chart. Creating Trendline liquidity to trap trendline traders and also created SSL above DEMAND ZONE. We will enter long from marked demand zone.

FANTOM (FTM) Don't Miss Out: The Bullish Outlook for Q4!Consider buying at 58c and 55c. UPCOM:FTM
This one has shown the following:
Flipped the macro level—bullish now
Weekly and monthly have fired bullish signals
Strong multiyear trend
Overall, this is one of the most exciting charts heading into Q4!
