FTSE

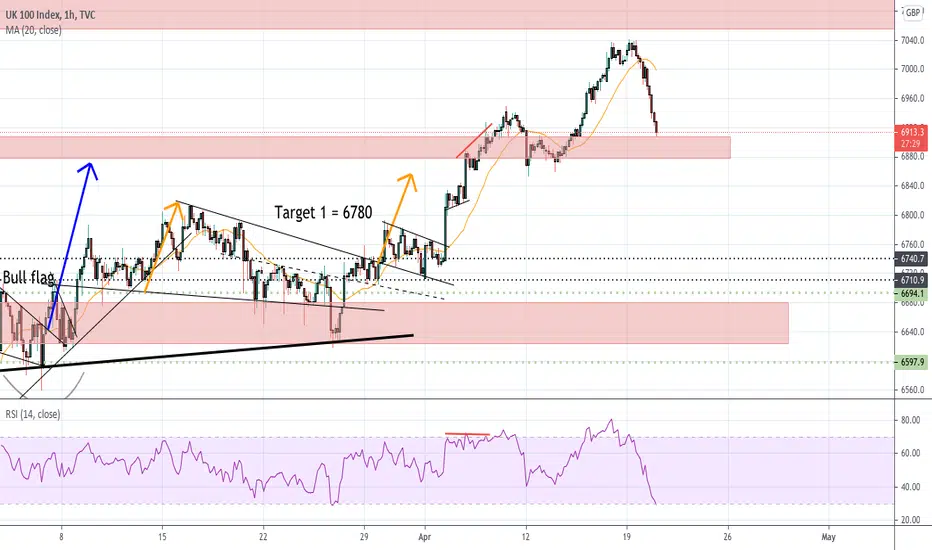
UKX Hourly - Bull flag building Bull flag building in progress... waiting for confirmation. Already long from symmetrical triangle break

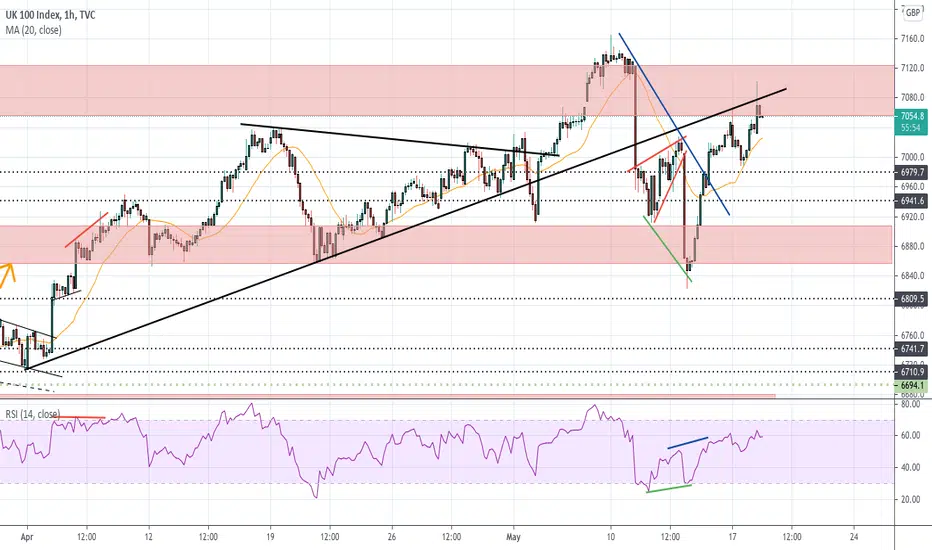
UKX Hourly - Consolidating below overhead lateral resistance Battle lines have been drawn between 7040 and 7055. Trend & sideways consolidation favours a break higher... suspect we will have to wait until US open to get our break. Move higher likely to be quick and fast when (if) it does break higher.

$UKX Hourly - Bearish engulfing nullifies bullish thesis 4 now Bearish engulfing candle on the hourly signals we may see a pullback here - cannot be long. We are coiling within a symmetrical triangle - patience is key

UKX Hourly - Big bounce off 6900 targets 7036Big reversal off our red lateral support following yesterday's sell off. Long with a target of a gap close at 7036

UKX Hourly - Another day of squeezing the bears at the open Once again opened higher and has been drifting lower after re-testing resistance. Bulls appear to be trying their best to squeeze the bears as much as possible before next leg lower. Holding onto for shorts for now.
UKX Hourly - Rejection off double resistanceIndex hit double resistance this morning (lateral and prior upward sloping) - and reversed. I am still holding my short positions initiated a couple of days ago. Today's high is the line in the sand for now & hopefully we go back to the bottom of the range at 6850.

UKX Hourly - Opens higher but still not bullishIndex opened higher and (unexpected to me) closed the gap at 7006. However - the picture is still not bullish. We have yet to see higher highs, and there is hidden bearish RSI divergence coming through. I am holding onto my shorts for now (albeit a little more uncomfortably than yesterday) & definitely not ready to add until we see further bearish developments.

UKX Hourly - Beautiful bounce BUT time for downtrend to resume Lovely bounce this morning following the RSI divergence identified. Looks a bit overdone here and I think we can see the downward trend resume. There is a gap around 7000 but will take time to see that filled I think. First a move to at least 6900

UKX Hourly - Worth a cheeky long Our bear flag played out beautifully and I don't think the selling has finished BUT it was a very quick move and we now have some RSI divergence. I have taken profit on my shorts and swung long looking for a bounce towards 6900. Against the trend so will be keeping my stops tights. NB only looking for a bounce here - can only hold longs if we see a trend change.

UKX Hourly - Bear flag developingIndex has broken upward support, and is now in the process of forming a bear flag. Watch the gap at 6941 for first target

FTSE 100 - Intraday Buy Idea H4 - bullish false break
H1 - reversal pattern (divergence + convergence)
M15 - POTENTIAL bullish impulse.
Trading a potential setup is risky and much more aggressive than trading an actual setup. If you are not completely sure how to handle this one, better skip it or wait for the actual M15 structure (bullish impulse) to complete, than wait for the pullbacks before you look for buys.

Hold on, all stocks are about to drop - FTSE to 4000Hello all
This one has been a year and change in the making, however it's time, the FTSE is about to drop to 4000
If the weekly candle closes bearish as an engulfing candle as well, it'll drop fast.
After the initial leg lower, it reach the 61.8% retrace, now on a retest of that area, it's creating divergence and is overbought.
With risk of inflation on the horizon and finally some increases in interest rates, currencies will gain strength
XXX USD pairs will go up, USD XXX pairs will continue to fall.
JPY will gain a lot of strength and GOLD will make new highs.
The FTSE however will fall along with all other indices.
Hold on tight
Thanks for looking at my idea
Duncan

UKX Hourly - Bearish false break higherSuccessful gap close at 6944 following a bearish false break higher. Significant support at 6955, through which we could see 6695 again. I took profit on my shorts at the gap close, but will cautiously start to sell the rallies towards 6980, and add should we break support

UKX Hourly - Decent RR area for a short Re-testing upper resistance - good area for a short (based on assumption first break higher was false) Can continue to add to short if momentum to the downside picks up. SL - prior high (7035). Should we take out 7035, it becomes a false break lower and the picture will turn bullish

UKX Hourly - Bizarre spike lower quickly bought Spikes on no news in either direction always make me feel uncomfortable. Even when quickly reversed I find they tend to return to their initial reaction. Therefore shorting with stops at today's high. Watch the gap at 6944

UKX Hourly - Coiling.. waiting for break to confirm directionWaiting for a break to confirm direction

FTSE100 Buy SignalPattern: Channel Up on 4H.
Signal: Buy as the price is rising following a (near) Higher Low on the pattern.
Target: 7120 (the 1.382 Fibonacci extension).
** Please support this idea with your likes and comments, it is the best way to keep it relevant and support me. **
--------------------------------------------------------------------------------------------------------
!! Donations via TradingView coins also help me a great deal at posting more free trading content and signals here !!
🎉 👍 Shout-out to TradingShot's 💰 top TradingView Coin donor 💰 this week ==> z_hq
--------------------------------------------------------------------------------------------------------

UKX Hourly - Higher high following successful bounce off supportHigher highs and higher lows are in place following a successful bounce off lateral support. Still favouring a long bias with a full target of 7050ish and SL of 6890. I am expecting some resistance around 6965 (NB NB) - I will be monitoring closely for any potential reversal. Through this crucial point, one can look to add to their longs, but a reversal here will see me swing to a short position. Updates to follow as we progress

FTSE Short
Why?
Fib retracement 0.5 for continuation down in the short term
Market structure bouncing between 0.23 and 0.5 for the last few days
R/R 1:6

UKX Hourly - Decent RR for a bounce O/S RSI and lateral support = decent RR. Target = 6950 area with trailing stop
FTSE Elliott Wave View: Pullback Should Continue to Find BuyersShort term Elliott wave view in FTSE Index suggests that the rally from February 27 is unfolding as a 5 waves impulse Elliott Wave structure. Up from February 27 low, wave ((i)) ended at 6812.78 and pullback in wave ((ii)) ended at 6619.89. Index has resumed higher in wave ((iii)) with subdivision as another impulse in lesser degree. Up from wave ((ii)) low, wave (i) ended at 6792.23 and dips in wave (ii) ended at 6713.63. Index resumed higher in wave (iii) towards 6949.56 and pullback in wave (iv) ended at 6853.75.
Expect wave (v) to end soon which should complete wave ((iii)) in higher degree. Afterwards, Index should pullback in wave ((iv)) to correct the cycle from March 25 low before the rally resumes higher in wave ((v)). As far as March 25 pivot low at 6619.89 stays intact, expect dips to find support in 3, 7, or 11 swing for further upside. The pullback in wave ((iv)) in 3, 7, or 11 swing should ideally end at 23.6% – 38.2% Fibonacci retracement of wave ((iii)). This area can be measured once wave ((iii)) has ended and pullback has started.

UKX Hourly - Bearish H&S confirmed below 6860Buyers stepped in again at 6860, but this level is less likely to hold next time round. H&S will be confirmed with an hourly close below 6860. I've been bearish last couple of days and am already short - target = 6790
