VUKE Daily - trimmed back to u/weight waiting for better levelsI had used the green accumulation zone to add to my positions - after a successful run I have taken profit on the majority of holdings leaving me net underweight. I am hoping for a dip back to the red zone where I will look to start re-entering.
FTSE

SHORT FTSE (UK100) 1-2 DAYS - 1hr chart - zoom out for contextThe chart speaks for itself. Nice top, but I'd like to see it go down again to retest level underneath and rise again - as scenario 1 follows.
Might be a few days to do so, but considering movements the last two months, where I have been following FTSE closely,
it does not have the strength to keep going as is right now.
It might also happen that it loses a lot of strength and searches towards bottom half of the pitchfork - as scenario 2 follows.
You can zoom out on the chart and see where I get my levels and lines from.
Would be nice and healthy to down a bit and find some more strength. Although,
April is historically a positive month for stock markets, so I believe it will go to an ATH. Perhaps, in the interval 20-30th April.
Stay healthy.

$UKX Hourly - Decent RR for small short Reversed off overhead resistance & RSI overbought + divergence. Trend up, but worth a small tactical short at these levels. SL = 6930

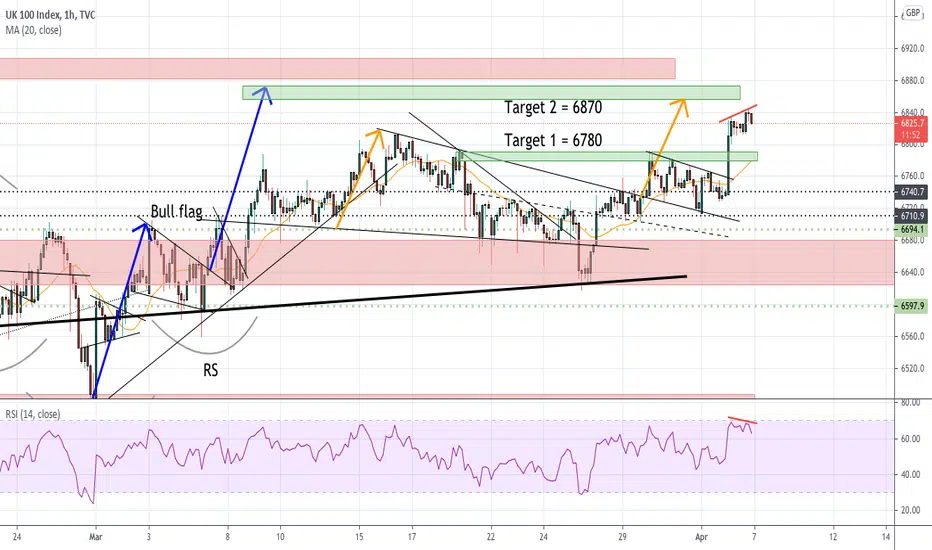
$UKX Hourly - Re-testing break out levelGood place to re-enter new longs after taking partial profit at target 1 (6780)

$UKX Hourly - Possible consolidation before final push higherMinor bearish RSI divergence has appeared on the hourly. Trend is still clearly up and full target of 6870 BUT momentum appears to be slowing. Taking some profit here on my longs and will look to add on a test of the green zone at 6780/6790.
FTSE: LONG OR SHORT ?Following the world economic recovery, FTSE is now in a bullish cycle and here's our view for the upcoming days:
1.LONG : If the price retests the lower trendline and forms back a green bullish candle on the H4 timeframe, a Long position can entered there. And when the price reaches the green doted line, an additional Long position can be entered with more confidence since the price will be breaking a peak that was reached before.
2.SHORT : If the price breaks successfully the lower trendline with many bearish candles, then and only then a Short position can be entered.

FTSE 100 Edging Towards 7000The FTSE 100 has failed to break and close above the February 2018 low at 6536 for a number of months now.
You can see the December 2020 candle and the candles for January and February 2021 traded above this level
but ended the month by closing below this level.
With one more trading day of the month left to go, we may well finally see that close above 6536 and if this
is achieved then we should continue to see bullish moves in UK stocks.
Although the move up has been rather sluggish, price has gained good ground following the 22% decline we
experienced in February and March 2020 at the peak of the global pandemic. In March 2020 price continued
down and found support around the 5000 round number before moving back to the upside.
With a bullish end to this month’s candle, the next level of resistance is 7000 and following that we have
the all-time high at 7903, which is the May 2018 high. We will be able to get a better perspective of price
action once the candle for March closes and decide on which opportunities we want to take positions in.
See below for more information on our trading techniques.
As always, keep it simple, keep it Sublime.

$UKX Hourly - First target reachedFirst target reached this morning on the gap closure at 6780. RSI starting to head to overbought territory. Hoping to see a bit of consolidation before next push higher
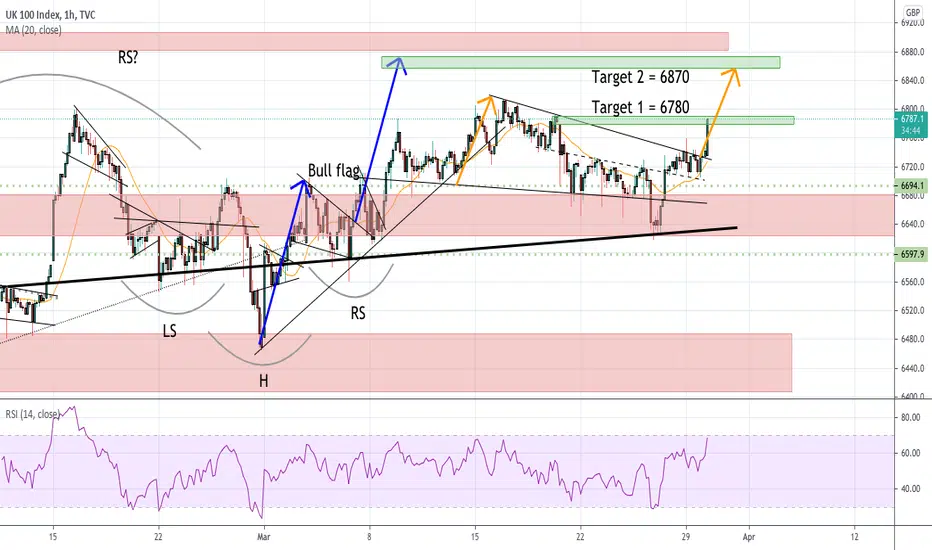
$UKX Hourly - Backtesting channel break We are currently testing Friday's channel break. Good RR levels to go long for those who currently don't have a position. Nice gap at 6780 I would like to see filled, as well as the full target of the bull flag and inverse H&S of 6870. We have seen some month end selling during the previous few months which is something to keep an eye on and more reason to keep stops tighter. On the other hand, this month may be different given it is tax year end in the UK. Summary: Long with a tight stop
UKX Hourly - Bullish picture intact despite yesterday's wobble Bottom of the red lateral support held despite yesterday's brief wobble lower. In hindsight it was a great buying opp for those that missed the morning's bullish confirmation. Still looking for full target of 6870 - however not in a straight line

VUKE Daily - Dips back into green accumulation zoneAfter taking some profits at the red resistance zone a couple of weeks ago, I will use the current pullback to green zone to starting accumulating again into my ISAs and SIPPs. I would really like to see this ETF touch the 32 region over time.

UKX Hourly - Another long tail candle developing Buyers stepping up and continue to buy at 6680. If this hourly candle holds, it will be a good opportunity to go long. There is a gap at 6700, and the bullish inverse H&S is still in play targeting 6870.

FTSE100 - Triple bottom formedFollowing on from my previous idea, the FTSE has continued to show strength at this level of support.
A triple bottom has formed at what looks like the bottom of the cup in a cup and handle pattern.
If FTSE traders were bearish, the drop from the rising wedge would've been steeper. The news around the vaccine spat with the EU would've also likely caused a steepeer slide. However, because the bad news has been absorbed, we can assume traders are bullish (for now).
I think the only thing stopping the FTSE from moving up is the current fears around lockdown on the continent. Technically speaking, I like how the chart looks. Bulls seem to be defending the 6700 level well. Fundamentally, the fears over lockdowns worries me about this setup, but I'm still confident it will play out.
See chart for entries and exits

FTSE100 - Fresh highs incomingThe FTSE is currently sat at strong support. Sellers tried to push price lower, but the index was bought back up to form a pinbar (red arrow). Lower BB also sits at this point (see %B in bottom window).
Considering the lacklustre fall from the rising wedge and the subsequent pin bar, we can expect 6800 to break (see how long price spent lingering around the level).
The next resistance is ~6838, so a break and restest of the 6800 is likely and will be the perfect high probability entry.
An aggressive entry would be at open on Monday (I personally will probably take this based on the pinbar with a stop below the low).
Target is the psychological level of 7000, which acted as a strong support throughout 2019.
High prob:
Entry = 6805 when retesting the level
Stop = 6735
TP = 6800
R:R = 3
Aggressive:
Entry = 6720
Stop = 6642
TP = 6800
R:R = 4
Happy trading:) follow for more of this kind of stuff!

Airtel Africa Resistance Broken - All Time High In SightAirtel Africa has been in an uptrend since May 20 and has been forming bull flags with a following period of consolidation. This has happened twice in the current uptrend with each upward thrust followed by consolidation which forms an ascending triangle pattern. Price has just broken out of the 83p resistance and has since moved higher. Look for a retest of the 83p and enter a position here, however there is a risk that this price won't be seen before the next rally (see previous bull flag patterns).
Fundamentals on this company are also fantastic and they are currently yielding 5.3%, therefore offer a good long term investment.
Disclaimer: I speculated the breakout and bought in at 75p.

FTSE PullbackFTSE structure today was range-bound. Some bear candles can be made out, affirming a downtrend in the lower timeframes. I think we may see it pulling back towards the bottom of the range, potentially the trendline. The pound seems to be up, with room to continue to test the top of a resistance trendline.

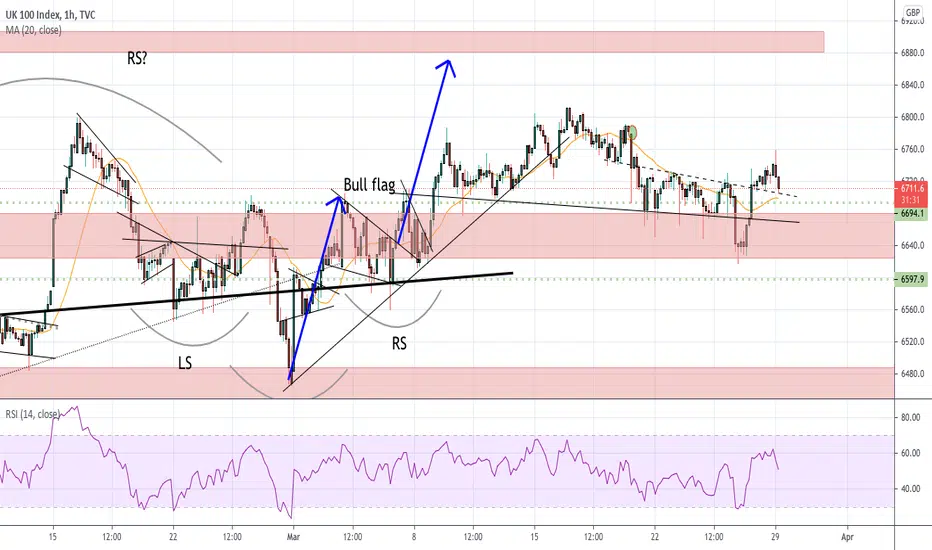
UKX Hourly - Possible re-test of 6680/6700 neckline Looking slightly ominous on the hourly chart. Trend is still up and we have a bullish inverse H&S and bull flag still in play. A pullback here to 6680/6700 would be healthy and an opportunity to get long should we see the support hold.

TESLA - Correction done. Bull Run Continues...Previous TESLA chart played out almost perfectly. We were anticipating a deeper correction back to the trendline, which we got! We can now look for continuation patterns and ride this wave to the moon. See you there ;)
See linked chart for previous Tesla chart.
Trade safe!


UK100 H4: Market BUY now TP +350 points(SL/TP)(NEW)Why get subbed to to me on Tradingview?
-TOP author on TradingView
-15+ years experience in markets
-Professional chart break downs
-Supply/Demand Zones
-TD9 counts / combo review
-Key S/R levels
-No junk on my charts
-Frequent updates
-Covering FX/crypto/US stocks
-24/7 uptime so constant updates
UK100 H4: Market BUY now TP +350 points(SL/TP)(NEW)
IMPORTANT NOTE: speculative setup. do your own
due dill. use STOP LOSS. don't overleverage.
🔸 Summary and potential trade setup
::: UK100 H4/candle chart review/outlook
::: speculative XABCD setup in progress
::: market BUY/HOLD TP +350 points
::: 5% upside in this market mid-term
::: sellers will come later from overhead
::: valid TP BULLS is 7050
::: recommended strategy: BUY/HOLD TP +325 points
::: SL below recent lows
::: low risk setup / bounce very likely now
::: just buy/hold low and get paid
::: do not expect fast/miractle gains
::: swing trade setup requires patience
::: good luck traders!
🔸 Supply/Demand Zones
::: N/A
::: N/A
🔸 Other noteworthy technicals/fundies
::: TD9 /Combo update: N/A
::: Sentiment: BULLS
::: Sentiment outlook short-term: BULLS
RISK DISCLAIMER:
Trading Crypto, Futures , Forex, CFDs and Stocks involves a risk of loss.
Please consider carefully if such trading is appropriate for you.
Past performance is not indicative of future results.
Always limit your leverage and use tight stop loss.

UKX Hourly -Bearish engulfing BUT on triple support My natural bias would like to see the index pullback further here - as we have seen the 6600 level has been a magnate the past few trading sessions. The hourly bearish engulfing would support a short position, but we do have the index on a triple set of supports. I'm waiting on the sidelines hoping for better levels to buy into my ISAs and SIPPs

UK100- Expanded Flat patternIn the 240-minute chart, due to the 5 descending wave movement to the range of 6315, there is a scenario that, we encounter 5 more downtrend waves. The corrective movement of these 5 waves have been completed in the range of 6793 and the first wave from point 3/C has been finished in the range of 6535. In wave 2, the Expanded Flat pattern is formed.
By break down of the downtrend line in the 60-minute chart, hopefully, we can expect the continuation of the downtrend with 6150 targets.

FTSE 100 (UK100) - Simple and Clear MovesUK100 has been making clear impulse correction impulse. On lower timeframes, watch for shorting opportunities e.g. break of trendline near the channel resistance.
More in-depth analysis in the links below.
Trade Safe!
