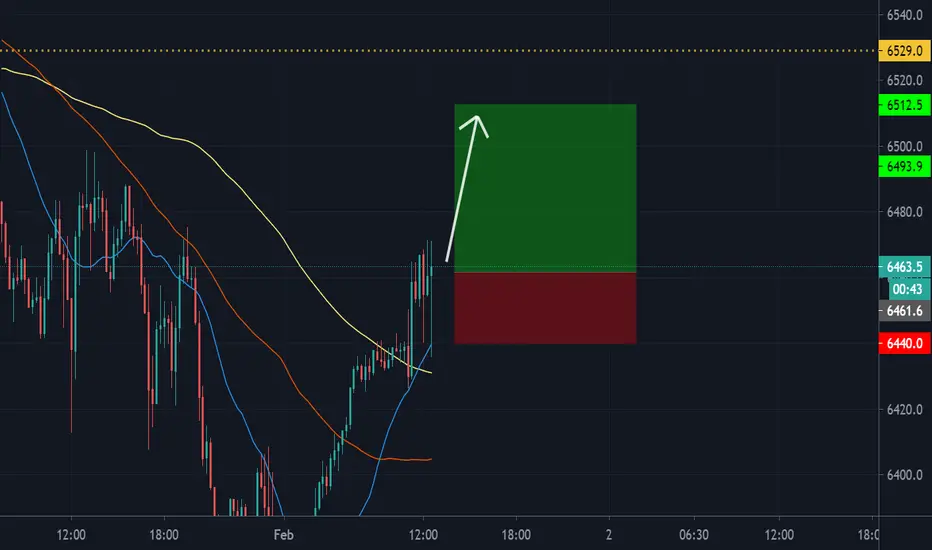
UKX Hourly - Reversal candle off overhead lateral resistance Decent RR set up here - Targets are 6585 and 6560. SL = 6645 (daily high)
FTSE

UKX Hourly - Approaching lateral supportTrend is still down, but feeling overdone in the short term. Looking for a bounce off lateral support to 6550.

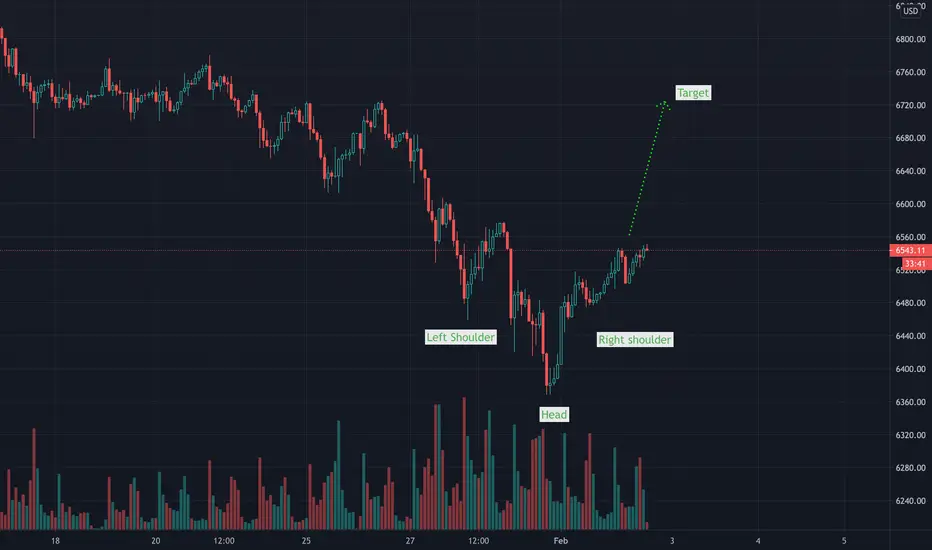
FTSE and all Stocks - The second leg lower is about to startHello all
I've been watching this since March 2020 where the first leg started to retrace - after having moved back up through the past 9 months and then consolidated the past 2 around the 61.8% to 78.6% fib retrace area
I expect early next week for the Head and Shoulders to be fully printed and based on Fibonacci extension, I expect price for the FTSE to drop below 4000, potentially near 3600.
Lets see what happens, however I wont be buying stocks for a long time.
Trade safe
Duncan

FTSE 100 Looking For Long After RetraceThis is making a retrace after spiking 3 days ago. I am looking for an entry around 0.5 Fibonacci as this aligns with some previous resistance although it is best to wait for confirmation as it could drop further. Once we see a rebound target will be at a new high and where it will meet resistance of 7004.

Long FTSEFTSE oversold in uptrend, DXY weakening will strengthen equities, everyone talking about a crash so it won't happen. Long for new highs

FTSE Long bull case and swing trade + breakout in April?After the bear channel was broken, FTSE arose and is in up trend on the chart . I believe FTSE will be testing support in the upcoming week and is bound for breakout as early as in April.

FTSE Long bull case and swing trade + breakout in April?After the bear channel was broken, FTSE arose and the up trend on daily chart. I believe FTSE will be testing support in the upcoming week and is bound for breakout in April.


FTSE Enter Long on RetraceFTSE 100 has had a big push higher, want to see a retrace before entering a long. Once it peaks on the current spike look for retrace to around 0.382 Fibonacci for entry. I have set target at a new high of 7004.4 although there will likely be some resistance at the previous high so can also take profit there and re-enter on the retrace from there.

Review of today's trading on H1BO. February 8, 2021First of all, we're sorry if you have tried to get in touch with us in the past 12 months. We have had some technical issues but we will be replaying to all emails this week. Thank you for understanding.
On to today!
+6R
another great day. Check out the review.

Unilever is consolidating above 200 MANYSE:UL is trading above the 200 MA with a minor downtrend, break of the trend will target around 64$. A close above all-time high will open the way for more gains. A good stock to hold for the long term with high dividends.
Hit the like button and follow if you find this useful :)
This is only my own view and not financial advice, do your own analysis before buying or selling
Happy Trading!


Long BPOversold, on lower trend line, building positive divergences, final drop to flush weak hands ? Long with stops below the lows, good risk/reward.


FTSE will now Crash to 3650 - the trade of the YearHello all
DuncanForex here with a follow up on my trade idea that I've been watching since Feb 2020 - with no advertising about anything so the post will stay active.
With the power move during February 2020 (The AB Move) and then a slower retrace to the previous area of support which is now resistance.
The FTSE broke out of its downward consolidation long and is now progressing higher over the past few months to the 61.8 Fib retrace.
The Bullish move that occurred last month pushed the price into the middle of the 61.8% and 78.6% zone, after the bearish moves this past week and the "High" now printed, the CD move will be completed and the FTSE will ultimately go down to 3650
I had shorted the market as per my related ideas below, and i now have new entrys that you can see in the picture. (if you zoom in) - and also on other posts
I do expect this to drop fast - with EU issues and Covid vaccines driving it lower.
It will close on a bearish Pin Bar on the Weekly chart today.
In turn, I do expect GBP to get stronger and stronger - so don't short any GBP XXX pairs.
Stay safe and safe trading
Duncan

UKX - expecting more upsideInto support - similar structure to H2 2020.
Expecting more upside
Best, HF

FTSE100Trade idea
Impulse move now corrected to the initial demand zone
IF unchanged / positive Economic data Look for potential Longs
19TH OF Feb (Multiple FTSE companies Earnings report ) A day to watch IF trade ongoing.

FTSE100 - UKX - WHERE TO NEXT?FTSE100 UKX - Range Bound - WHERE TO NEXT?
Technical View:
Resistance: 6782.5, 6823.0, 6900.5
Support: 6677.7, 6627.6, 6610.9, 6535.8 (200EMA)
Pattern: Multiple formation Bull Flag / Triangle Formation
How to approach this trade idea:
- Add alerts at key break out areas
- Wait for the break out and trade the pull back
- Check the key Fibs matching S&R Areas
- Don't forget to gain a good R/R
- Add limit orders to break out areas, bit more of risky approach as you don't want be part of fake break out!
Go with what you have written on your trade plan overall.
It's FRIDAY....! On a Friday - I take day trades, review my journal and get ready for the week ahead. It hasn't been bad week very choppy markets we are in range bound areas in most assets apart from Crypto's great momentum towards down side I always say in life and in the markets - What goes up, comes down eventually. Now it doesn't mean you're going to become profitable trader and come down - NO! What I mean is, your performance isn't going to be straight line there will be days up and down and let be honest with you - I don't always trade everyday because I know when I want to be part of the market, be disciplined! It does depends on way you mange your portfolio.
Have a great weekend.
Trade Journal
(Just a trade idea, not a recommendation)

FTSE testing at critical junstionBreak of the uptrend line was strong with a good impulsive candle. Now at critical support near 6600 level. 200SMA is also at support. An impulsive break lower could signal momentum to get us to 6500 target.
Risk-off this morning across the board. Some of it on news as China's surging COVID-19 cases trigger clampdowns.
Good Luck and Stay Healthy!
