80p potential retrace - 110p resistance - bull trendLook for RSI retrace to support before entry if keen on the company & chart.
I see 80p as potential retrace before heading to 110p -
134p is ultimate target but keep an eye on divergences on RSI levels
FTSE

43.4p - 47p resistance - bullish weekly candleNeeds to close on daily at 35.7p but if so then an entry would be good as it could well go to 43.4p resistance (previous support)
keep an eye for RSI trend break if 43.4p is touched to analyse if it will go higher.
47p also where 200ma weekly is might well have a breather after so best to scale out near here to protect profits.
Trading Update & Outlook
As announced last week, revenue for the financial year ending 31 March 2019 is expected to be approximately GBP57.0 million (2018: GBP44.6 million) and adjusted EBITDA for the same period is expected to be approximately GBP11.0 million (2018: GBP8.4 million).
The Board believes that Fulcrum's breadth of services across multi utility, gas and electrical markets, sees it well positioned to capitalise on opportunities across the infrastructure and asset ownership sectors. The headwinds encountered in the larger electrical infrastructure sector continue to present challenges but the Board remains confident in the Company's longer term prospects.
Martin Harrison, Chief Executive of Fulcrum, said:
"We continue to see sustained growth in our gas infrastructure and asset business and are encouraged by the smart metering, cross-selling and electric vehicle charging opportunities for the Company. Despite the current conditions in the larger electrical sector, we remain confident that the successful execution of the Company's strategy and balanced approach to the industrial, commercial and residential markets will deliver long term, sustainable growth for Fulcrum."

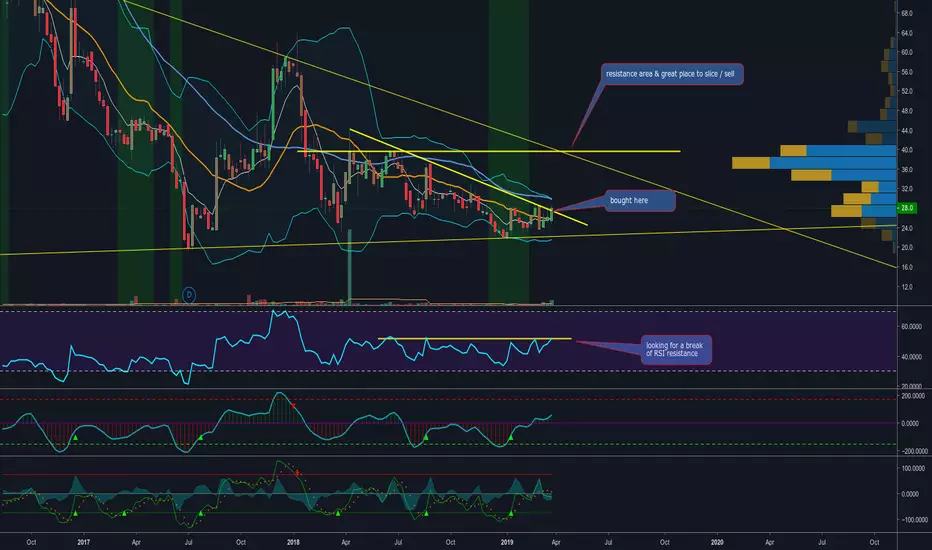
GBP 95.5m in cash - mcap at £47.2m - SD upped holding to 29.89%Extremely bullish here based on the numbers from last report.
Looking for 40p at least if not more.
Hoping to see an RSI & trend line break out
Sports direct will need to do a take over offer if they get to 30% holding. they have 29.89% at moment.
Continued strong liquidity with Group cash of GBP95.5 million
as at 26 January 2019 (2018: GBP84.9 million) and access to aggregated
facilities as at today's date of up to GBP110 million across
the UK and Spain
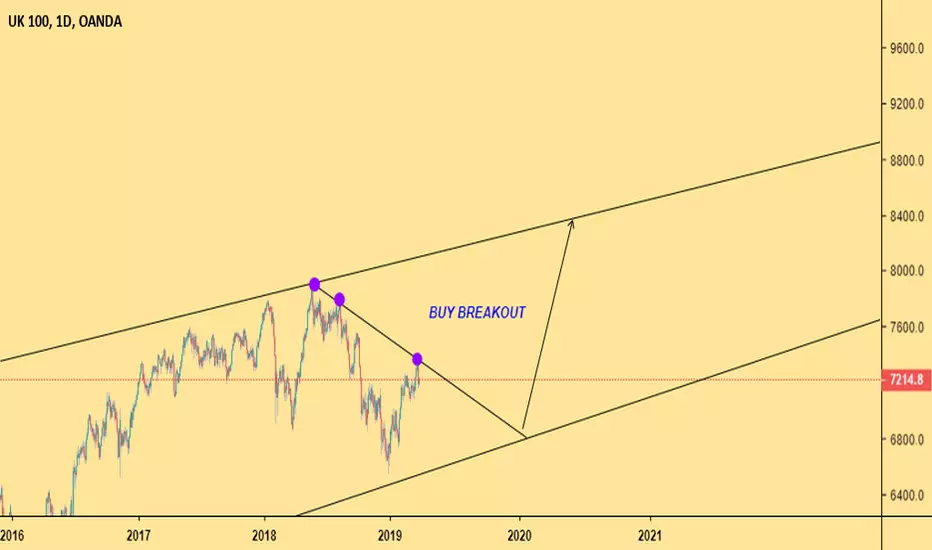
FTSETREND: UPWARDS
- WAIT FOR BREAKOUT
- WAIT FOR PULLBACK
- WAIT FOR SOLID CONFIRMATION THEN EXECUTE
8.50p / 10.65p if close above 20ma this wk / bullish divergenceI believe some results will be coming tomorrow, this stock might rerate if good so worth keeping an eye.
profit results are not as impressive last time so not sure but TA shows a possible reverse to come if 20ma gets broken.

[SLA] ABC STRUCTURE IN PLAY.......buy on the dip!!
COMPANY PROFILE
Standard Life Aberdeen plc, formerly Standard Life plc, is a United Kingdom-based global investment company. The Company operates through four segments, which include Aberdeen Standard Investments, Pensions and Savings, India and China, and Other. The Aberdeen Standard Investments segment provides a range of investment products for individuals and institutional customers through various investment vehicles. The Pensions and Savings provide a range of long-term savings and investment products to individual and corporate customers in the United Kingdom, Germany, Austria and Ireland. The businesses included in India and China offer a range of insurance and savings products and comprise its life insurance associate in India, its life insurance joint venture in China, and operations in Hong Kong. Its Other segment primarily includes the corporate center and related activities.
Sector: Financials
Industry: Investment Management & Fund Operators
Employees: 7768
If you think this analysis can be useful and you want to receive new updates about this idea, click on LIKE button!
Thank you for support and trade with care!

The Next Big Sell OffTypically I only trade the major stock indices when I can see a big move happening. This is because they are dictated by many individual stocks which of course can be influenced by a multitude of factors, so its very easy to get caught on the wrong side of an unexpected move.
The great thing with major indices however is that they do serve as great reflections of the economy as a whole. Most if not all esteemed economists are predicting that 2019/2020 will see the next recession. I won't go into the reasons for this, simply because I don't have all the research myself and also I don't have the time. Simply put, my bias on all of the major indices is bearish.
So when now assessing the price action we have seen develop over the past 12 months you can see this time last year saw a major rally into the 7900 region where we saw the 2018 high. Then throughout the majority of the year price was ranging above 7500 and below 7800 before we started to see the cracks emerge in the global stock market. Ever since price broke the 7500 barrier we have seen a major sell off, verging on official bear market conditions in some sectors. There was some temporary support of 7200 which has become a major Swing Level in the market but this got viciously broken in early October and as winter 2018 set in we only saw the market sell off even more. Even breaking the 7000 level!
More recently since 2019 price has recovered above 7000 but still has not broken above the 7200 Key Swing Level mentioned previously. As I stated this level has become such a barrier because not only term of technical analysis has it created a resistance level and key swing level for price but also because price has never broken it since the widespread concerns within the global stock market come to the fore.
So I am opening some short positions around this zone and will be targeting 7100 as a safe target that still leaves room for the market to range between 7000 and 7200.

Symmetrical triangle FAKEOUT FTSEDeclining volume with a breakout from triangle, in a bearish market.

FTSE Potential ShortLooking for a potential short on the FTSE 4 hourly chart. We need to see a break and close below the ascending trend line. We have MACD Divergence so just need to see a set up and trigger candle.
Looking for the first 4 hours of trading Monday to review.

RSI & price breakout 300p target - bullish Don't hold this stock but quite bullish on the move & I believe it will head to 300p
RSI & price break out, looks strong & easy to see on RSI

SGRO Long This week I will be keeping an eye on the UK based REIT SGRO, their main business is managing industrial storage units, the stock is within 3% of its all time highs and is consolidating nicely around the 662 level. The consolidation has been a bit all over the place for my liking and that skews the entry a little bit as I like to clear all previous highs with my entry to avoid running into previous resistance but the spike on the first of march would make the entry too high from the level. that being side the price is bunching up nicely under the level and on the weekly scale an inside weekly doji gives me the feeling that we could see some action within next weeks trading. My improvised entry would be 663.2 as this clears the attempt on the 30th of January but if you want a clear margin of safety in the trade then 6666.3 would be the stop entry. This stock is a relatively low beta at 0.76 (yahoo finance) which I think could help it out given the weakness lately in the FTSE 100, I hope you liked this idea, if you did be sure to comment what you like if not then that's welcome too.
Happy trading.
Joe

Bullish divergence / resistance 190 - fibs 786 #mfchartWe are right in previous support area plus bullish divergence, resistance at 190p but still a chance of below support at 100p depending on market in general.
with 5G possibly coming in I think this will be a good opp for new entries in coming weeks.

SELL YOUR HOUSE AND GO LONG hahaYou can see from our support line ( green line ) that this is a VERY strong level that price has bounced of many times, Price has also bounced off this level this week and we can see a run up to our resistance zone ( green box )
Of course surrounding Brexit and businesses not knowing how the deal or no deal will affect them and trading then you have to be cautious trading the FTSE 100 as this is comprised of 100 companies listed on the London stock exchange with the highest market capitalisation, So any laws that stop these businesses earning will drastically affect the FTSE 100 price.
We suggest trading this with a very tight SL, but we can see this been a very nice opportunity to go long and make some decent money.
p.s don't actually sell your house you moron ;p

FTSE Short - 99%I don't usually say this but this is a 99.9% guaranteed short trade. But there is always that 0.01% chance it wont...


UKX FTSEUKX FTSE Chart using Blue Sky Plus Indicator. Message or Comment to get a free trial of the indicator.https://www.tradingview.com/script/lqS4a5pU-Blue-Sky-Plus-Day-Positional-No-Repaint-with-Alerts/

Paddy Power Betfair (PPB) Short PPB's investors haven't had much to laugh about this year, not even their comical television adds could cheer them up, i'm sorry to say that from the looks of the daily chart the stock could be in for some more pain soon. After a tremendous run in may the stock has seen a lot of downside until finally finding support at the 6000 level currently the price is having it's third attempt to break the support. In the run up to the last two tests of support the stock has put in lower highers which suggests that the sellers are fully in control of the stock, the last two trading days of last week posted bearish inside days suggesting some indecision in the stock indicating a potential move this week. I am inclined to go short in the name with a stop order at 5999 below support and a stop loss placed at the high of the day prior to the break out from the support. If you enjoyed this idea give me a follow there will be more to come and if you hated it please let me also, happy trading.
Joe
LSE:PPB

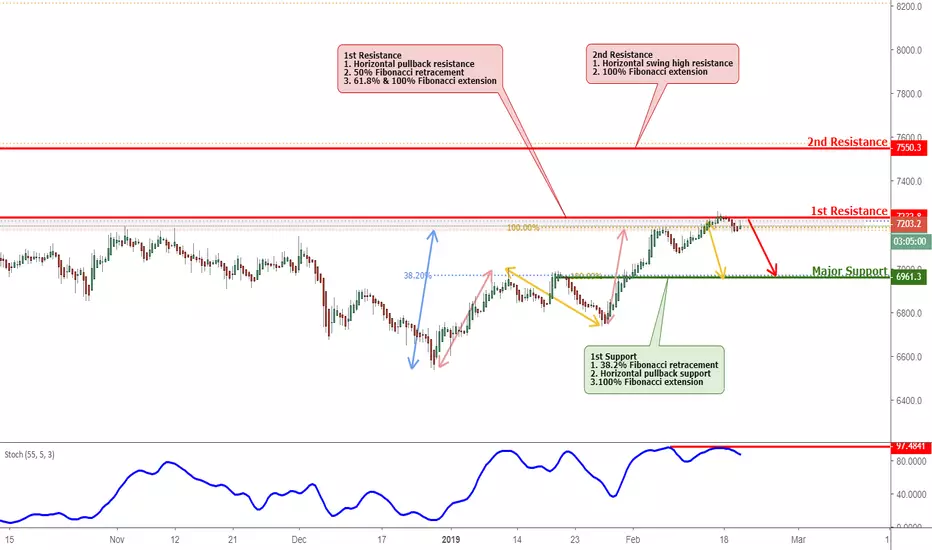
UKX Reversed Off Resistance, Prepare For Further DropFTSE 100 approached our first resistance at 7233 (horizontal pullback resistance, 50% Fibonacci retracement , 61.8% & 100% Fibonacci extension ) where a strong drop might occur below this level pushing price down to our major support at 6961(38.2% Fibonacci retracement , Horizontal pullback support, 100% Fibonacci extension )
Stochastic (55,5,3) is also approaching resistance where we might see a corresponding drop in price.
Trading CFDs on margin carries high risk. Losses can exceed the initial investment so please ensure you fully understand the risks.
FTSE 100 Intra Day Resistance at 7300There is a major resistance at 7300 area around daily MA200. Most likely going to have a reaction of 40pts or more


FTSE - Intra Day Analysis Sell from 7210-7240 for 40ptsIf FTSE rallies to 7210+ , sell for 40pts as FTSE is a bit over bought at the moment.

Bullish channelBullish channel on FTSE MIB on the daily chart. 20226 could play resistance.
***As usual, not a trading advice of any sort. Informational and educational purposes only***

The market is ALIVE for one last move higherThis is by far the BEST video that will line everything up for you by me. I gave it MY ALL with trend analysis and elliott wave. be ready and spread this video within 48 hours to help everyone for this last move higher.
