FTSE100 4 Hour Elliott Wave AnalysisHello Traders,
In this analysis, we will have a look at the FTSE -0.03% Index in the 4-hour chart.
FTSE -0.03% cycle from 2/11/16 low ended at the peak of 01/12/18 (7792.56) in red wave a, and red wave b pullback is proposed to be completed at 03/26/18 low (6869.79).
Up from there, black wave ((1)) ended at 7904.55 peak. The rally from 03/26/18 low can be sub-divided in 5 waves with an extended wave 3. Where blue wave (1) ended at 03/27/18 peak (7046.9). Below from there, it ended blue wave (2) correction at 03/28/18 low (6923.9).
Up from that low, it ended blue wave (3) at the peak of 05/15 peak (7752.9) and blue wave (4) pullback at 05/17 low (7714.6). Up from there, it ended the cycle from 03/26/18 low in black wave ((1)) at the peak of 05/22 (7907.9).
Short-term it has ended the cycle from 05/22/18 peak (7904.55) at 05/29/18 low (7609.8) in blue wave (W) and ended the correction to that cycle in blue wave (X) at 06/14/18 peak (7792.9). While pullbacks stay below blue wave (X) peak, it is expected to see more downside to the equal legs - 1.236 extension area of blue ( W ) - ( X ) which should offer us a good buying opportunity as long as the pivot at 6869.79 in our distribution system stays intact.
FTSE

Tesco May Start A Bull TrendLast post: April 19th. See chart .
Review: Price was approaching the resistance level from the April 2015 high.
Update: Price is now above the resistance level.
Conclusion: If price can remain above the resistance level then we may see the start of another bull trend in this stock.
Any comments or questions, do not hesitate to leave them below. Give us the thumbs up if you share our sentiments!
Sublime Trading

Kaz Minerals Falls To SupportLast post: May 31st. See chart .
Review: Price had bounced off a support area and was above the £10.00 round number.
Update: Price has dropped lower but is finding support at another support level. The 200 simple moving average below may also provide support if price moves lower.
Conclusion: We will have to see if the support area can hold. It would be best to wait for price to break the 7th June high before considering long trades.
Any comments or questions, do not hesitate to leave them below. Give us the thumbs up if you share our sentiments!
Sublime Trading

Hargreaves Lansdown Is Pulling BackLast post: June 14th. See chart .
Review: Price was making new highs after breaking through resistance.
Update: Price has started to pull back and is heading towards the support area.
Conclusion: We will have to see how price reacts to the support level and wait for a breakout of the previous high before taking long trades.
Any comments or questions, do not hesitate to leave them below. Give us the thumbs up if you share our sentiments!
Sublime Trading

Burford Capital In ConsolidationLast post: June 6th. See chart .
Review: Price was testing the support level.
Update: Price has since come down to test the support level which includes the 50 simple moving average, and is consolidating between the support and resistance level.
Conclusion: Applying patience and waiting for price to break through resistance before considering long trades again.
Any comments or questions, do not hesitate to leave them below. Give us the thumbs up if you share our sentiments!
Sublime Trading

Synthomer Breaks ResistanceThis stock is featuring for the first time on our TradingView blogs.
Current setup: Price is overall bullish after breaking through resistance.
Conclusion: We can look for long opportunities following a daily breakout.
Any comments or questions, do not hesitate to leave them below. Give us the thumbs up if you share our sentiments!
Sublime Trading

Spiraz-Sarco Engineering Climbing HigherThis stock is featuring for the first time on our TradingView blogs.
Current setup: Price is trending up well after breaking out of consolidation.
Conclusion: This stock is looking strong and we can look for long opportunities following a breakout on the daily timeframe.
Any comments or questions, do not hesitate to leave them below. Give us the thumbs up if you share our sentiments!
Sublime Trading

UK100 - Trading update 13th of JunePotential (small) upside target towards 7900.
Otherwise, move down towards 7600 and 7500.

FTSE 100 - Daily Update for June 12nd, 2018.The FTSE 2-hour chart is corresponding to the Daily Update for June 12nd, 2018.

FTSE 100 - Daily Update for June 08th, 2018.The FTSE 2-hour chart is corresponding to the Daily Update for June 08th, 2018.

FTSE Elliott Wave View: Buying Opportunity SoonHello Traders,
In this short-term analysis, we will have a look at the FTSE100.
FTSE cycle from 3/28 low is proposed to be completed at 7904 high in black wave ((1)), below from there the index is correcting that cycle & expected to find buyers in 7-11 swings provided the pivot at 6867 low in our proprietary distribution system stays intact.
Short-term it has ended the cycle from 05/22/18 peak (7904.55) at 05/29/18 low (7609.8) in blue wave (W) and ended the correction to that cycle in blue wave (X) at 06/04/18 peak (7774.2). While pullbacks stay below blue wave (X) peak, it is expected to see more downside to the equal legs - 1.236 extension area of blue ( W ) - ( X ).
We don’t like selling it and prefer buying the dips at the extreme areas in 7-11 swings as far as pivot at 3/26 low (6865.8) stays intact.

FTSE short term flag patternBreak of the 7720 level can get us in the trade.
Target area should be somewhere in the fib zone, difficulty with this setup is that the resistance is a quite wide zone as this is our target.
Setup is off the table when it breaks below 7690.

FTSE 100 Still Very Much in Bear Market TerritoryI waited for nearly a year and a half to see this near 8000 price level retest.
Now, i'm the biggest bear around.


FTSE Biased Long for the 6th week in a rowWe've been suggesting FTSE long to clients for the past 6 weeks and the bias is still in play.
7800 is the main support zone currently. So long as it holds on any retracement,
the bias remains intact. GBP weakness is also helping this trade, since FTSE is priced in GBP.

FTSE Successful Retest of Huge Multi year consolidationEnormous consolidation has been conculuded after retest of the breakout.
10,000 looks like it will be tested.

FTSE100 UKX LONG WEEKLY TREND CONTINUATIONVery good opportunity to hop on the trend. Resistance becomes support previous High. Bullish on equities. 38.2% fib retracement. Target1 retest of structure T2 127.2% fib extension. 4H 2618 trade double topped with break of structure + retracement. GOOD LUCK

Double Trouble FTSE?Some very quick analysis of the FTSE100 - Could we see a double top form at this level? If it does remain bullish we would need to see a retracement soon so this may be a great opportunity for a short term sell on this asset!

UKX Time to Short?The last call was good enough to make money, but as I said the last time, I do not trade this, but if you do, here you have my own view for it.
Learn how to beat the market as Professional Trader with an ex-insider!
Have a good Trading Week!
Cream Live Trading, Best Regards!
FTSE Upside limited, eyeballing a 30% correction via Hard BrexitHere actively looking to build a full sized position in UK Equities on the sell side.
=> Hard Brexit now sitting in 'done deal' territory.
=> All UK sectors are starting to cough and beckoning for help.
=> Expecting the shock to be felt in both the Equities market as well as the Pound (see related ideas).
=> This will detonate soon and provide a category 5 hurricane for little England.
There is a more detailed description in the related Sterling idea covering the political side as well as the fundamental side, I would highly recommend reading this for those tracking Brexit in FTSE and Pound. Things are going to get dark very soon.

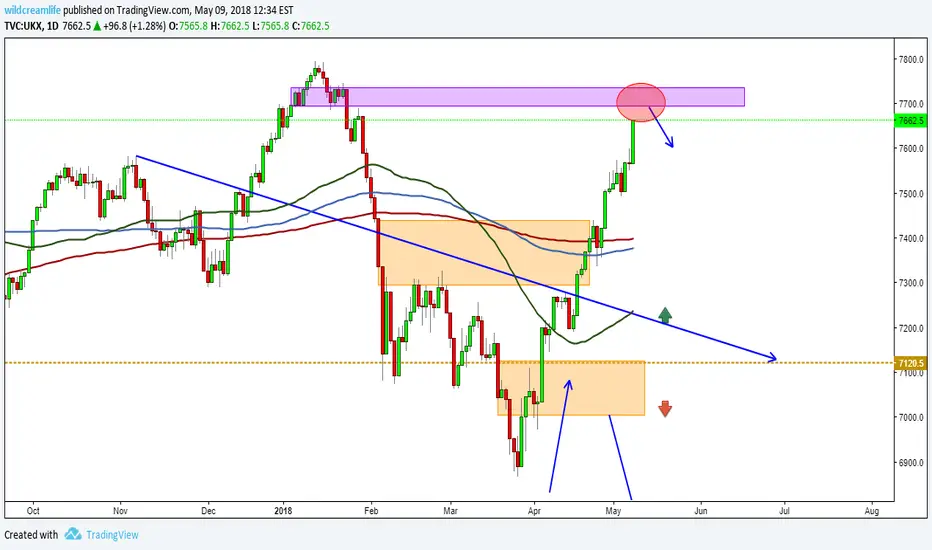
FTSE (UKX): Its At A VERY Important Point! +320 Points Profit! If you follow the FTSE at all and you also follow my trades, well, you've been KILLING IT! We just closed our LONG trade on the Footsie and bagged another +320 points to go along with that +635 points whooper of a trade when we caught that collapse back in January. That is a +955 points profit on 2 trades! Yep, we are 100% on our trades in the FTSE so far since we started offering analysis on it. Do the math. Each point is worth £5.
Anyway, I'm not here simply to toot my own horn. Others here do that more than enough! I tell you about what I and my subscribers did simply so you will at least pay attention to what I have to say so that you may have some confidence that I know what I am talking about. Then maybe you might learn a thing or two from my posts. After all, I don't post for my own health!
Ok, so now that we have closed our trade and done everything EXACTLY according to our trading plan (do you have one? You BETTER before you ever take any trade!), we are out and are now waiting on what is to come next. And what is that? A possible BIG reversal back down! Maybe even bigger than what we made on the way up! It is now retesting that broken trend line of the broken trading channel it had previously been in for a some time. This is very typical price action in that prices will usually (but not ALWAYS! Nothing is 100%) retest whatever level, zone, formation, pattern or trend line it broke from. And then IF it gets rejected again (like a jilted lover), it will react violently and usually forcefully in moving away from that rejection point. And usually, that move in the opposite direction is not a simple retracement but rather a complete reversal in direction. That makes for a strong move away.
Yes, it certainly takes some skill, experience and expertise to recognize and differentiate from different types of price action in this setup but when you can recognize it and MORE IMPORTANTLY take advantage of it, you can score your self BIG WINNERS like we do!
So watch the trend line and prices and see what happens BEFORE you leap and take a SELL! You need PATIENCE! I can't emphasize that enough! PATIENCE! Remember also that this has been a strong uptrend and you don't want to go against such a move! Let it prove that it is done first!

FTSE 100 Interesting movementI do not trade this, neither I'm keen on it but looks interesting after a long way down, till where? perhaps boxes are the answer.
Remember Tradingview followers have a half price on Professional Trading Course for the next one in April. Just 25 seats available
Learn how to beat the market as Professional Trader with an ex-insider!
Have a good Trading Week!
Cream Live Trading, Best Regards!

FTSE 100 SHORT!Right guys, I really do think that we're in for a short.
I've been waiting for some time on this short to be totally honest, prices could potentially drop down to lows of 6975.0
Let's wait and see!
TP: 6975.0
