FTSE Buy signalThe FTSE 100 Index (UK100) is consolidating on the 1D MA50 (blue trend-line) for the 5th straight day. This is the first pause to the uptrend that started on the August 18 bottom, right on the 6-month Support Zone.
With the 1D RSI still not close to the overbought barrier and the 1D MACD on a Bullish Cross, this is the last bullish signal towards the Lower Highs trend-line. Our target is 7690, just below the Resistance Zone.
-------------------------------------------------------------------------------
** Please LIKE 👍, FOLLOW ✅, SHARE 🙌 and COMMENT ✍ if you enjoy this idea! Also share your ideas and charts in the comments section below! **
-------------------------------------------------------------------------------
💸💸💸💸💸💸
👇 👇 👇 👇 👇 👇
Ftse100

FTSE Elliott Wave Analysis for Tuesday 05/09/2023The primary scenario is playing out and we reached the wave X area. There are several indications that a reversal to the downside is near.

FTSE Elliott Wave Analysis for Monday 04/09/2023The primary scenario is playing out and we reached the wave X area. There are several indications that a reversal to the downside is near.

FTSE Elliott Wave Analysis Higher Timeframe (02/09/2023)In the higher timeframe, investors should wait for the next pullback to buy again. We are approaching the first relevant areas.

FTSE Elliott Wave Analysis for Friday 01/09/2023The primary scenario is playing out and we reached the wave X area. There are several indications that a downward reversal is near.

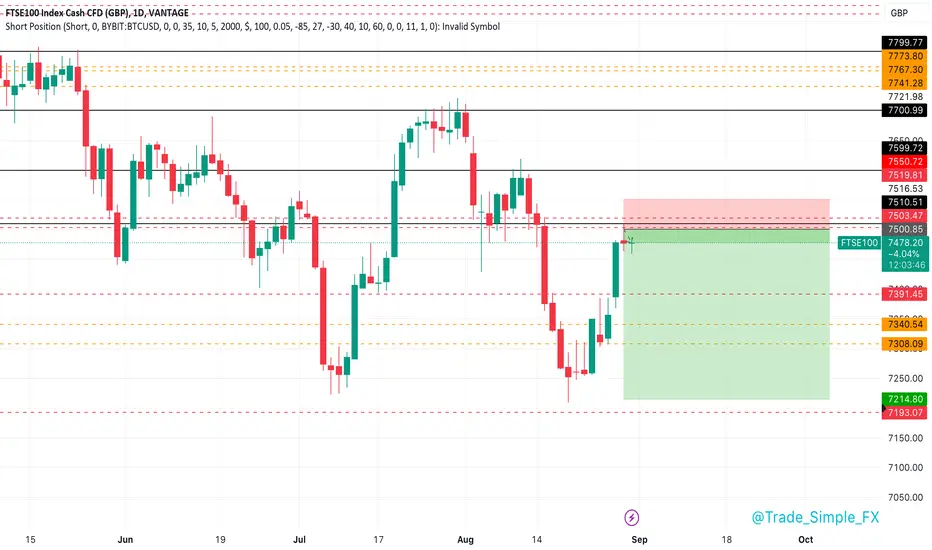
FTSE100 - Short SetupFTSE100 D1
Moved up a timeframe here for the FTSE100 analysis, we are starting to see some rejections for the second day here. A little different to the play we can see on the DAX, the DAX looking very bullish thus far. That being said, could simply be a second entry/retest offering.
Indices trade and analyse a little different to FX. We base our entries and zones from less confluence and more impulse due to the volatility they bring.
FTSE Elliott Wave Analysis for Thursday 31/08/2023The primary scenario is playing out and we reached the wave X area. There are several indications that a downward reversal is near.

FTSE Elliott Wave Analysis for Wednesday 30/08/2023The primary scenario is playing out and we reached the wave X area. There are several indications that a downward reversal is near.

FTSE Elliott Wave Analysis for Monday 28/08/2023The primary scenario (in green) assumes more upside in a corrective pattern to finish wave X. The secondary scenario (in red) assumes that we will get an ABC correction and therefore we need another leg down (wave ((v))) to finish wave A.

FTSE Elliott Wave Analysis Higher Timeframe (26/08/2023)In the higher timeframe, investors should wait for the next pullback to buy again. We are approaching the first relevant areas.

FTSE Elliott Wave Analysis Higher Timeframe (20/08/2023)In the higher timeframe, investors should wait for the next pullback to buy again. We are approaching the first relevant areas.

FTSE Elliott Wave Analysis for Friday 18/08/2023The wave ((b)) of the abc correction might be finished. We are in the areas where wave c, wave (y), and wave ((b)) should end. From here we can expect a reversal.

FTSE Elliott Wave Analysis for Thursday 17/08/2023The wave ((b)) of the abc correction might be finished. We are in the areas where wave c, wave (y), and wave ((b)) should end. From here we can expect a reversal.

FTSE Elliott Wave Analysis for Wednesday 16/08/2023The wave ((b)) of the abc correction might be finished. We are in the areas where wave c, wave (y), and wave ((b)) should end. From here we can expect a reversal.

FTSE Elliott Wave Analysis for Tuesday 15/08/2023More downside is expected as an abc correction to finish wave c, wave (y) and ((b)). From there we go long again.

FTSE Elliott Wave Analysis for Monday 14/08/2023More downside is expected as an abc correction to finish wave (y) and ((b)). From there we go long again. However, if the current wave (x) high does not hold, another short can be initiated.

FTSE Elliott Wave Analysis Higher Timeframe (12/08/2023)In the higher timeframe, we are still bearish but currently doing a correction to the upside. For traders, a good short opportunity is coming. Investors should wait for the next pullback to buy again.

Trading week recap for NASDAQ, DOW, DAX & FTSE (12/08/2023)Let's look back at the past trading week and learn from it. What went well? What could be better?

FTSE Elliott Wave Analysis for Friday 11/08/2023As proposed yesterday, we sold the wave (x). If the current high does not hold, another short can be initiated. We now wait for more downside. Next step is to buy wave (y) and ((b)).

FTSE Elliott Wave Analysis for Thursday 10/08/2023We are somewhere in between and we have to wait for more upside or downside before entering a trade. In case of more upside, the wave (x) can be sold. In case of more downside, the wave ((b)) can be bought.

FTSE Elliott Wave Analysis for Wednesday 09/08/2023We are somewhere in between and we have to wait for more upside or downside before entering a trade. In case of more upside, the wave (x) can be sold. In case of more downside, the wave ((b)) can be bought.

FTSE Elliott Wave Analysis for Tuesday 08/08/2023We are now somewhere in between and we have to wait for a bit more upside or downside before entering a trade. In case of a bit more upside, the wave (x) can be sold. In case of a bit more downside, the wave ((b)) can be bought.

FTSE Elliott Wave Analysis for Monday 07/08/2023We believe the wave ((b)) to the downside can be finished. If not, it becomes the next buying opportunity. A wave ((c)) to the upside should follow.
