FTSE Elliott Wave Analysis for Wednesday 17/05/2023Trading day preparation. Although pullback is expected in the higher timeframe, we can see some more upside in the lower timeframe. We discuss several scenarios that could play out.
Ftse100

FTSE Elliott Wave Analysis for Tuesday 16/05/2023Trading day preparation. Although pullback is expected in the higher timeframe, we can see some more upside in the lower timeframe. We discuss several scenarios that could play out. We see two ways to enter a trade.

FTSE Elliott Wave Analysis for Monday 15/05/2023Trading day preparation. Although pullback is expected in the higher timeframe, we can see some upside today in the lower timeframe. We discuss several scenarios that could play out. We see three ways to enter a trade.

FTSE Elliott Wave Analysis for Sunday 14/05/2023A pullback in the higher timeframe seems likely. We have 5 waves up as an impulse in the weekly, daily, and 4h timeframe. However, as divergence in the weekly is not really outspoken, a new high is still possible. Investors should wait for the pullback to buy. Traders should analyze the lower timeframe.

FTSE: About to give a strong longterm buy signalFTSE100 has been trading inside a Channel Up since the October 13th 2022 bottom, currently pulling back after a rejection on the internal LH trendline. This has turned the 1D timeframe neutral (RSI = 48.285, MACD = 4.950, ADX = 49.378) and with the price on the 1D MA50, those are the conditions for a buy.
The Buy signal trigger however would be the index crossing over the LH trendline, as it did on a similar pattern on November 10th 2022. We will buy either on that trigger or on the 1D MA200. In both cases TP = 8,250.
## If you like our free content follow our profile to get more daily ideas. ##
## Comments and likes are greatly appreciated. ##

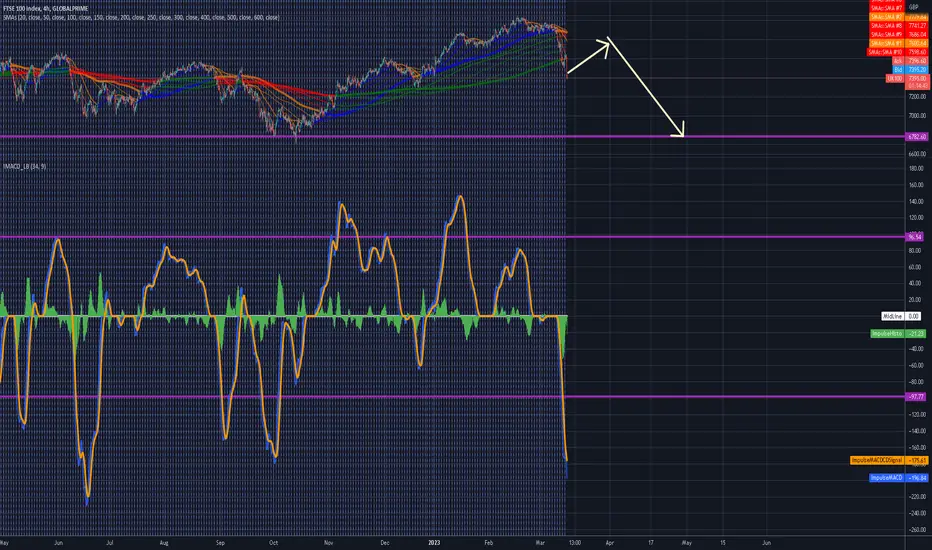
UK100 to start a selloff?UK100 - 24h expiry -
We are trading at overbought extremes.
Short term MACD has turned negative.
A break of 7800 is needed to confirm follow through negative momentum.
Short term bias has turned negative.
We look for losses to be extended today.
We look to Sell a break of 7799 (stop at 7838)
Our profit targets will be 7701 and 7681
Resistance: 7835 / 7860 / 7880
Support: 7809 / 7780 / 7750
Risk Disclaimer
The trade ideas beyond this page are for informational purposes only and do not constitute investment advice or a solicitation to trade. This information is provided by Signal Centre, a third-party unaffiliated with OANDA, and is intended for general circulation only. OANDA does not guarantee the accuracy of this information and assumes no responsibilities for the information provided by the third party. The information does not take into account the specific investment objectives, financial situation, or particular needs of any particular person. You should take into account your specific investment objectives, financial situation, and particular needs before making a commitment to trade, including seeking advice from an independent financial adviser regarding the suitability of the investment, under a separate engagement, as you deem fit.
You accept that you assume all risks in independently viewing the contents and selecting a chosen strategy.
Where the research is distributed in Singapore to a person who is not an Accredited Investor, Expert Investor or an Institutional Investor, Oanda Asia Pacific Pte Ltd (“OAP“) accepts legal responsibility for the contents of the report to such persons only to the extent required by law. Singapore customers should contact OAP at 6579 8289 for matters arising from, or in connection with, the information/research distributed.

Short FTSEMy simple short idea, divergance on few time frames. We are overbought, no reason for more upside for me.
Take care

UK100 FTSE Technical Analysis and Trade IdeaIn this video we focus on the FTSE UK100, however, the US100, US30, UK100, and DE30 are analysed to find a common theme between these four instruments. The stock markets have traded into key support levels and have been rangebound for some time. We are now seeing some bearish momentum evident in the charts. The trend, price action, price gaps, market structure, and a potential trade opportunity are covered. It is important to note that this is not financial advice and is meant for educational purposes only.

FTSE 100 AT MAJOR RESISTANCEFTSE 100 has reached a major resistance after the breakdown that we called around a month ago. We are looking for a reaction at this level to possibly go short and we will updated if we take that position.

FTSE 5-3-5 pattern Out of all the indexes the FTSE one has the cleanest looking 5-3-5 pattern. Perfect ABC to the vwap from top. A pivot here should start another long 5-wave down. 5th wave extension will cover the most ground on capitulation.

FTSE100 Bottom formed. Buy opportunity.FTSE100/ UK100 is forming a Bottom on a 1 year Support Zone. The RSI is also bottoming out.
Target 7820 (+8.70% rise0>
Follow us, like the idea and leave a comment below!!

Break out for BATSNot a BATS out of hell just yet but a breakout all the same. Broken away from 2756 and a good dividend, but now has to clear 3000 last established in Jan 2020.

FTSE Update Pre BOEHey Traders,
The FTSE has been wildly moving between extremes.
We can now look further at key PA levels.
Watch for more.

FTSE 100 | UK 10 | DECRYPTERS Hi Welcome to Decrypters
Simple reasons to Buy
Liquidity Raid
Fib retracement
Weakness in Forex Pairs
Daily 200 EMA

UK100 CrashHello we are part of a new community called lucky trading club in tradingview so let's begin our second analysis.
UK100, ftse100 will crash, we have a eqh on 7700 with a lot of liquidity it was already taken last friday on 7900, also we have 5 waves of elliot and harmonic pattern in the range of 7700-7900
We still in uk100 ATH when all institution begin to sell gradually and uk economy still in acute crisis because inflation and decrease of pbi.
In ressume a lot of confluences to take this short position.
Type of trade: Swing.
Entry: 7840-7900
Our targets
Target 1: 7700
Target 2: 7580
Target 3: 7400
Target 4: 7200
Max x20

FTSE 100 crash looks likelyPossible Head and Shoulders pattern developing
May recover over a month as MCAD is favorable for a short-term BUY,
but then crash to about 6700, so I reckon it's best to short this after it has recovered.
Big Breakdown on FTSE 100/ UK 100After ATH for the FTSE100, the development of bearish divergence within a rising wedge has occurred.
This bearish pattern has broken down now and I AM SHORT at the current levels.
I am looking for the price to come down to 7700 where I will take some profits. Followed by 7600, 7400, and finally 7000
I don't have a stop loss in place as I think it could put in another confirmation high just sub 8100, which would still keep me bearish. I will close the position if a bullish edge develops

Has FTSE formed a swing low?UK100 - Intraday -
Previous support located at 7600.
Previous resistance located at 7650.
Price action has continued to trend strongly lower and has stalled at the previous support near 7500.
Price action looks to be forming a bottom.
Risk/Reward would be poor to call a buy from current levels.
A move through 7650 will confirm the bullish momentum.
We look to Buy at 7521 (stop at 7456)
Our profit targets will be 7681 and 7711
Resistance: 7650 / 7700 / 7750
Support: 7600 / 7500 / 7400
Risk Disclaimer
The trade ideas beyond this page are for informational purposes only and do not constitute investment advice or a solicitation to trade. This information is provided by Signal Centre, a third-party unaffiliated with OANDA, and is intended for general circulation only. OANDA does not guarantee the accuracy of this information and assumes no responsibilities for the information provided by the third party. The information does not take into account the specific investment objectives, financial situation, or particular needs of any particular person. You should take into account your specific investment objectives, financial situation, and particular needs before making a commitment to trade, including seeking advice from an independent financial adviser regarding the suitability of the investment, under a separate engagement, as you deem fit.
You accept that you assume all risks in independently viewing the contents and selecting a chosen strategy.
Where the research is distributed in Singapore to a person who is not an Accredited Investor, Expert Investor or an Institutional Investor, Oanda Asia Pacific Pte Ltd (“OAP“) accepts legal responsibility for the contents of the report to such persons only to the extent required by law. Singapore customers should contact OAP at 6579 8289 for matters arising from, or in connection with, the information/research distributed.

FTSE 100 SELL (UK100 INDEX)Hi there.
Price is moving impulsively to the downside.
Wait for the price to complete the pattern and watch strong price action for sell.

FTSE BULLISH EXHAUSTION?I am currently looking to sell this index.
It is no surprise to anyone who reads my ideas ,not many:p, that I am of the option that whilst the latest inflation data coming from the UK has ticked lower, I believe it will again raise its head to bite the UK on its ar$e.
I guess more importantly, I think the inflation data coming out of the US over the coming months will be hot and with that the dollar will rally once again. Although not quite as it did in 2022. This will result in a significant exportation of inflation around the world which will further increase the prices of food, energy and fuel; pretty much everything that is priced in USD. Ultimately hurting the economies which the companies comprising the FTSE rely on. Aside from big pharma and petrochemicals.
Moreover, if you look at the chart above, the FTSE has been in a decent rally since October of last year which culminated in an all-time high milestone of 8000. The rally to date has been moving in an ascending triangle (WHITE) which coincided nicely with relatively strong divergences between the move up to 8000 and the indicators shown (RED).
This is often a good indication of weakness in a prevailing trend and may potentially signal bullish exhaustion. The price broke this triangle structure on 28/02/23 with a failed rally back to support which indicates that we may be looking at a decent move to the downside in the coming weeks and months. As such, I’m now looking to enter a sell trade from here-on.
My POI for this move is anywhere between 8950 and 8130 (current price to top of structure)
As always I will be scaling in my positions as (or if) the price moves higher, which I expect it will until Powell comes out and admits that last months 25bps hike was a mistake.
It’s important to note that the UK economy and this index are not overly correlated because whilst the companies making up the FTSE may be HQ’d in the UK, their market audiences are more global. Please bear in mind that this is not a full breakdown or analysis for an entry, it is just my current thoughts on this market and a very basic o view of why I’m looking to short this index. Please always do your own analysis and always trade with caution.

FTSE to recoup some of Friday's 'SVB' selloff?Friday was the most bearish day for the FTSE since September, as concerns over SVB (Silicon Valley Bank) and the potential for contagion across the finance sector weighed on sentiment. Yet a joint statement from the Fed, Treasury and FDIC (Federal Deposit Insurance Corp) released on Sunday assured that deposits at the bank will be guaranteed, which helped boost sentiment in today's Asian session.
Futures markets point to a higher open, and we suspect the FTSE can rebound and recoup at least some of Friday's losses. Note that the RSI (2) reached oversold by Friday's close, and the low of the day found support around the 2019 / 2020 highs and monthly S1 pivot.
The bias is bullish above Friday's low and for an initial move to 7800, a break above which brings 7850 into focus.

FTSE 100 Index Trending HigherFTSE 100 Index trending higher on the weekly chart; current price is above its 10 week moving average (bullish); both the 4 and 13 week rate of change indicators above zero (bullish); upside prospects for the short to medium term (5-49 days) spotted at 8,023 and 8,203, while downside price risk below 7,742 implies the end of the prevailing up-trend.
Not investment advice. Past performance does not guarantee or predict future performance.

FTSE Broke from a range to the upside.Previous support located at 7950.
Previous resistance located at 8000.
The correction lower is assessed as being complete.
Further upside is expected.
Risk/Reward would be poor to call a buy from current levels.
Our profit targets will be 8006 and 8024
UK100 - Intraday - We look to Buy at 7926 (stop at 7894)
Resistance: 800 / 8050 / 8100
Support: 7950 / 7900 / 7850
Risk Disclaimer
The trade ideas beyond this page are for informational purposes only and do not constitute investment advice or a solicitation to trade. This information is provided by Signal Centre, a third-party unaffiliated with OANDA, and is intended for general circulation only. OANDA does not guarantee the accuracy of this information and assumes no responsibilities for the information provided by the third party. The information does not take into account the specific investment objectives, financial situation, or particular needs of any particular person. You should take into account your specific investment objectives, financial situation, and particular needs before making a commitment to trade, including seeking advice from an independent financial adviser regarding the suitability of the investment, under a separate engagement, as you deem fit.
You accept that you assume all risks in independently viewing the contents and selecting a chosen strategy.
Where the research is distributed in Singapore to a person who is not an Accredited Investor, Expert Investor or an Institutional Investor, Oanda Asia Pacific Pte Ltd (“OAP“) accepts legal responsibility for the contents of the report to such persons only to the extent required by law. Singapore customers should contact OAP at 6579 8289 for matters arising from, or in connection with, the information/research distributed.
