UK100 long is valid ↗️✅Morning traders we start the week with an UK100 trade.
Trade details for current trade are shown on the chart.
Trade has been live since 7:15 UK time and we are using our POW reversal script.
We are working the 15M time frame on this strategy.
We're looking for the green line which is take profit target.
Little blue long arrow is entry point and purple line is stop loss.
Previous trades can also be seen on chart.
Trade history can be seen at the foot of this trade idea too for full transparency.
------------------------------------------
I try and share as many ideas as I can as and when I have time. My trades are automated so I am not sat in front of a screen daily.
Jumping on random trade ideas 'willy-nilly' on Trading View trying to find that one trade that you can retire from is not a sustainable way to trade. You might get lucky, but it will always end one way.
------------------------------------------
Please hit the 👍 LIKE button if you like my ideas🙏
Also follow my profile, then you will receive a notification whenever I post a trading idea - so you don't miss them. 🙌
No one likes missing out, do they?
Also, see my 'related ideas' below to see more just like this.
The stats for this pair are shown below too.
Thank you.
Darren
Ftse100

VUKE Daily - Lightening position here Taking some profits here as we hit resistance. Will looking to start accumulating again if/when we re-test 31. I was overweight the ETF ahead of the divi so happy to go slightly underweight here

UKX Hourly - Time for a cool off Massive push higher this week on FTSE and RSI looking very overstretched on shorter time framed charts. Good place to take profit on long positions or alternative a small short position with a tight stop. Would like to see the 7060 area re-tested
UK100 - Possible re-test of the channel before break.Hello everyone,
I hope you are all doing amazing!
We are currently sitting at the resistance of the channel we have formed on the Daily.
There are 2 support levels to look for on the chart, where if Short position is taken, may be used for TP.
Wish you all good luck!

uk100longSimilar structure with the chart I posted two weeks ago on uk100 (FTSE). Really good trade, more pips expected than the previous trade. Lets goooooo

FTSE100 LongClear signs that the short term trend of the FTSE100 is starting to reverse. Long opportunity on the smaller time frame.

UK100 long is valid Trade details for current trade are shown on the chart.
We are working the 15M time frame on this strategy.
We're looking for the green line which is take profit target.
Little blue long arrow is entry point and purple line is stop loss.
Trade history can be seen at the foot of this trade idea too for full transparency.
Previous two trades can also be seen on chart.
------------------------------------------
I try and share as many ideas as I can as and when I have time. My trades are automated so I am not sat in front of a screen daily.
Jumping on random trade ideas 'willy-nilly' on Trading View trying to find that one trade that you can retire from is not a sustainable way to trade. You might get lucky, but it will always end one way.
------------------------------------------
Please hit the 👍 LIKE button if you like my ideas🙏
Also follow my profile, then you will receive a notification whenever I post a trading idea - so you don't miss them. 🙌
No one likes missing out, do they?
Also, see my 'related ideas' below to see more just like this.
The stats for this pair are shown below too.
Thank you.
Darren

UK100 index possible up-trend continuationPrice has been corrected by 3 waves of A B C. And the structure is still valid within it's validation zone

UK100 long opportunity 😊As promised my alarm was set for this one.
Can it go three out of three for the week?
Trade details for current trade are shown on the chart.
We are working the 15M time frame on this strategy.
We're looking for the green line which is take profit target.
Little blue long arrow is entry point and purple line is stop loss.
Trade history can be seen at the foot of this trade idea too for full transparency.
------------------------------------------
I try and share as many ideas as I can as and when I have time. My trades are automated so I am not sat in front of a screen daily.
Jumping on random trade ideas 'willy-nilly' on Trading View trying to find that one trade that you can retire from is not a sustainable way to trade. You might get lucky, but it will always end one way.
------------------------------------------
Please hit the 👍 LIKE button if you like my ideas🙏
Also follow my profile, then you will receive a notification whenever I post a trading idea - so you don't miss them. 🙌
No one likes missing out, do they?
Also, see my 'related ideas' below to see more just like this.
The stats for this pair are shown below too.
Thank you.
Darren

Who trades indices 🙋♂️ UK100 looking for two out two. Trade details for current trade are shown on the chart.
We are working the 15M time frame on this strategy.
We're looking for the green line which is take profit target.
Little blue long arrow is entry point and purple line is stop loss.
Trade history can be seen at the foot of this trade idea too for full transparency.
Second trade of the day for this strategy and looking to go two out of two.
My alarm is set for the next trade and if around i'll share it for all you index traders out there.
------------------------------------------
I try and share as many ideas as I can as and when I have time. My trades are automated so I am not sat in front of a screen daily.
Jumping on random trade ideas 'willy-nilly' on Trading View trying to find that one trade that you can retire from is not a sustainable way to trade. You might get lucky, but it will always end one way.
------------------------------------------
Please hit the 👍 LIKE button if you like my ideas🙏
Also follow my profile, then you will receive a notification whenever I post a trading idea - so you don't miss them. 🙌
No one likes missing out, do they?
Also, see my 'related ideas' below to see more just like this.
The stats for this pair are shown below too.
Thank you.
Darren

FTSE 100 1-day classic patternsWhat has the highest probability of occurring?
Since early May 2021 price has rotated from 7200 resistance to 6800 support and back again on 2 occasions.
There are two classic patterns forming within these rotations.
The broadening top is currently valid with 3 tests of the upper trendline. The recent rejection at 7200 appears to be what Bulkowski describes as a partial decline having tested the 50% fib retracement.
This projects a target of 7700.
There is also a triple top that would need to test 6800 support again to become valid.
Further a breakout from the triple top projects a target of 6350, the low of the year. This would fulfil the tape chatter of "a healthy 10% correction".
N.B. these patterns are forming over a 4-month period. It is probable that the eventual outcome will be a powerful move.
Objectively the triple top is not confirmed until a test of 6800 has occurred. So the bias is long in the framework of the broadening top. Given the partial decline it is probable that market participants are already getting long. The long trade is invalidated once price touches the lower trend, validating the triple top. Using 6800 as a stop loss from current levels yields 2R to 7700. If this is too large a stop classic patterns on a lower timeframe should be employed to fine tune stop placement.

FTSE 100 ExpirationQ: What has the highest probability of occurring?
There is a lot of volume being traded but the market is moving sideways. The expiration date on the 3rd Friday of the 3rd quarter is approaching. Traders are rolling forward their contracts from September to December.
It makes for quite difficult trading of classic patterns. A rise in false breakouts.
Consider where the future price is relative to the spot price of the instrument being traded.
Is it higher or lower? Since futures contracts expire at the spot price that mean the futures price is more likely to move down or up to the spot price.
Since algo's trade the arbitrage here there is not a great spread between the two prices although it would make sense to trade in the direction of the spot price.
As expiration nears the distribution in the spread is more likely to be normal. This suggests the market is more inclined to mean revert. Think Bollinger Bands and rotations between the standard deviations.
Its not clear cut, there are losers and winners B for Buy and S for Sell. Higher timeframe Bollinger Bands also play a role in where price stops.
The logic behind this is that traders need prices to stabilise so they can execute like for like between the expiring contract and future contract.

VUKE Daily - Tomorrow LDT for juicy 46p diviTomorrow is the LDT for a 46p divi = 1.46% simple divi yield off current price. Also appears as though the ETF has formed a triple top - but as the saying goes "no such thing as a triple top". I am hoping we power through to resistance around 33. I had been averaging into my ISAs and SIPPs the for past few days in anticipation of the dividend and next leg higher.

Sell GBPUSD at marketHello Traders,
We approach a significant level also having a divergence with the FTSE100 and the GB US yield spread.
Level labelled.
Have a great week!
Vitez

ftse forecast fundamentals lookin sweet, stable yeild on the uk 10yr, waiting for bank rate decision on 23rd sep. comment your thoughts

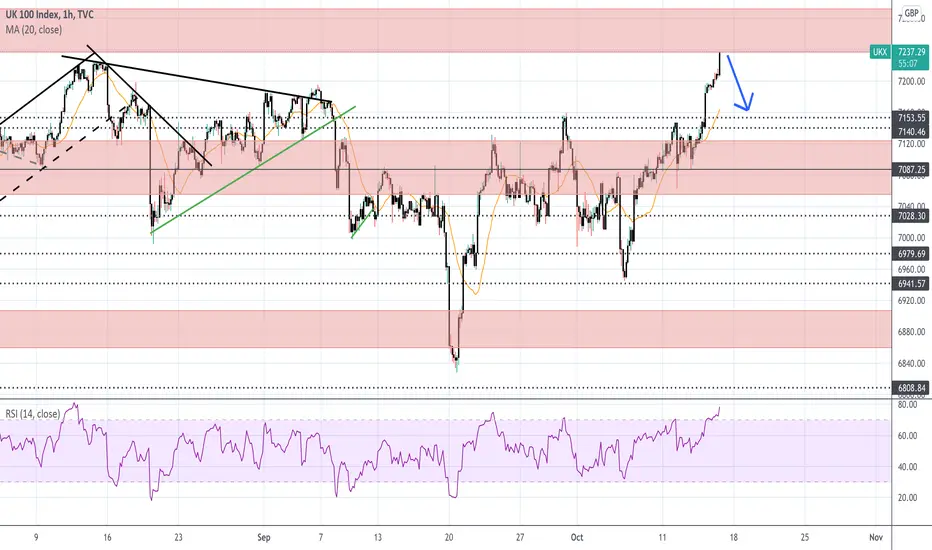
UKX Hourly - Testing resistance watching closely for a potential break higher. Currently testing downward sloping resistance. A break and hold above 7185 targets 7235

Put the FTSE100 on the radarThe FTSE is looking primed for a potential breakout. We have a flat sided ascending triangle which tends to resolve to the upside. The 7200 resistance will be tough to overcome as it was strong former support back throughout 2019. Recently price has been rangebound between 7k and 7.2k, seeking a new catalyst for a sustained move. The RSI has plenty of room to run before overbought fears could become an issue. Targets wise on the upside, a break through 7200 could bring 7500 into play. While on the downside, 7k would be first on the list with further moves lower potentially opening up 6.8k.


UKX Hourly - Push higher likely to stallI would be surprised if this bounce continues much higher before a pullback/some consolidation. We are hitting double resistance - Lateral and downward sloping. There is also some hidden bearish RSI divergence. Ideally would like to see 7070 tested and then will re-assess

UKX Hourly - Remains bearish below 7190We've had a bounce off oversold levels this morning but my bearish thesis remains whilst we are below 7190. Next downside target is 7060.

FTSE 2017 fractal points to a 7500 topThis is a fractal analysis on FTSE from 2017. Not much description is needed here, the chart is quite straightforward. The 2020-2021 (Fractal B) price action so far is similar to the 2016-2017 (Fractal A) sequence. They both started after the market bottomed out on a 1W Death Cross and have been rising with only medium-term pull-backs when the price hit a Higher Highs (dashed) trend-line. In 2017 the index made the next Higher High within the 1.618 - 1.786 Fibonacci extension and topped on the 2.0 Fib mark. If the pattern continues to repeat itself, then FTSE may make a Higher High within 7330-7430, pullback and go for a market top at 7550.
Do you find this comparison reliable?
Most recent FTSE idea:
** Please support this idea with your likes and comments, it is the best way to keep it relevant and support me. **
--------------------------------------------------------------------------------------------------------
!! Donations via TradingView coins also help me a great deal at posting more free trading content and signals here !!
🎉 👍 Shout-out to TradingShot's 💰 top TradingView Coin donor 💰 this week ==> nevada999
--------------------------------------------------------------------------------------------------------

UKX Hourly - Bearish engulfing The Hourly bearish engulfing candle confirms my short thesis as well as puts a line in the sand as a stop loss (7225). It has been a frustrating ride so far so hoping we can pick up some momentum to the downside

Elliott Wave View: FTSE Nesting Higher As ImpulseShort-term Elliott wave view in FTSE suggests that the pullback to 19 July 2021 low (6812.84) ended wave (4). Up from there, the index is nesting higher as an impulse sequence within wave (5) favoring more upside extension to take place. While the initial bounce to 6929.89 high ended wave ((i)), wave ((ii)) pullback ended at 6827.26 low, wave ((iii)) completed in lesser degree 5 waves at 7018.95 high. Wave ((iv)) ended at 6956.24 low, wave ((v)) ended at 7033.27 high thus completed wave 1.
Down from there, the index made a pullback in wave 2 to correct the cycle from 7/19/2021 low. The internals of that pullback unfolded as Elliott wave flat structure where wave ((a)) ended at 6980.67 low. Wave ((b)) ended at 7038.65 high and wave ((c)) ended at 6929.64 low. Above from there, the index started the next leg higher in wave 3 and ended lesser degree wave ((i)) at 7093.93 high. Then wave ((ii)) pullback ended at 6996.93 low and resume the rally higher again.
Whereas lesser degree wave (i) ended at 7142.54 low, wave (ii) ended at 7089.74 low. Near-term, as far as dips remain above 7089.74 low and more importantly above 6812.84 low then FTSE is expected to extend higher in lesser degree wave (iii) towards 7236.10- 7326.35 area higher before entering into a wave (iv) pullback. We don’t recommend selling and expect dips to find support in 3, 7, or 11 swings for further upside.
