$UKX Hourly Potential bullish C&H/bull flag -waiting on sidelineThe potential RHS of a larger H&S pattern we identified earlier this week is potentially changing into a bullish C&H pattern or a bull flag. The indecision between two conflicting patterns makes me feel uncomfortable so I will wait for further developments before getting involved. Last couple of days have been low vol days which usually precede larger moves. Maintaining capital is key
Ftse100

FTSE trade outlookAfter Monday's retracement indices have been ranging with no real momentum.
Resistance of the range is 61.8% and good support zone (green) with 50SMA and 200SMA.
Break of either and close opens new target levels.
Please support the idea and share your thoughts on FTSE!
Good Luck and Stay Healthy!

$UKX Hourly - RSI divergence forming, start of LHS?Been patiently waiting for the LHS to form. Can pre-empt based on RSI divergence with a tight stop just above 6300, or wait for confirmation by break of NL. I am keeping an eye on the 20SMA - not ideal that it is pointing upward.

FTSE 100 doesn't appear to getting a v-shape recovery Over the last few days the FTSE has been ranging between 6,500-6,000.
Monument (RSI) looks mild, and the 9 day average is right in the middle of the candle.
The FTSE has jumped is above the bearish support which is a good sign, but it's too early to know if it's a fakeout or a breakout.
This market is going to need some good news to break above the 6,500 range, maybe that will be provided by the Bank of England tomorrow, or the politicians by announcing some new job scheme.
What is clear in the charts is that the UK is not currently pricing in a V shape recovery, prices are way off their all time highs with price consolidating.
BP, BA, Land Rover and many other UK firms have announced huge job cuts, the current about of job variances are at record lows, all bad long-term signs for the UK economy and the FTSE100.
The markets need stimulus from central banks and politicians, maybe they will get that later this week, otherwise there could be more pain to come in the coming weeks.
If you enjoy my macro outlook on the FTSE, and have any comments, below leave them below, and give me a follow as I focus on other market such as gold, bitcoin, oil and the S&P.
FTSE - Cautiously Bearish Bullish signals for Q2 and in each of the previous 3 weeks had been confirmed, but a near 1,750 Pt improvement since March’s 9 year low had left daily signals for sentiment overstretched and testing the 62% recovery to the entire 2020 sell-off, keeping last week’s signals just very cautiously bullish. An initial over 50 Pt improvement has in fact attracted profit selling, sentiment deteriorating by over 500 Pts from the top. The sell-off is probably corrective and temporary but in the absence of a buy signal the outlook for this week is bearish and the call is to sell on the open and then at 6204, Thursday’s Marabuzo Line with a stop loss at 6388.0, Wednesday’s top. Targets are to 5993, Friday’s Low, 5888.0, the 22nd May base and 5645.0, May’s low trade.

UY100 FTSE100 - Wave AnalysisLet's do some Wave counting on the UK100 the FTSE100
4 weeks ago, I did an analysis but it did not do that.
Now once again its showing signs of another Wave 5 down.
This is confusing me though.
Now I'm thinking all the worlds buying stocks so will they sell the UK 100 companies? lets find out
I will also use the 10 Seconds to Elliott Wave Concept to Count The 5 Waves inside what could be a Wave 1 down.

$UKX Hourly - lovely bounce off support, waiting for reversalLovely bounce off lateral support as expected...now we wait patiently for signs of a reversal
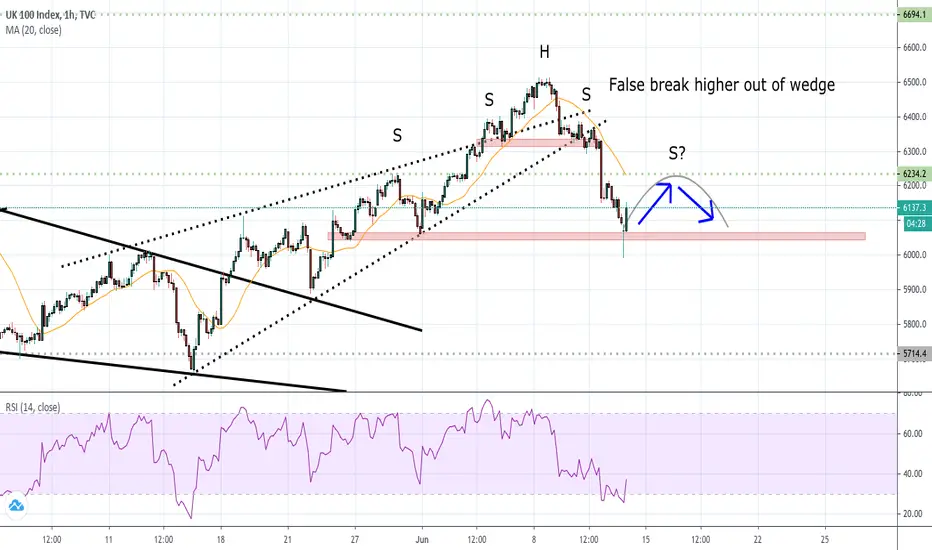
$UKX Hourly Building up for another larger H&S?False break higher in wedge confirmed = bearish. Potentially better short entries points coming up

ISFA reached target range and turned down as forecasted. ISFA reached the target in our post of June 1 and turned down, as forecasted. We should see prices trend down to new lows in Intermediate wave 3. If price crosses up 7,265 this analysis should be reviewed. FOLLOW SKYLINEPRO TO GET UPDATES.

ISFA (FTSE100 ETF) - ISFA is tracing the final stages of intermediate wave 2. Most probable targets are 7,096 and 7,541. After this the ETF should trend to new lows in intermediate wave 3 down. f prices crosses down 6,315, the odds are that wave 3 already began. FOLLOW SKYLINEPRO TO GET UPDATES.

FTSE100 SELLSimilar to other indexes, we have seen a slowdown in upwards momentum. the FTSE100 (UK100) has closed outside of the ascending channel, meaning it is very likely that price is going to drop hard.

FTSE100| BUY TRADE📈| INVERSE H&S!| INTRADAY🌟Hypothetical scenario:
(1) Entry @ 6325.0 (Buy LMT )
(2) Stop Loss @ 6290.0 | 35 points
(3) Target @ 6419.0 | 94 points
(4) R:R = 1:2.69
Stay tuned for the updates.
Follow and leave a like if you liked this idea and want to see more!
*DISCLAIMER*
This post is solely for educational purposes and does not constitute any form of investment / trading advice.

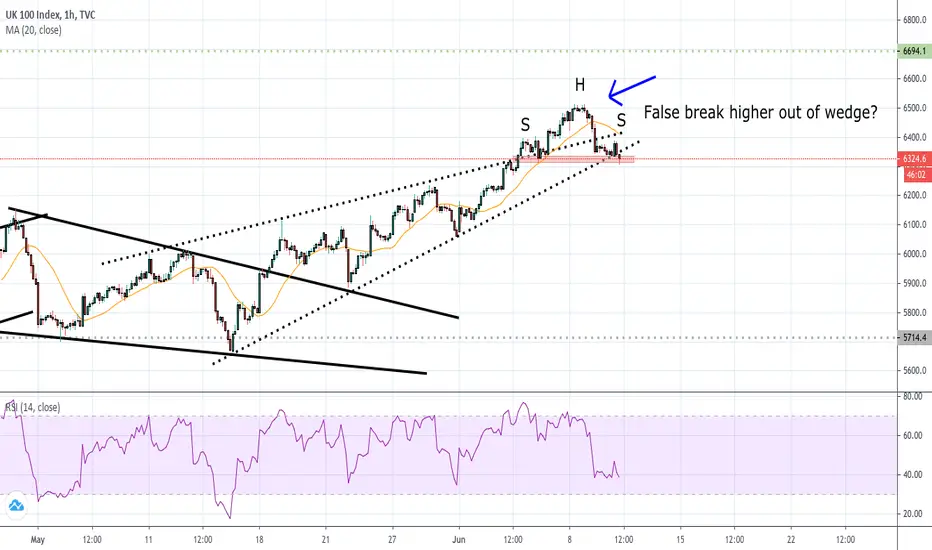
$UKX Hourly - H&S forming, wait for confirmation H&S forming, wait for confirmation. Could be a false break higher out of wedge = would be very bearish for the index
FTSE LongTrade I'm currently in.
Bias taken from HFT.
Entered on 1hr tf following pin bar at retracement.

FTSE outlookPrice testing a trend line here. A break higher opens more target levels.
Of the uptrend line break, we can see lower levels before buying the dip.
Please support the idea and share your thoughts on FTSE!
Good Luck and Stay Healthy!

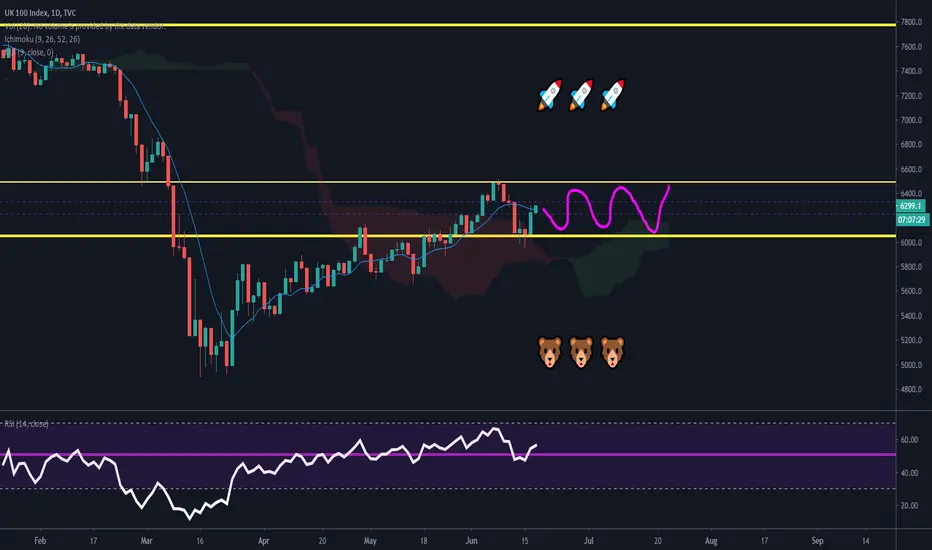
🥊Not even Winston Churchill can save the FTSE from free-fall🐻The FTSE 100 chart on the monthly looks pretty bad.
We can see bearish divergence since 2007, with the market rally going off very little momentum, it briefly touched the oversold area once in 12+ years, which shows a lack of strong buying, and a bubble in the market.
The first 2 arrows show the FTSE toying with the idea of breaking the Ichimoku Cloud (a versatile indicator that defines support and resistance), with the financial arrow showing that we dropped right through it.
The bubble has now popped, the question is can we re-inflate it?
What's happening in the UK right now on the macro front
- Lockdown fully ends around July 4th
- Locals scared to leave the house
- 6 month mortgage holidays and credit card debt
- Furlough scheme is the only thing keeping people off the streets from rioting
- Businesses that were unprofitable being bailed out
- Brexit
- Peaceful protests
UK is a nation built on debt, nobody has savings (well very few).
This can be seen with 6 month mortgage holidays, the UK government paying people to stay at home and not work, badly run businesses getting bailed out.
Even the airlines cannot lose a month without going under.
With fear and lack of growth, where is the UK going to get power to recover from its all-time highs?
When the furlough ends, many on it will lose their jobs. And when the mortgage holidays end and people have no money to pay for it, what will happen next? I see lots of down-side.
There are a lot of bear cases for the FTSE 100, and very few positives.
The UK will need a sharp rebound, V-shaped for the FTSE to keep moving upwards. For now, the rally is based on hope and government stimulus, which is moving us up, will it continue?.
If you like my macro view on markets, check out my other charts as I often give macro updates on major markets like Gold, S&P, oil etc.

$UKX Hourly - Top of wedge & RSI >70Been a good run... and run a bit hard. Time for a pull back I think

FTSE 100 Still well below 200 DMA (S&P 500 is above)UK benchmark share index underperforming top 500 US blue chips in recovery rally
S&P 500 eventually 'catching down' seems more likely than FTSE 100 catching up!

NAS100 / Projection on OpenGreetings TradingView!
How is everyone doing?
Analysis:
It looks like NAS is forming a very classic NAS letter the big M
After the M is formed, we are more than likely to see NAS begin the climb to 9200 finally.
However, this is providing it does form this damn letter and there are no more surprises like detergent drinking. But with the surprises last week and the amount of bad press poor Trump received over the weekend we are more than likely to see NAS drop on open.
Hoping to secure 3100 pips in this position. But this is my outlook.

#UK100 #FTSE100 Is Falling From Our ZoneTraders, FTSE100 (UK100) index is also falling from our zone. We need to wait for a cross of this zone and retest to enter short.
____________________________________________________
Traders! if you like my ideas and do take the same trade, please write it in comment so we can manage the trade together.
Disclaimer:
The content on this analysis is subject to change at any time without notice, and is provided for the sole purpose of education only. Not a financial advice or signal. Please make your own independent investment decisions.
____________________________________________________

#UK100 #FTSE100 Weekly Analysis - More Downside Or SidewaysTraders, UK100 (FTSE100) gave us very good opportunity to short. It was easy to spot and trade and very predictable. Using our fibonacci confluence based analysis we were able to spot the zone and trade it profitably. Now we can expect more sideways movement. But there is a case for short entries too.
_________________________________________________________________________________________________________________________________________
Traders! if you like my ideas and do take the same trade, please write it in comment so we can manage the trade together.
Disclaimer:
The content on this analysis is subject to change at any time without notice, and is provided for the sole purpose of education only. Not a financial advice or signal. Please make your own independent investment decisions.
_________________________________________________________________________________________________________________________________________

#UK100 #FTSE Has Reached Its Profit Target As ExpectedTraders, FTSE 100 (UK100) Has Reached Its Profit Target As Expected. This was highly accurate, easy and quick trade with 149 points taking only 2 days. That is the accuracy and power of Fibonacci confluence pattern trading. They are predictable, pre-plannable and profitable.
If you found this useful hit the like button, subscribe to my channel and share this with other traders. Comment on the post to let me know what you think of them.
Have a great trading week!
P.S. (This is for education only. Not a financial advice or signal.)

S&P 500: Sellers may defend current levelsHere's a comparison between the S&P500 and the FTSE 100, although most other major indices could also be used (DAX, CAC, etc.)
The FTSE is having difficulties to reach fresh marginal highs, which may provide some hints for today's S&P 500 open.
S&P reached the 61.8% Fib level on the daily, which aligns with a strong resistance level (possible triple top). The recently-broken bearish wedge may also provide some resistance for further upside movements.
The real question we need to ask is are stocks currently overvalued? The US lost a record 20+ million jobs in March, with many SME firms facing bankruptcy. GDP contraction may also be significant and up to 30%, according to Fed's Powell. Bulls need to be cautious during these times.
Like our analysis? Please hit the "LIKE" button, comment and share. Thanks!
