FTSE INTRADAY bearish oversold bounce backThe FTSE 100 index is currently exhibiting a bearish sentiment, as evidenced by the prevailing downtrend. The primary focus remains on the key resistance level at 8638, which corresponds to the current intraday swing high and the falling resistance trendline. This level is critical as it determines the next directional move of the index.
From the current levels, an oversold rally could potentially emerge, leading to a retest of the 8638 resistance. A bearish rejection from this level would reinforce the downtrend, paving the way for a move towards the 8520 support. Further downside momentum could extend losses to the next support levels at 8476 and 8327 over a longer timeframe.
On the other hand, a confirmed breakout above 8638 on a daily closing basis would invalidate the bearish outlook. In such a scenario, the index is likely to experience renewed buying interest, targeting the next resistance at 8693, followed by a potential rally towards the 8760 level.
Conclusion:
The overall sentiment for the FTSE 100 remains bearish unless a decisive breakout above the 8638 resistance occurs. Traders should monitor price action around this critical level for confirmation of either a continuation of the downtrend or a potential bullish reversal.
This communication is for informational purposes only and should not be viewed as any form of recommendation as to a particular course of action or as investment advice. It is not intended as an offer or solicitation for the purchase or sale of any financial instrument or as an official confirmation of any transaction. Opinions, estimates and assumptions expressed herein are made as of the date of this communication and are subject to change without notice. This communication has been prepared based upon information, including market prices, data and other information, believed to be reliable; however, Trade Nation does not warrant its completeness or accuracy. All market prices and market data contained in or attached to this communication are indicative and subject to change without notice.
Ftse100

FTSE100 INTRADAY , previous support - new resistance at 8760The FTSE equity index currently shows a bearish sentiment, driven by the breakdown of the long-term prevailing uptrend. The recent oversold bounceback is attempting to retest major resistance at 8760, which marks the intraday swing high and aligns with the falling resistance trendline.
Key Support and Resistance Levels
Resistance Level 1: 8760 (intraday swing high and falling trendline resistance)
Resistance Level 2: 8837
Resistance Level 3: 8900
Support Level 1: 8565
Support Level 2: 8476
Support Level 3: 8327
Bearish Scenario
If the oversold rally is met with a bearish rejection at the 8760 resistance level, it would reaffirm the bearish outlook. This could trigger a decline targeting the 8565 support level, followed by further downside movement toward 8476 and 8327 over the longer timeframe.
Bullish Scenario
Alternatively, a confirmed breakout above 8760 resistance and a daily close above this level would invalidate the bearish bias. This scenario could set the stage for further rallies, with potential upside targets at 8837 and ultimately 8900.
Conclusion
The FTSE index exhibits a bearish continuation setup, with the 8760 resistance level being crucial. A rejection at this level could prompt a renewed move lower, while a breakout would signal bullish momentum and open the way for further gains. Traders should watch for decisive price action around 8760 to determine the next directional bias.
This communication is for informational purposes only and should not be viewed as any form of recommendation as to a particular course of action or as investment advice. It is not intended as an offer or solicitation for the purchase or sale of any financial instrument or as an official confirmation of any transaction. Opinions, estimates and assumptions expressed herein are made as of the date of this communication and are subject to change without notice. This communication has been prepared based upon information, including market prices, data and other information, believed to be reliable; however, Trade Nation does not warrant its completeness or accuracy. All market prices and market data contained in or attached to this communication are indicative and subject to change without notice.

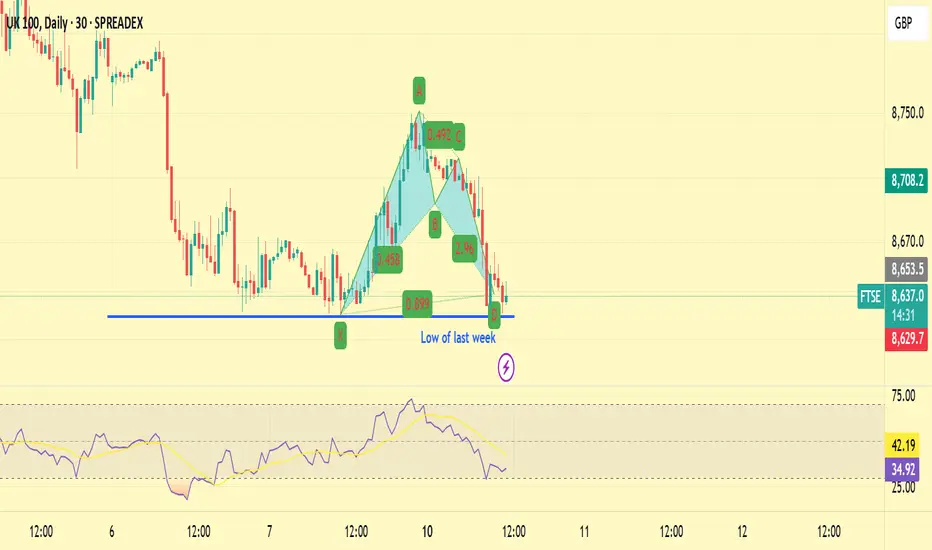
A BUY of FTSE at last week's lowHere is why we are buying this pair at 8635.
1) It is well supported by last week's low
2) There was a big pattern last week to buy at the same area. This level is being retested.
3) There is a small pattern to buy right now (Although not clear on this platform)
4) M15 divergence in place.
Stops is about 40 pips.
FTSE100 (UK100) The Week Ahead 10th March '25Sentiment: Neutral, Price action is consolidating in a tight trading range.
Resistance: Key Resistance is at 8760, followed by 8910 and 9000.
Support: Key support is at 8620 followed by 8536 and 9000.
This communication is for informational purposes only and should not be viewed as any form of recommendation as to a particular course of action or as investment advice. It is not intended as an offer or solicitation for the purchase or sale of any financial instrument or as an official confirmation of any transaction. Opinions, estimates and assumptions expressed herein are made as of the date of this communication and are subject to change without notice. This communication has been prepared based upon information, including market prices, data and other information, believed to be reliable; however, Trade Nation does not warrant its completeness or accuracy. All market prices and market data contained in or attached to this communication are indicative and subject to change without notice.

FTSE 100 setting itself for a 600 point Crash?As I did an analysis on downside to potentially come for the S&P500 yesterday, looks like the FTSE is following suit.
If they don't sort out these issues, we could see a 600 points crash for the FTSE...
Here are some reasons...
New U.S. Tariffs:
President Trump imposed a 25% tariff on imports from Mexico and Canada, and increased tariffs on Chinese goods to 20%, sparking fears of a global trade war.
Oil Price Drop:
OPEC+ announced plans to boost oil output in April, leading to a 3% decline in the oil and gas sector.
Weak UK Construction Data:
The UK construction sector faced its most significant downturn since 2020, with the PMI dropping to 44.6 in February, indicating contraction.
Corporate Disappointments: Companies are reporting worse than expected results which is resulting in a lack of confidence in investors.
Melrose – Weak revenue forecast
WPP – Revenue decline, flat 2025 outlook
Quilter – £76m compensation hit, loss reported
Glencore – Lowest profits in 4 years
Shell – Weaker-than-expected annual profits
JD Sports – Multiple profit warnings, stock drop
And the technicals speak for themselves.
We see an M Formation, with the price reaching the neckline. If it breaks below, we could first see the price head to 200MA along with a further crash to 7,992.
We are seeing a pattern with these indices and either this will play out or something drastic will shock the world and will go back to all time highs.
Right now, it's not looking good.

FTSE 100 INTRADAY trend reversal below 8760 levelKey Trading Levels:
Resistance: 8760, 8850, 8910, 8990
Support: 8616, 8536, 8460
Market Sentiment:
Bearish intraday bias following a corrective pullback from overbought conditions.
Bearish Scenario:
The FTSE 100 has broken below the rising trendline and the previous consolidation range, establishing 8760 as a key resistance level.
An oversold bounce from current levels could face rejection at 8760, reinforcing bearish momentum.
A failure to reclaim 8760 may accelerate selling pressure, targeting downside support at 8616, followed by 8536 and 8460.
Bullish Scenario:
A sustained breakout above 8760 with a daily close higher would negate the bearish outlook.
A bullish continuation could drive the index toward 8850, with further upside targets at 8910 and 8990.
Conclusion:
Intraday sentiment remains bearish unless FTSE 100 reclaims 8760. A rejection at this level could intensify selling pressure toward lower support levels. Conversely, a breakout above 8760 and a strong close would indicate a resumption of the broader uptrend, targeting higher resistance zones.
This communication is for informational purposes only and should not be viewed as any form of recommendation as to a particular course of action or as investment advice. It is not intended as an offer or solicitation for the purchase or sale of any financial instrument or as an official confirmation of any transaction. Opinions, estimates and assumptions expressed herein are made as of the date of this communication and are subject to change without notice. This communication has been prepared based upon information, including market prices, data and other information, believed to be reliable; however, Trade Nation does not warrant its completeness or accuracy. All market prices and market data contained in or attached to this communication are indicative and subject to change without notice.

UK100 (FTSE)-Weekly forecast, Technical Analysis & Trading IdeasMidterm forecast:
8380.25 is a major support, while this level is not broken, the Midterm wave will be uptrend.
Technical analysis:
A trough is formed in daily chart at 8611.20 on 02/21/2025, so more gains to resistance(s) 8854.99, 9000.00, 9100.00 and more heights is expected.
Take Profits:
8664.21
8765.00
8854.99
9000.00
9100.00
__________________________________________________________________
❤️ If you find this helpful and want more FREE forecasts in TradingView,
. . . . . . . . Hit the 'BOOST' button 👍
. . . . . . . . . . . Drop some feedback in the comments below! (e.g., What did you find most useful? How can we improve?)
🙏 Your support is appreciated!
Now, it's your turn!
Be sure to leave a comment; let us know how you see this opportunity and forecast.
Have a successful week,
ForecastCity Support Team

FTSE100 H4 | Approaching pullback supportFTSE100 (UK100) is falling towards a pullback support and could potentially bounce off this level to climb higher.
Buy entry is at 8,784.89 which is a pullback support that aligns with the 50.0% Fibonacci retracement level.
Stop loss is at 8,658.00 which is a level that lies underneath an overlap support and the 78.6% Fibonacci retracement level.
Take profit is at 8,985.37 which is a level that aligns with the 161.8% Fibonacci extension.
High Risk Investment Warning
Trading Forex/CFDs on margin carries a high level of risk and may not be suitable for all investors. Leverage can work against you.
Stratos Markets Limited (www.fxcm.com):
CFDs are complex instruments and come with a high risk of losing money rapidly due to leverage. 63% of retail investor accounts lose money when trading CFDs with this provider. You should consider whether you understand how CFDs work and whether you can afford to take the high risk of losing your money.
Stratos Europe Ltd (www.fxcm.com):
CFDs are complex instruments and come with a high risk of losing money rapidly due to leverage. 63% of retail investor accounts lose money when trading CFDs with this provider. You should consider whether you understand how CFDs work and whether you can afford to take the high risk of losing your money.
Stratos Trading Pty. Limited (www.fxcm.com):
Trading FX/CFDs carries significant risks. FXCM AU (AFSL 309763), please read the Financial Services Guide, Product Disclosure Statement, Target Market Determination and Terms of Business at www.fxcm.com
Stratos Global LLC (www.fxcm.com):
Losses can exceed deposits.
Please be advised that the information presented on TradingView is provided to FXCM (‘Company’, ‘we’) by a third-party provider (‘TFA Global Pte Ltd’). Please be reminded that you are solely responsible for the trading decisions on your account. There is a very high degree of risk involved in trading. Any information and/or content is intended entirely for research, educational and informational purposes only and does not constitute investment or consultation advice or investment strategy. The information is not tailored to the investment needs of any specific person and therefore does not involve a consideration of any of the investment objectives, financial situation or needs of any viewer that may receive it. Kindly also note that past performance is not a reliable indicator of future results. Actual results may differ materially from those anticipated in forward-looking or past performance statements. We assume no liability as to the accuracy or completeness of any of the information and/or content provided herein and the Company cannot be held responsible for any omission, mistake nor for any loss or damage including without limitation to any loss of profit which may arise from reliance on any information supplied by TFA Global Pte Ltd.
The speaker(s) is neither an employee, agent nor representative of FXCM and is therefore acting independently. The opinions given are their own, constitute general market commentary, and do not constitute the opinion or advice of FXCM or any form of personal or investment advice. FXCM neither endorses nor guarantees offerings of third-party speakers, nor is FXCM responsible for the content, veracity or opinions of third-party speakers, presenters or participants.

FTSE Bullish trend continuationThe FTSE 100 (UK100) index continues to trade within a prevailing long-term uptrend, indicating a bullish bias. However, near-term price action suggests potential volatility around key levels, requiring confirmation of directional momentum.
Bullish Scenario:
The key level to watch is 8708, which represents the bull flag breakout level.
A successful retest and rebound from 8708 could reinforce the bullish outlook, targeting 8910 as the first upside resistance.
Sustained momentum above 8910 could extend gains toward 8950, with 8990 acting as a longer-term resistance level.
Bearish Scenario:
A confirmed breakdown below 8708 on a daily close could signal weakness, leading to a deeper retracement.
In this scenario, the next support levels to watch are 8680, followed by 8630, where buyers may attempt to regain control.
Further downside pressure below 8630 could weaken the broader uptrend structure, increasing the risk of extended corrective moves.
Conclusion:
The FTSE 100 remains within a bullish trend, but short-term movements depend on price action around 8708. A successful retest and rebound would reaffirm the uptrend, while a confirmed breakdown could introduce further corrective downside risks. Traders should monitor price reactions at these key levels to assess momentum shifts.
This communication is for informational purposes only and should not be viewed as any form of recommendation as to a particular course of action or as investment advice. It is not intended as an offer or solicitation for the purchase or sale of any financial instrument or as an official confirmation of any transaction. Opinions, estimates and assumptions expressed herein are made as of the date of this communication and are subject to change without notice. This communication has been prepared based upon information, including market prices, data and other information, believed to be reliable; however, Trade Nation does not warrant its completeness or accuracy. All market prices and market data contained in or attached to this communication are indicative and subject to change without notice.

FTSE retest of ATH, The Week Ahead 03rd March ‘25Market Sentiment:
The FTSE 100 index maintains a bullish outlook, supported by the long-term uptrend. However, price action is at a key technical level, where market participants will look for confirmation of the next move.
Bullish Scenario:
Key Support: 8709 (20-day moving average, previous consolidation zone, and rising trendline).
A pullback to this level, followed by a bullish rebound, would confirm continued strength in the uptrend.
Upside Targets:
8850 (initial resistance)
8900 (next key resistance)
9000 (psychological resistance and long-term target)
A strong bounce from 8709 would reinforce bullish momentum and signal a continuation of the prevailing uptrend.
Bearish Scenario:
A confirmed break below 8709, with a daily close beneath this level, would indicate a potential trend shift or deeper correction.
This could expose the index to further downside risk, targeting:
8650 (next immediate support)
8620, if selling pressure intensifies
A sustained loss of 8709 could weaken bullish sentiment, increasing the likelihood of extended consolidation or correction.
Market Outlook:
The 8709 remains the key pivot level—holding above it supports the bullish case, while a break lower could indicate a shift in momentum. Traders should monitor price action and volume near this level to assess the next directional move in the index.
This communication is for informational purposes only and should not be viewed as any form of recommendation as to a particular course of action or as investment advice. It is not intended as an offer or solicitation for the purchase or sale of any financial instrument or as an official confirmation of any transaction. Opinions, estimates and assumptions expressed herein are made as of the date of this communication and are subject to change without notice. This communication has been prepared based upon information, including market prices, data and other information, believed to be reliable; however, Trade Nation does not warrant its completeness or accuracy. All market prices and market data contained in or attached to this communication are indicative and subject to change without notice.

FTSE INTRADAY Breakout retest at 8675The FTSE (UK100) index price action sentiment appears bullish, supported by the longer-term prevailing uptrend.
The key trading level is at 8675, the “bull flag” breakout level. A corrective pullback from the current levels and a bullish bounce back from the 8675 level could target the upside resistance at 8790 followed by the 8854 and 8920 levels over the longer timeframe.
Alternatively, a confirmed loss of 8674 support and a daily close below that level could trigger a further retracement and a retest of 8608 support level followed by 8564.
This communication is for informational purposes only and should not be viewed as any form of recommendation as to a particular course of action or as investment advice. It is not intended as an offer or solicitation for the purchase or sale of any financial instrument or as an official confirmation of any transaction. Opinions, estimates and assumptions expressed herein are made as of the date of this communication and are subject to change without notice. This communication has been prepared based upon information, including market prices, data and other information, believed to be reliable; however, Trade Nation does not warrant its completeness or accuracy. All market prices and market data contained in or attached to this communication are indicative and subject to change without notice.

FTSE INTRADAY support at 8608The FTSE (UK100) index price action sentiment appears bullish, supported by the longer-term prevailing uptrend.
The key trading level is at 8608, which is the 21st February swing low. A corrective pullback from the current levels and a bullish bounce back from the 8608 level could target the upside resistance at 8740 followed by the 8790 and 8850 levels over the longer timeframe.
Alternatively, a confirmed loss of 8608 support and a daily close below that level could trigger a further retracement and a retest of 8564 support level followed by 8500.
This communication is for informational purposes only and should not be viewed as any form of recommendation as to a particular course of action or as investment advice. It is not intended as an offer or solicitation for the purchase or sale of any financial instrument or as an official confirmation of any transaction. Opinions, estimates and assumptions expressed herein are made as of the date of this communication and are subject to change without notice. This communication has been prepared based upon information, including market prices, data and other information, believed to be reliable; however, Trade Nation does not warrant its completeness or accuracy. All market prices and market data contained in or attached to this communication are indicative and subject to change without notice.

FTSE still uptrending above 8590 levelThe FTSE (UK100) index price action sentiment appears bullish, supported by the longer-term prevailing uptrend.
The key trading level is at 8590, previous consolidation zone and a rising trendline zone. A corrective pullback from the current levels and a bullish bounce back from the 8590 level could target the upside resistance at 8695 followed by the 8740 and 8800 levels over the longer timeframe.
Alternatively, a confirmed loss of 8590 support and a daily close below that level could trigger a further retracement and a retest of 8556 support level followed by 8495.
This communication is for informational purposes only and should not be viewed as any form of recommendation as to a particular course of action or as investment advice. It is not intended as an offer or solicitation for the purchase or sale of any financial instrument or as an official confirmation of any transaction. Opinions, estimates and assumptions expressed herein are made as of the date of this communication and are subject to change without notice. This communication has been prepared based upon information, including market prices, data and other information, believed to be reliable; however, Trade Nation does not warrant its completeness or accuracy. All market prices and market data contained in or attached to this communication are indicative and subject to change without notice.

A quick buy on FTSE right nowWe are seeing the following on the FTSE
1) H4 is oversold
2) There is H1 divergence
3) 2 patterns at the same level
4) Yesterdays low at 8648
5) Daily trend is up
This is likely to be a quick trade as there is huge resistance at 8685. We may turn short if needed.

FTSE100 H4 | Potential bearish reversalFTSE100 (UK100) is rising towards an overlap resistance and could potentially reverse off this level to drop lower.
Sell entry is at 8,686.45 which is an overlap resistance.
Stop loss is at 8,760.00 which is a level that sits above the 61.8% Fibonacci retracement and a pullback resistance.
Take profit is at 8,491.22 which is a swing-low support.
High Risk Investment Warning
Trading Forex/CFDs on margin carries a high level of risk and may not be suitable for all investors. Leverage can work against you.
Stratos Markets Limited (www.fxcm.com):
CFDs are complex instruments and come with a high risk of losing money rapidly due to leverage. 63% of retail investor accounts lose money when trading CFDs with this provider. You should consider whether you understand how CFDs work and whether you can afford to take the high risk of losing your money.
Stratos Europe Ltd (www.fxcm.com):
CFDs are complex instruments and come with a high risk of losing money rapidly due to leverage. 63% of retail investor accounts lose money when trading CFDs with this provider. You should consider whether you understand how CFDs work and whether you can afford to take the high risk of losing your money.
Stratos Trading Pty. Limited (www.fxcm.com):
Trading FX/CFDs carries significant risks. FXCM AU (AFSL 309763), please read the Financial Services Guide, Product Disclosure Statement, Target Market Determination and Terms of Business at www.fxcm.com
Stratos Global LLC (www.fxcm.com):
Losses can exceed deposits.
Please be advised that the information presented on TradingView is provided to FXCM (‘Company’, ‘we’) by a third-party provider (‘TFA Global Pte Ltd’). Please be reminded that you are solely responsible for the trading decisions on your account. There is a very high degree of risk involved in trading. Any information and/or content is intended entirely for research, educational and informational purposes only and does not constitute investment or consultation advice or investment strategy. The information is not tailored to the investment needs of any specific person and therefore does not involve a consideration of any of the investment objectives, financial situation or needs of any viewer that may receive it. Kindly also note that past performance is not a reliable indicator of future results. Actual results may differ materially from those anticipated in forward-looking or past performance statements. We assume no liability as to the accuracy or completeness of any of the information and/or content provided herein and the Company cannot be held responsible for any omission, mistake nor for any loss or damage including without limitation to any loss of profit which may arise from reliance on any information supplied by TFA Global Pte Ltd.
The speaker(s) is neither an employee, agent nor representative of FXCM and is therefore acting independently. The opinions given are their own, constitute general market commentary, and do not constitute the opinion or advice of FXCM or any form of personal or investment advice. FXCM neither endorses nor guarantees offerings of third-party speakers, nor is FXCM responsible for the content, veracity or opinions of third-party speakers, presenters or participants.

FTSE Uptrend supported at 8695 levelThe FTSE (UK100) index price action sentiment appears bullish, supported by the longer-term prevailing uptrend.
The key trading level is at 8695, which is the 31st January swing high. A corrective pullback from the current levels and a bullish bounce back from the 8695 level could target the upside resistance at 8850 followed by the 8895 and 8955 levels over the longer timeframe.
Alternatively, a confirmed loss of 8695 support and a daily close below that level could trigger a further retracement and a retest of 8648 support level followed by 8590.
This communication is for informational purposes only and should not be viewed as any form of recommendation as to a particular course of action or as investment advice. It is not intended as an offer or solicitation for the purchase or sale of any financial instrument or as an official confirmation of any transaction. Opinions, estimates and assumptions expressed herein are made as of the date of this communication and are subject to change without notice. This communication has been prepared based upon information, including market prices, data and other information, believed to be reliable; however, Trade Nation does not warrant its completeness or accuracy. All market prices and market data contained in or attached to this communication are indicative and subject to change without notice.

UK100 (FTSE)-Weekly forecast, Technical Analysis & Trading IdeasMidterm forecast:
8380.25 is a major support, while this level is not broken, the Midterm wave will be uptrend.
Technical analysis:
A trough is formed in daily chart at 8006.10 on 12/20/2024, so more gains to resistance(s) 8833.83, 9000.00, 9100.00 and more heights is expected.
Take Profits:
8664.21
8765.00
8833.83
9000.00
9100.00
__________________________________________________________________
❤️ If you find this helpful and want more FREE forecasts in TradingView,
. . . . . . . . Hit the 'BOOST' button 👍
. . . . . . . . . . . Drop some feedback in the comments below! (e.g., What did you find most useful? How can we improve?)
🙏 Your support is appreciated!
Now, it's your turn!
Be sure to leave a comment; let us know how you see this opportunity and forecast.
Have a successful week,
ForecastCity Support Team

FTSE Bullish Breakout above falling wedgeThe FTSE (UK100) index price action sentiment appears bullish, supported by the longer-term prevailing uptrend.
The key trading level is at 8695. swing low. A corrective pullback from the current levels and a bullish bounce back from the 8695 level could target the upside resistance at 8800 followed by the 8830 and 8916 levels over the longer timeframe.
Alternatively, a confirmed loss of 8695 support and a daily close below that level could open a way for further retracement and a retest of 8655 support level followed by 8590 and 8540.
This communication is for informational purposes only and should not be viewed as any form of recommendation as to a particular course of action or as investment advice. It is not intended as an offer or solicitation for the purchase or sale of any financial instrument or as an official confirmation of any transaction. Opinions, estimates and assumptions expressed herein are made as of the date of this communication and are subject to change without notice. This communication has been prepared based upon information, including market prices, data and other information, believed to be reliable; however, Trade Nation does not warrant its completeness or accuracy. All market prices and market data contained in or attached to this communication are indicative and subject to change without notice.

Made in England.. FTSE 100 Triangle BreakoutFinally the long term triangle pattern in blue chip UK stocks has broken - and the weekly chart for the FTSE 100 index is looking very positive.
The breakout weekly candle is a long one with a close right near the highs - showing bulls are well in control of the market.
We can see the triangle break in more granular detail on the daily chart with the break confirmed on Thursday and a strong follow-through move on Friday.
Support is found first at the former all time high (8450-8475) then back at the broken trendline from the triangle pattern.
These support levels define our risk - the price back inside the triangle will inform us the breakout has failed - this time at least.
But if things move as we expect, using the height of the triangle pattern as a price objective from the breakout point, the UK 100 could reach 9,000.
But - as always - that’s just how the team and I are seeing things, what do you think?
Share your ideas with us - OR - send us a request!
Comments welcome :)
cheers!
Jasper
The material provided in this article is for information purposes only and should not be understood as trading or investment advice. Any opinion that may be provided on this page does not constitute a recommendation by Trading Writers and has not been prepared in accordance with the legal requirements designed to promote investment research independence. If you rely on the information on this page, then you do so entirely at your own risk.

UK100 (FTSE)-Weekly forecast, Technical Analysis & Trading IdeasMidterm forecast:
8380.25 is a major support, while this level is not broken, the Midterm wave will be uptrend.
Technical analysis:
The ascending flag taking shape suggests we will soon see another leg higher.
A trough is formed in daily chart at 8006.10 on 12/20/2024, so more gains to resistance(s) 8664.21, 8765.00, 9000.00 and more heights is expected.
Take Profits:
8083.43
8183.03
8242.89
8380.25
8485.05
8664.21
8765.00
9000.00
__________________________________________________________________
❤️ If you find this helpful and want more FREE forecasts in TradingView,
. . . . . . . . Hit the 'BOOST' button 👍
. . . . . . . . . . . Drop some feedback in the comments below! (e.g., What did you find most useful? How can we improve?)
🙏 Your support is appreciated!
Now, it's your turn!
Be sure to leave a comment; let us know how you see this opportunity and forecast.
Have a successful week,
ForecastCity Support Team

FTSE100 H4 | Falling to overlap supportFTSE100 (UK100) is falling towards an overlap support and could potentially bounce off this level to climb higher.
Buy entry is at 8,691.94 which is an overlap support.
Stop loss is at 8,504.00 which is a level that lies underneath a swing-low support and the 38.2% Fibonacci retracement level.
Take profit is at 8,892.06 which is a level that aligns with the 78.6% Fibonacci projection level.
High Risk Investment Warning
Trading Forex/CFDs on margin carries a high level of risk and may not be suitable for all investors. Leverage can work against you.
Stratos Markets Limited (www.fxcm.com):
CFDs are complex instruments and come with a high risk of losing money rapidly due to leverage. 63% of retail investor accounts lose money when trading CFDs with this provider. You should consider whether you understand how CFDs work and whether you can afford to take the high risk of losing your money.
Stratos Europe Ltd (www.fxcm.com):
CFDs are complex instruments and come with a high risk of losing money rapidly due to leverage. 63% of retail investor accounts lose money when trading CFDs with this provider. You should consider whether you understand how CFDs work and whether you can afford to take the high risk of losing your money.
Stratos Trading Pty. Limited (www.fxcm.com):
Trading FX/CFDs carries significant risks. FXCM AU (AFSL 309763), please read the Financial Services Guide, Product Disclosure Statement, Target Market Determination and Terms of Business at www.fxcm.com
Stratos Global LLC (www.fxcm.com):
Losses can exceed deposits.
Please be advised that the information presented on TradingView is provided to FXCM (‘Company’, ‘we’) by a third-party provider (‘TFA Global Pte Ltd’). Please be reminded that you are solely responsible for the trading decisions on your account. There is a very high degree of risk involved in trading. Any information and/or content is intended entirely for research, educational and informational purposes only and does not constitute investment or consultation advice or investment strategy. The information is not tailored to the investment needs of any specific person and therefore does not involve a consideration of any of the investment objectives, financial situation or needs of any viewer that may receive it. Kindly also note that past performance is not a reliable indicator of future results. Actual results may differ materially from those anticipated in forward-looking or past performance statements. We assume no liability as to the accuracy or completeness of any of the information and/or content provided herein and the Company cannot be held responsible for any omission, mistake nor for any loss or damage including without limitation to any loss of profit which may arise from reliance on any information supplied by TFA Global Pte Ltd.
The speaker(s) is neither an employee, agent nor representative of FXCM and is therefore acting independently. The opinions given are their own, constitute general market commentary, and do not constitute the opinion or advice of FXCM or any form of personal or investment advice. FXCM neither endorses nor guarantees offerings of third-party speakers, nor is FXCM responsible for the content, veracity or opinions of third-party speakers, presenters or participants.

FTSE pullback after UK economic activity surprises to the upsideThe FTSE (UK100) index price action sentiment appears bullish, supported by the longer-term prevailing uptrend. This morning UK Gross Domestic Product (GDP) rose at a faster pace of 1.4% YoY in the last quarter of 2024, compared to estimates of 1.1% and the 1% growth seen in the third quarter, upwardly revised from 0.9%. Market participants trim BoE expectations for rate cuts after GDP figures are published.
The key trading level is at 8680, which is 25th Feb swing low. A corrective pullback from the current levels and a bullish bounce back from the 8680 level could target the upside resistance at 8800 followed by the 8830 and 8916 levels over the longer timeframe.
Alternatively, a confirmed loss of 8680 support and a daily close below that level could open a way for further retracement and a retest of 8655 support level followed by 8590 and 8540.
This communication is for informational purposes only and should not be viewed as any form of recommendation as to a particular course of action or as investment advice. It is not intended as an offer or solicitation for the purchase or sale of any financial instrument or as an official confirmation of any transaction. Opinions, estimates and assumptions expressed herein are made as of the date of this communication and are subject to change without notice. This communication has been prepared based upon information, including market prices, data and other information, believed to be reliable; however, Trade Nation does not warrant its completeness or accuracy. All market prices and market data contained in or attached to this communication are indicative and subject to change without notice.

FTSE bullish run supported at 8680The FTSE (UK100) index price action sentiment appears bullish, supported by the longer-term prevailing uptrend.
The key trading level is at 8680, which is 25th Feb swing low. A corrective pullback from the current levels and a bullish bounce back from the 8680 level could target the upside resistance at 8800 followed by the 8850 and 8916 levels over the longer timeframe.
Alternatively, a confirmed loss of 8680 support and a daily close below that level could trigger a further retracement and a retest of 8655 support level followed by 8590 and 8540.
This communication is for informational purposes only and should not be viewed as any form of recommendation as to a particular course of action or as investment advice. It is not intended as an offer or solicitation for the purchase or sale of any financial instrument or as an official confirmation of any transaction. Opinions, estimates and assumptions expressed herein are made as of the date of this communication and are subject to change without notice. This communication has been prepared based upon information, including market prices, data and other information, believed to be reliable; however, Trade Nation does not warrant its completeness or accuracy. All market prices and market data contained in or attached to this communication are indicative and subject to change without notice.
