FTSE Elliott Wave Analysis for Monday 02/10/2023 (+ Higher TF)For traders (lower timeframe):
It looks like wave W is finished and we can now see further downside as a wave X.
For investors (higher timeframe):
In the higher timeframe, investors should wait till the higher degree WXY correction is finished.
Ftse100

FTSE Elliott Wave Analysis for Friday 29/09/2023As forecasted we saw more upside in the FTSE. We now reached areas from where we can start to reverse. We are looking for exhaustion signs to end wave A.

WTI, US10Y down. EURUSD, SPX up.dear fellows,
we believe USOIL to fall in the near term. this would allow US10Y to fall, as well. as a consequence, EUR, GBP, JPY would rise against the USD. finally, it would lead these respective stock market indexes up.
best regards.

UK100 H4 | Rising into 38.2% Fibo resistanceUK100 is rising towards an overlap resistance and could potentially reverse off this level to drop lower.
Sell entry is at 7647.16 which is an overlap resistance that aligns with the 38.2% Fibonacci retracement level.
Stop loss is at 7700.00 which is a level that sits above a Fibonacci confluence i.e. the 61.8% retracement and the 100.0% projection levels.
Take profit is between 7564.00 and 7551.55 which is a pullback support that aligns close to the 50.0% Fibonacci retracement level.
High Risk Investment Warning
Trading Forex/CFDs on margin carries a high level of risk and may not be suitable for all investors. Leverage can work against you.
Forex Capital Markets Limited (www.fxcm.com):
CFDs are complex instruments and come with a high risk of losing money rapidly due to leverage. 70% of retail investor accounts lose money when trading CFDs with this provider. You should consider whether you understand how CFDs work and whether you can afford to take the high risk of losing your money.
Stratos Europe Ltd, previously FXCM EU Ltd (www.fxcm.com):
CFDs are complex instruments and come with a high risk of losing money rapidly due to leverage. 74% of retail investor accounts lose money when trading CFDs with this provider. You should consider whether you understand how CFDs work and whether you can afford to take the high risk of losing your money.
FXCM Australia Pty. Limited (www.fxcm.com):
Trading FX/CFDs carries significant risks. FXCM AU (AFSL 309763), please read the Financial Services Guide, Product Disclosure Statement, Target Market Determination and Terms of Business at www.fxcm.com
Stratos Global LLC (www.fxcm.com):
Losses can exceed deposits.
Please be advised that the information presented on TradingView is provided to FXCM (‘Company’, ‘we’) by a third-party provider (‘TFA Global Pte Ltd’). Please be reminded that you are solely responsible for the trading decisions on your account. There is a very high degree of risk involved in trading. Any information and/or content is intended entirely for research, educational and informational purposes only and does not constitute investment or consultation advice or investment strategy. The information is not tailored to the investment needs of any specific person and therefore does not involve a consideration of any of the investment objectives, financial situation or needs of any viewer that may receive it. Kindly also note that past performance is not a reliable indicator of future results. Actual results may differ materially from those anticipated in forward-looking or past performance statements. We assume no liability as to the accuracy or completeness of any of the information and/or content provided herein and the Company cannot be held responsible for any omission, mistake nor for any loss or damage including without limitation to any loss of profit which may arise from reliance on any information supplied by TFA Global Pte Ltd.
The speaker(s) is neither an employee, agent nor representative of FXCM and is therefore acting independently. The opinions given are their own, constitute general market commentary, and do not constitute the opinion or advice of FXCM or any form of personal or investment advice. FXCM neither endorses nor guarantees offerings of third party speakers, nor is FXCM responsible for the content, veracity or opinions of third-party speakers, presenters or participants.

FTSE Elliott Wave Analysis for Thursday 28/09/2023As forecasted we saw more upside in the FTSE. We now reached areas from where we can start to reverse. We are looking for exhaustion signs to end wave A.

FTSE Elliott Wave Analysis for Wednesday 27/09/2023As forecasted we saw more upside in the FTSE. We now reached areas from where we can start to reverse. We are looking for exhaustion signs to end wave A.

UK100: Continuation watchToday's focus: UK100 Index
Pattern – Continuation Pattern
Support – 7629 - 7588
Resistance – 7720, 7916
Thanks for checking out today's update. Today, we have run over UK100, breaking down the overall price picture, levels, and patterns and incorporating moving average and RSI into the analysis.
The primary focus of today's look at the UK100 is the current uptrend, forming a new higher low in today's session. This continues to push the case for a new leg high from buyers. Resistance at 7720 is the first big test, and if we can see a new move up, this level needs to be cleared to break the current range.
If today's fightback from 7629 support fails, we could see a move that may try to retest the range base. We will be watching Price and mainly Buyers over the next several sessions to see if we get a breakout.
Good trading.

FTSE Elliott Wave Analysis for Tuesday 26/09/2023As forecasted we saw more upside in the FTSE. We now reached areas from where we can start to reverse. We are looking for exhaustion signs to end wave A.

FTSE Elliott Wave Analysis for Monday 25/09/2023As forecasted we saw more upside in the FTSE. We now reached areas from where we can start to reverse. We are looking for exhaustion signs to end wave A.

FTSE Elliott Wave Analysis for Thursday 21/09/2023As forecasted we saw more upside in the FTSE. We now reached areas from where we can start to reverse. It looks like the upward ABC correction is mature.

FTSE Elliott Wave Analysis for Wednesday 20/09/2023As forecasted we saw more upside in the FTSE. We now reached areas from where we can start to reverse. We are looking for exhaustion signs to end wave ((y)) and wave W.

FTSE Elliott Wave Analysis for Tuesday 19/09/2023As forecasted we saw more upside in the FTSE. We now reached areas from where we can start to reverse. We are looking for exhaustion signs to end wave ((y)) and wave W.

UK100 FTSE Technical Analysis and Trade IdeaIn this video, we undertake an extensive examination of the US100. In recent time frames, the NASDAQ has experienced significant bullish sentiment, leading to a substantial surge toward a crucial resistance level. Throughout the video, we explore the potential for a trade opportunity involving the FTSE. This analysis is based on a thorough evaluation of price action dynamics, market structure, prevailing trends, and a careful assessment of key support and resistance levels. It is essential to stress that the material presented is purely educational in nature and should not be construed as financial advice or guidance.

FTSE Elliott Wave Analysis for Monday 18/09/2023As forecasted we saw more upside in the FTSE. We now reached areas from where we can start to reverse. We are looking for exhaustion signs to end wave ((y)) and wave W.

FTSE Elliott Wave Analysis for Friday 15/09/2023 (+ Higher TF)For traders (lower timeframe):
As forecasted we saw more upside in the FTSE. We now reached areas from where we can start to reverse. We are looking for exhaustion signs to end wave ((y)) and wave W.
For investors (higher timeframe):
In the higher timeframe, investors should wait till the higher degree WXY correction is finished.

FTSE 100: Crossed over the 2023 Resistance. Key bullish move!FTSE 100 just crossed over the LH trendline that was the major Resistance for this year since February 16th. Technically it was the top of the seven month Descending Triangle that delivered rejections to the S1 Zone.
This breakout also crossed over the 1D MA200 turning the 1D timeframe overbought technically (RSI = 73.837, MACD = 28.900, ADX = 29.659). R1 (7,720) is where the Fibonacci 0.618 level is and is the next Resistance. If it closes a 1D candle over it, we will buy the breakout otherwise will wait for the first technical pullback near the 1D MA50 and buy. Either way, our traget is Fibonacci 0.786 (TP = 7,865).
## If you like our free content follow our profile to get more daily ideas. ##
## Comments and likes are greatly appreciated. ##

FTSE Elliott Wave Analysis for Thursday 14/09/2023We made a new high and this supports the scenario of another corrective leg up as forecasted. This means we can see some more upside to finish wave X, before reversing down as a wave Y.

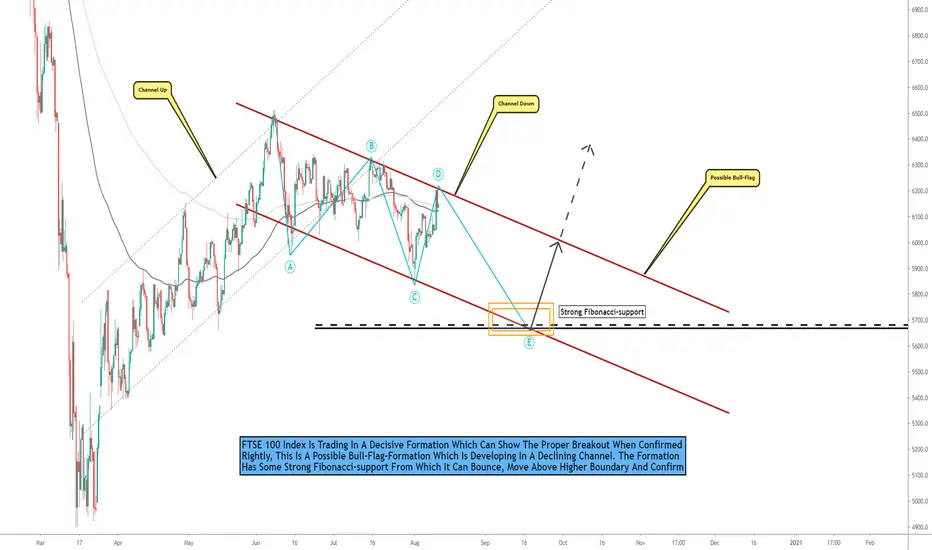
FTSE 100, Consolidating, This Scenario Can Alter The Situation!Hello Traders Investors And Community,
Welcome to this analysis where we are looking at the FTSE 100 Index, what it is currently doing, the overall formation, the possibilities when certain confirmations occur, and how to handle upcoming changes. The FTSE is an index which has developed a longer consolidation period after its recovery approach from the corona breakdowns seen this year, the big question as it is also the same in other major indices is if this recovery can sustain further within a healthy unspeculative market environment or if there is more downside ahead especially when an increase in corona shows bearish downside action similarly to those mechanisms seen this year.
Looking at my chart you can watch there that the index is trading in a longer stretched descending parallel channel which is marked in red where it is consolidating slightly to the downside and already touched the upper and lower boundary several times, such formations tend to break out sooner or later and the longer such formations develop the heavier and more volatile the breakout will be. Technically speaking the consolidation can go on more time when there is no positive news event which is altering the situation immediately to the upside, furthermore, the wave count establishing supports this scenario where the final wave E can form over the next times while the upper boundary confirming bearish again this final wave is not far away and within the high possible range. When this happens and the final wave develops the index has some solid support at the Fibonacci-support seen in my chart which is the 50 % level of the whole wave up, this support is also matching with the lower boundary of the channel where a bounce can be given and expected. When the index bounces in this area it can move on to confirm the bull-flag which will activate targets way above the range but the importance is to show up with the confirmation.
This possible bull-flag breakout can confirm a healthy bullish edge but that does not mean the whole index is completely bullish as there are still strong resistance levels and the index is trading way below its all-time-high-condition, therefore we should not keep the bearish scenario fully by side here, the bull-flag can confirm bullishness on the short and long-term but that does not mean it will definitely go up into the long term as well, in this case the bull-flag can be traded on the long-side but it should be seen crucial when it is approaching resistances in the range above.
In this manner, thank you for watching the analysis, support for more market insight, and all the best!
Information provided is only educational and should not be used to take action in the market.
FTSE Elliott Wave Analysis for Wednesday 13/09/2023As expected we took out the high and the correction up looks complete now. This means wave X can be finished and we should see more downside as a wave Y. However, aligned with the US indices, we expect another corrective leg up.

FTSE Elliott Wave Analysis for Tuesday 12/09/2023As expected we went back into the wave X area to take out the previous high. This means we get an additional correction up as a wave X. This correction up does not look complete yet. We need at least one more high. Wave X up should be followed by further downside as a wave Y.

FTSE Elliott Wave Analysis for Monday 11/09/2023 (+ Higher TF)For traders (lower timeframe):
The primary expectation is now that we will go back into the wave X area to take out the previous high. That would mean we get an additional correction up as a wave X. This move should be followed by further downside as a wave Y.
For investors (higher timeframe):
In the higher timeframe, investors should wait till the higher degree WXY correction is finished. It is still early but we are approaching the first relevant areas.

FTSE Elliott Wave Analysis for Friday 08/09/2023It looks like the primary scenario is playing out and we are reversing from the wave X area. We expect more downside as an ABC structure to finish wave Y.

FTSE Elliott Wave Analysis for Thursday 07/09/2023It looks like the primary scenario is playing out and we are reversing from the wave X area. We expect more downside as an ABC structure to finish wave Y.
