FTSE100: Breakdown of the support level.Breakdown of the support level amid a negative news background for the UK.
Ftse100short


ridethepig | Positional Play in UK Equities 📌 UK Equities remain vulnerable with Brexit & Covid in play.
(Similar representation for those tracking the moves in S&P, NQ, DJIA and etc...)
(1) Firstly challenge the view that Rishi's stimulus produces an immediate effect and anything more than a spring mattress; the furlough scheme is incredibly expensive and weighing heavy despite being totally justified.
(2) Recognise the idea that we are in a dead-cat-bounce in Equities broadly and that the UK is particularly exposed to these corrections which is key in positional swings! With this said, I struggle to find positives in the UK and in doing so prevents exposure on the bid. In order to bring interest in UK Equities I would need to see the current lows swept and in the event of a no-deal Brexit then we can see as low as 3579.x.
(3) Keep to the strategy - avoid getting soft hands and closing out too early (out of fear of missing the rally) and try rather to operate with a sense of calm and tranquility.
(4) Aim for total destruction of UK assets in the coming year, sadly the individual mobility of almost every sector will be affected from the political suicide.
(5) Get used to observing the complacency and "sell on rallies"; do not let an emotional retail approach be decisive.
(6) Remember what is important for Positional swings ... we are not attacking, or even defending, but remaining nimble with the capital outflows, rather like meandering water.
Thanks as usual for keeping the feedback coming 👍 or 👎

🐱The FTSE 100 is what a dead-cat bounce looks likeCompared to major indices in the US, Europe and Asia, the FTSE100 is getting beaten up, and beaten up bad.
Macro economic factors for the UK are very bearish, with huge job layoffs and big unemployment numbers when the UK furlough scheme ends, not a lot has changed since my last update.
Major FTSE 100 companies like Taylor Wimpey, BP, Lloyds, BT etc are all leading the way with the beat downs.
The bounce started strong and we got all the way up to 6,500 before getting chopped down back to 6,000.
Since then the FTSE has never really gotten off the ground and has been playing around the 6,000 level for the last few weeks.
Without strong fundamentals to lead the FTSE higher, it looks like the next level is going to be lower.
Using fib and past support and psychology levels the next areas of support are 5,900, 5,700 and then 5,500.
Have a question about the FTSE100? Leave a comment below.

📈FTSE 100 - Here's where we are going next in August 👇This is a chart of the FTSE100 on the daily time frame, each bar is 1 day of price action. In this post I talk about the price action of July, bull and bear cases for the FTSE and important levels to watch out for if you're looking to add to positions.
The last time I posted about the FTSE I said it was important that we do not break the 6,000 level, and if we do it becomes more probable that we see the 5,000 level again.
A clear break of the 6,000 level would indicate that the March rally was a dead count bounce.
On Thursday the FTSE broke the 6,000 level.
On Friday it back tested the 6,000 level as resistance, what was once support has now become resistance (wick on the last bar touched the 6,000 level before selling off sharply.)
It convincing broke that level showing sellers wanting to get out.
What has happened in the UK in July?
Let’s start with UK’s biggest bank Lloyds which is a barometer for the financial economy (I exl HSBC as it’s a multinational, but if you take a look at all banks, they are breaking major support levels across the board).
From March till July, Lloyds was holding strong above the 30p mark a huge level in place since 2008 GFC, this week it’s earning came out much worse than expected and it broke major support sitting at 26p.
Now over to energy – BP.
Like Lloyds, BP was keeping its head above water at 300p a historical level of importance for over a decade of price action.
This area acted as support all the way back from 2010 and 2015, this week it fell through the floor and now sits at 275p.
BT was keeping afloat above the 115p area for months and now is at 98p, lowest price in a decade.
Taylor Wimpy major level was 130p in play from 2016 and 2018 where it bounce off nicely, for months it was using this level as support, it now sits at 118p.
Across a wide range of sectors, many UK large businesses have broken major support levels that have supported them for many years, suggesting that the overall mood is bearish and that in the next few months we should expect more downside.
Why did we see a sharp amount of selling the last few days? Some things to think about.
On Friday UK ended its 80% furlough scheme, now it’s only gives 60% with employers putting up the other 20%. The question is how many employers are going to put up the 20% with their profits slashed.
I don’t think it’s any surprise that we see the break of support on the Thursday, two days before the scheme was being cut, I assume that investors were waiting to see if this would be extended before making their way to the exit.
On Friday Brois slammed on the “breaks” for -opening the UK, with some parts of North England under some type of lockdown, slowing down the recovery. Casinos, bowling alleys etc opening are also delayed for at least two weeks. Borris also stated another nationwide lockdown is not off the cards.
No trade deal with the EU does not help local UK businesses, and the strengthening of the GBP is dragging the FTSE down as it makes foreign investment into the FTSE less attractive.
In my last FTSE post I stated that I expected to see many more layoffs and that has come true, not a day goes by without a major firm reducing staff.
Companies all over the globe are figuring out how to do more with less, and when they figure that out it will result in job cuts.
Mortgage holiday and credit card holidays are coming to an end shortly, signalling more pain for banks and reasons to exit.
Now let's focus on the bull cases for the FTSE100, if you have your own bull/bear cases please leave a comment below so we can share ideas.
The UK gets the virus under control and we see a v-shape recovery, or a vaccine.
The bulk of employers pay 20% of the furlough for staff staying at home and unemployment does not increase, and by October we are back to normal (that's when the scheme ends), or the scheme is extended.
UK gets a great EU trade deal.
The first area of support on the FTSE is minor support at 5,700~, we can see it acting as both support and resistance from March-July, and if you zoom out over 10 years, this level has acted as S/R in the past, I expect buyers to step in here, but will there be more buyers than sellers?
If we cannot hold the 5,700 area, then it’s most likely that we go and re-test the 5,000 area where I expect there to be a lot of buyers waiting.
If you’re holding FTSE funds/ETF and are thinking about adding, these are important levels to watch out for to average in.
Can we see the FTSE100 break above the 6,000 level next week?
Yes, it can.
If the FTSE goes upward of 6,000, I would like to see a huge green candle as that shows that buyers are stepping in, I would then like to see the FTSE close above 6k for several days, making the break below 6,000 a bear trap. If that does not happen, then we can expect more downside to the FTSE 100. Looking at the RSI buying moment is weak and shows that the bears are firmly in control right now.
Have a question? Then leave one below.

🥊The FTSE is sitting on major support, will it break down?🥊I have drew an easy to understand technical chart of the FTSE 100, highlighting the major support and resistance areas from March to July, using a daily chart (each bar is 1 day of trading on the FTSE100).
We can see that the 5,000 area acted as major support level in March, on 4 days wicks broke the 5k level but closed above (that tell us this is a huge support area).
FTSE bounced from the 5k area to break the 6,000 area on its second attempt, and since has been ranging between 6,500-6,000 area.
You’ll notice these support and resistance numbers are very well rounded (5k, 6k, 6.5k), bigger support levels on larger time-frames are often connected to psychological levels, because everyone investing/trading is watching these levels and it's why they work so well.
Moment on the RSI is below 50 and is fading, during the high in June it did not break the 70 level which is a little worrying, I read it as buyers not believing in the rally with more downside to come in the coming weeks.
We ended the week at 6,095 and bounced nicely off 6k support.
What happens next?
If we break the 6,000 level head lower, this leads to a path to re-test the 5k level. For a breakdown to happen I would want to see 4-5 days in a row that the FTSE closes below 6k. It can very well close 1-2 days below 6k and the next day break up and crush shorts (known as a bear trap).
If we do break this level I’ll be looking to add to my positions on the stocks I think are going to benefit in a potential rescission/depression/stagflation environment listed on the FTSE100.
For the FTSE to show signs of strength, it first needs to take out the minor resistance level at 6,350~ level, before taking another run at the 6,500 level.
Until there is a CLEAN break of the 6,000 level downwards or the 6,500 range upwards, the FTSE is consolidating in a range, it’s up to buyers and sellers to decide the road it takes next.
If you like my chart feel free to give my charts a follow :).

FTSE 100 Bear Flag (Updated)I'd like to refine my past post on the FTSE 100 Bear Flag - to give it a bit more strength.
There's a key level of support (now resistance) in white. This is a right-angled descending broadening wedge that's been forming since Feb 2017.
The white support of this pattern neatly intersects with the blue colour Bear Flag as of April 29 (Today)
I think this adds a little more to my conviction that this uptrend has hit the end of the road.
Adrian

FTSE100 To Test Major Support Level SoonFTSE100 (UK100) tries to hold 5600 after multiple failed attempts to overtake 5800. It is currently sitting on a support level. The 4-hour chart is showing us that it is in a descending channel that could form into a bullish flag.
What do we have here?
✔️ Descending Channel Following Longer-Term Downtrend
✔️ FTSE100 - Losing Support Level at 5600
Thank you, Connor,
Please feel free to follow me to get more analysis. On Tradingview I share 1hr, 4hr, 1D, 1W charting analysis across major instruments only. For more short term analysis and trading ideas please subscribe to The Margin Call.


UK100: Daytrade-Opportunity#SELL the DTHey tradomaniacs,
welcome to another free signal of WEEK 36 Nr. 5
How to trade: 1. Wait for a break below the Neckline
2. Wait for the retest of the neckline and sell when you see rejection
-----------------------------
Type: Daytrade
Sell here: 7269
Stop-Loss: 7288
Target 1: 7235,4
Target 2: 7218,5
-----------------------------
LEAVE A LIKE AND A COMMENT - I appreciate every support! =)
Peace and good trades
Irasor
Wanna see more? Don`t forget to follow me.
Any questions? PM me. :-)

FTSE 100 Short Trade *4hr TREND CONTINUATION*Simple trend continuation trade.
- Lower highs and now lower low
- Price rejecting 4hr 50ema
- Fib 0.618 retracement level
- Price rejecting 7200 price level
Looking for a new lower low and price to finally reach 7000.00

UK100: Day-Swingtrade-Opportunity#SELLHey tradomaniacs,
welcome to another free signal!
Important: Wait for the Breakout and sell the retest!
-----------------------------
Type: Day-Swingtrade
Sell-Limit: 7281,8
Stop-Loss: 7328,5
Target 1: 7208,2
Target 2: 7164,0
Target 3: 1,31377
-----------------------------
LEAVE A LIKE AND A COMMENT - I appreciate every support! =)
Peace and good trades
Irasor
Wanna see more? Don`t forget to follow me.
Any questions? PM me. :-)

FTSE100 OVERVALUED - BULL TRAP - SHORT ITThe FTSE100 index is selling at a P/E of 17.2. This is quite high in a low interest rate, low growth scenario. The UK is in a mess, with Brexit problems, neighboring countries teetering on recession and Boris taking over the leadership. A DCF valuation of the FTSE100 using 3.2% growth, 8.6% discount rate it shows the index is 11% overvalued. I think the German DAX and US markets are going to tank soon, don't be fooled by the cut in interest rates in the US. The ECB can't really cut rates much more with low or negative rates already in Europe. Negative rates are a desperate attempt to inflate a sagging economy, European markets are ripe for a fall. The FTSE100 has jumped up a bit lately, this is a bull trap above the downward sloping trendline. The technicals are hinting at a coming fall. If you do short, I'd prefer to short the DAX as it has a lot foreign trade exposure with its auto industries. However, for those watching the FTSE100 index, a short now could be a winner.

UKX FTSE100 1hr rejection from 7600FTSE 100 has rejected 7600-7590 area in the 1hr time frame, 3 consecutive times suggesting that a correction is possible.
If FTSE100 breaks below 7550 (23% fib level) we can see a correction upto 60% Fib levels at 7440-7430 levels.
But FTSE needs to break below 7550 to trigger this trade.
Stops should be above the recent highs.

FTSE100 potential Break Down FTSE 100 has a potential break down below 7140 which could lead all the way down to 6900s.
For a entry, looking a entrancement back above 7200 with stops around 7400.

UK100: Day-Swingtrade-Opportunity!#SellChanceHey tradomaniacs,
welcome to another free signal!
-----------------------------
Type: Day-Swingtrade
Sell-Limit: 7426,7
Stop-Loss: 7453
Target 1: 7364,8
Target 2: 7326,1
Point of Risk-Reduction: 7396,5
-----------------------------
LEAVE A LIKE AND A COMMENT - I appreciate every support! =)
Peace and good trades
Irasor
Wanna see more? Don`t forget to follow me.
Any questions? PM me. :-)

FTSE100 - Indices Trading | Elliott Wave Structures | Q2 2019*Please support this idea with a LIKE if it helps you. Thanks!
More details about me in my signature.
FTSE100 - Elliott Wave Outlook
Bearish Swings - Patterns:
Flat Structure in Cycle Wave IV (green)
Primary A (turquoise) - Simple Correction
Primary B (turquoise) - Complex Flat
Primary C (turquoise) - Bearish Extension
Bullish Swings - Patterns:
Leading Diagonal in Intermediate (A) (blue)
Next expected swing:
Bearish sequence in Intermediate (B) (blue)
Structure change:
Breach of the lower trend-line could lead towards Intermediate (B) (blue) already in play.


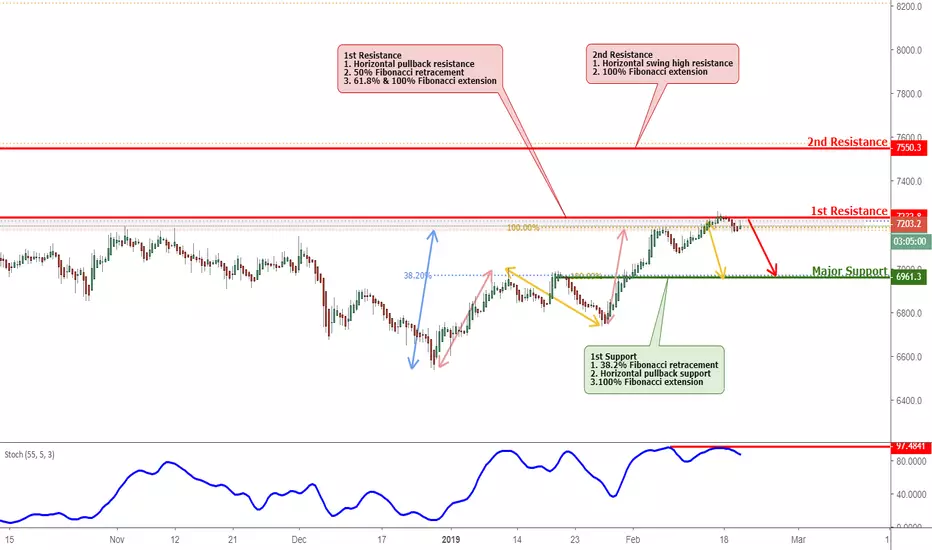
UKX Reversed Off Resistance, Prepare For Further DropFTSE 100 approached our first resistance at 7233 (horizontal pullback resistance, 50% Fibonacci retracement , 61.8% & 100% Fibonacci extension ) where a strong drop might occur below this level pushing price down to our major support at 6961(38.2% Fibonacci retracement , Horizontal pullback support, 100% Fibonacci extension )
Stochastic (55,5,3) is also approaching resistance where we might see a corresponding drop in price.
Trading CFDs on margin carries high risk. Losses can exceed the initial investment so please ensure you fully understand the risks.
SHORT UKX approaching resistance, potential drop!just now
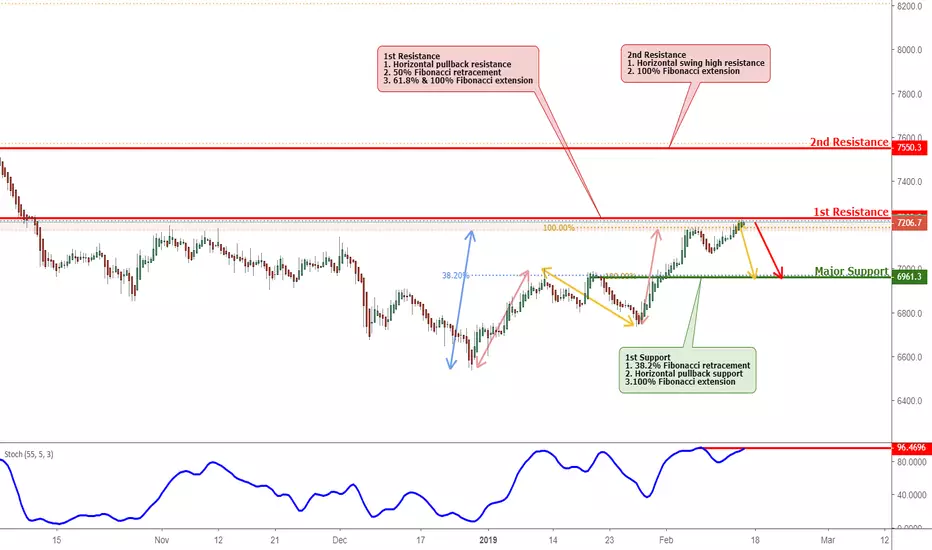
FTSE 100 is approaching our first resistance at 7233 (horizontal pullback resistance, 50% Fibonacci retracement , 61.8% & 100% Fibonacci extension ) where a strong drop might occur below this level pushing price down to our major support at 6961(38.2% Fibonacci retracement , Horizontal pullback support, 100% Fibonacci extension )
Stochastic (55,5,3) is also approaching resistance where we might see a corresponding drop in price.
Trading CFDs on margin carries high risk. Losses can exceed the initial investment so please ensure you fully understand the risks.
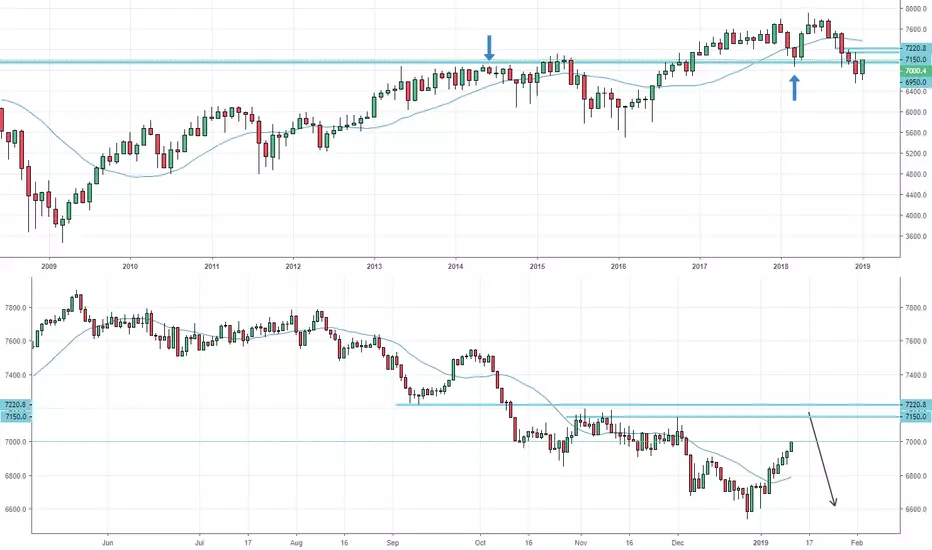
FTSE 100: Waiting for another drop starting at 7150The overall trend is still lower - with a break above 7000 - 7150-200 could be the next zone of resistance to see selling back towards the lows
FTSE Elliott Wave Analysis: Started Another Extension LowerHello Traders,
FTSE short-term Elliott Wave view suggests that the rally to 7790.17 high ended blue wave (X) bounce. Down from there, blue wave (Y) remains in progress with instrument showing a lower low sequence. The internals of that leg lower is taking place as double correction lower due to overlapping price action happening from 7790.17 high thus suggesting that the decline is unfolding in 3 waves corrective sequence.
Down from 7790.17 high, the initial move to 7477.05 low ended red wave W of (Y). The internals of that lesser degree decline unfolded as a Zigzag structure where black wave ((a)) ended in 5 waves at 7614.48 low. Then the bounce to 7665.24 high ended black wave ((b)) bounce. And decline to 7477.05 low ended black wave ((c)) of W in another 5 waves structure.
Up from there, the bounce higher to 7639.13 high ended red wave X of (Y). The internals of that bounce unfolded as double three structure where black wave ((w)) ended at 7616.15 high. Black wave ((x)) ended at 7531.24 low and black wave ((y)) of red X ended at 7639.13 high.
Down from there, the index has made a new low confirming that red wave Y of (Y) has started and looking for extension lower towards 7323.99-7250.04, which is 100%-123.6% Fibonacci extension area of red W-X. Near-term, while bounces stay below 7639.13 high expect index to extend lower. We don’t like selling it.
