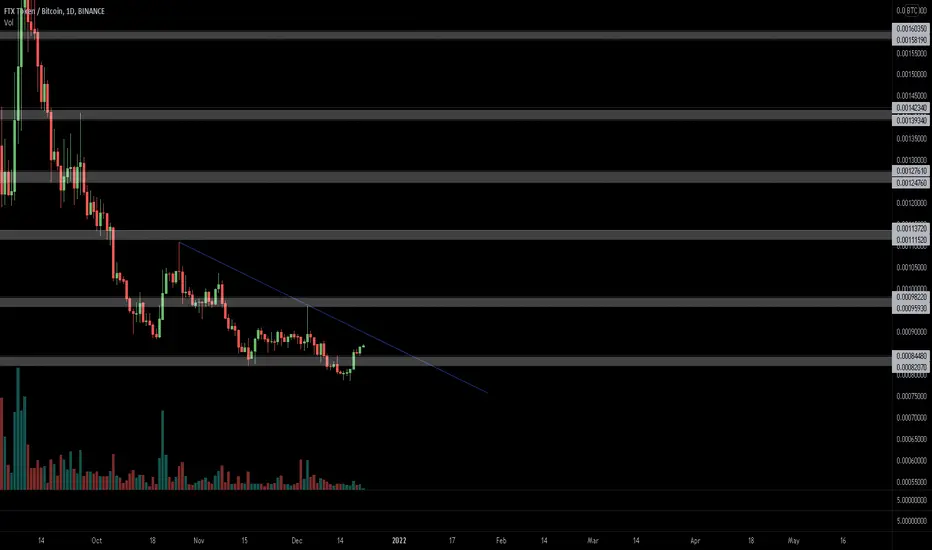
Bear Divergence on 4H #FTT ?FTT Bear Divergence on 4H timeframe
The recent FTT push seemed to coincide with CRO hacking incident
With CRO recovering somewhat, FTT may undergo correction
Let's see... NFA DYOR
FTT

🔥 FTT Killing It: Back To Former Glory?Ever since bottoming around $34, FTT has seen a massive influx of buyers. What I'm assuming is that investors are trying to front-run another impulse wave.
FTT is an interesting coin for that matter, since the impulse waves come as fast as they go, and the gains can vary from +200%-+500%. Interested to see whether we're getting another impulse wave.
Shorter-term targets are placed at recent tops.
Happy trading!

$FTT, First 1D UCTS Buy since September run-up into ATH$FTT
First 1D UCTS Buy since September run-up into ATH
kinda skeptic till it breaks descending trendline and volume shows a stronger view
Still a 1D is strong signal and I will follow it
#FTT
FTT MEGA BULLISH1. FTT/BTC breaking all time highs
2. FTT/USDT above the major resistance/pivot point
3. Breaking of the ichimoku will 100% confirm the moonshot
4. Probably IPO soon lol
WAGMI
-Nav

FTT possible Long Entry Hello crypto traders,
FTT may offer good entry at pull back to monthly support point and exist with 11%- 17% at next resistance as Shown .
Crypto Technical Analysis By CTKS method .
Happy trade!

FTT - Range or PushHello,
Disclamer : This is not investment advice
We are on oblique resistance Works 2 time.
My strategy : It is possible that we come to the reloading area of the old rise. I wait the 38.2/38.4 to buy and add stop-losse under the previous bottom at 33.10
the momentum and Williams say it is possible to go bottom and rise after.

FTTUSDTHello Crypto Lovers,
Mars Signals team wishes you high profits.
We are in the daily time frame. We have the S1 line which has supported the price several times. Now the price has been rejected from the R1 line and is trading below it. We can buy it at the S1 line and when it breaks the R1 line, it can move up to the R2 zone. If it breaks the S1, then there would be more falling. You had better wait for the price to break the R1, make its pullback, and then enter the trade.
Warning: This is just a suggestion and we do not guarantee profits. We advise you to analyze the chart before opening any positions.
Wish you luck

FTT profit 30% after 4h BULL signal - time to short? Please Like or Follow if you enjoyed this content.
UPDATE: The price pumped 30% after Bull signal. Currently on the verge of breaking support at 43.50 USDT. If support doesn't hold, 42 USDT is next support.
This analysis is made with my "Supertrend Ninja" indicator. When the background of the candlestick closes green (vertical line). It indicates a possible bullish (up)trend. A red background indicates a possible bearish downtrend. Currently FTT is still in a downtrend.
Supports and Resistances are highlighted as grey blocks. Profits can be taken at each grey block. Supports and resistances are automatically drawn using my indicator "Yo Show Me Some Support - and Resistances". Pun intended.
Thank you for reading.
Namasté 🙏
What Indicators Do I Use:
In the chart I am using my "Supertrend Ninja - indicator", which is a trend-following indicator (Green and red vertical line with arrows). When the background of the candlestick closes green (vertical line) with an upwards pointing pink arrow. It indicates a possible bullish (up)trend.
With each trade proper risk management is essential. Either by using my script "Trailing Stoploss Bottom Activation indicator", visible as grey dots below the candles. Which sends an alert, when current price goes below the previous candle low. Or using my "HA Trailing Stoploss Activation", the indicator below with green and red blocks. Or third option, exit when the Supertrend Ninja indicator displays a vertical red line with a downwards pointing black arrow. Remember, the first stop(loss) is always the cheapest stop.
Disclaimer: Ideas are for entertainment purposes only. Not financial advice. Your own due diligence is highly advised before entering trades. Past performance is no guarantee of future returns.

FTTUST , FTX token is bullish and ready for good move.Key levels at 54 and above 60 if it penetrates that resistance we might head to a new all-time high.
HODL

Bullish Divergence on FTT!This chart is in the linear form! However, FTT just broke bearish trend line in the candlestick chart.
If we close the daily above that trendline, We can expect FTT to target higher prices.
Next targets:
$48, $53 and $59.
Let me know what you think. Please follow me and like this post!

FTT longFTT is breaking through the strong resistance area where it was rejected two times. In case the price keeps holding above the area, this level vill turn to support and bullish movement to next resistance at 53$ is expected to happen

FTT lower wedge breakoutFTT is breaking up from wedge pattern. Potential targets:
TP1 48$
TP2 55$
TP3 63$
SL 39$

FTT 1H Bear Divergence Trade SetupInteresting Trade setup on 1H FTT timeframe using Bear Divergence and Volume Profile indicator.

FTT/USDT - Potential 64% SetupHello Traders!
FTT corrected together with the market, the price came to the buyers' interest zone of $34.60 - $41.90
After exiting from correction, it is possible to count on the high-grade rebound.
We can consider an entry into the position in the range of $40.00 - $41.90
Closing of a position using a stop-loss can be considered in case of price leaving under the level of $33.00
The targers will be price levels of
$54,00
$61,40
$65,75
Good luck and watch out for the market
P.S. This is an educational analysis that shall not be considered financial advice

FTT/USDT TRADE SETUP! 50% MOVE EXPECTED!!Hello everyone, if you like the idea, do not forget to support with a like and follow.
Welcome to this FTT/USDT trade setup. FTT looks good here. Breaking out from the falling wedge-like structure. You can buy some now and add more at the retest.
Entry range:- $39.5-$41.5
Target1:- $44.2
Target2:- $48.8
Target3:- $53.7
Target4:- $59.6
SL:- $36.4
If you like this idea then do support it with like and follow.
Also, share your views in the comment section.
Thank You!


FTT Pathway to previous ATH or next support levelFTT now has bull divergence on daily timeframe. Chart shows possible pathways to previous ATH or next support level with key factor being how price react at key volume profile level. Let's c. NAF DYOR

Crypto bottleneck cointinues to tightenWe've been hugging the lower end of the Bollinger Bands since the November peak, without much chopping between. The bands continue narrowing, and moving sideways. If you believe in the power of the bands, you might note just how wide the risk : reward spread has gotten across the market. Massive gainer potential here folks! It might be choppy though, be careful!
FTT
Upper Target: 44.42 (+17%)
Lower Target: 35.09 (-7%)
BTC
Upper Target: 53k (+26%)
Lower Target: 40k (-4%)
ETH
Upper Target: 4349 (+38%)
Lower Target: 3029 (-4%)
Which side are you trading?

Best of the Worst Crypto since New YearsOur ear's still ringing from the brilliant crash-boom-bang's kicking off the New Year, we take a look at the top coins ROI progression since January 1st, 2022.
Quite unexpectedly for me, I watched KNCUSD pop massively last week with great pleasure. Still the ONLY coin in my top-of-the-marketcap-list of crypto's under watch in the green, the bearish momentum appears to be contained for the moment, with some signs of bullish reversal wave beginning. However, we're far from confirmation of any reversal. So keep your eyes open for increased volatility.
At the head of the pack is FTTUSD, now just -%1 down since the start of the year, recovering nearly 10% from the low's on January 8th.
XLMUSD and XTZUSD aren't far behind, just -3% and -4% behind for the year thus far.

🔥 FTT Bearish Break OutFTT has been on a strong losing streak since it hit the all-time high last September.
With FTT falling through the last strong support, there's little holding FTT back from dropping any further. To reinforce my bearish bias, I think it would be ideal for FTT to re-test the prior support and turn it into resistance.
Long-term bear target would be the lows from the summer-21 bear market.

FTT vs USDT ---LONG---05.01.22The coin of the FTX exchange indicated a potentially promising structure for growth.
From December 17, you can see an impulse that resembles a leading diagonal, which in turn can be, like wave A in the correctional structure of the ABC (this scenario is marked in red), but also this leading diagonal can only be wave "one" in a more significant impulse of five waves (this scenario is marked in black)
Also worth noting is the significant supply or resistance zone, which is around $ 50 (marked grey).
In the case of a positive scenario, the price will hold above this area, in the case of the scenario marked in red, the price will not be able to hold above this area.
If the price holds below the local minimum of $ 36 (marked with a red tick), both of these scenarios will be irrelevant in the form in which they are indicated at the moment.
Total:
If you are negative about FTT then you can try to look for short positions in the area marked with gray.
If you are positive, you can try to pick up an upward movement within the C wave or an even more significant higher-order impulse.

ftt/usdFTT/USD pair
Guys it looks first wave was done and now is starting big third wave...
That means, FTT will explode
In my opinion in 2k22 FTT would have bull run
So i am taking some positions
if someone want to long from now u can set SL on 36 bucks and target u can check on the chart
Wish u Luck!

What does macd divergence do?A short-term uptrend is expected, but breaking the trend line is crucial
Otherwise the drawn process will occur
