FTT is going to break!Hi everyone,
If ftt break the line you can buy with the target and stoploss which is shown.
Ftt is growing up, don't miss this.
FTX
FTX UNDERVALUED PROJECT!Looks very undervalued at 56$. Price formed a Cup and Handle Pattern and will eventually break to the upside.
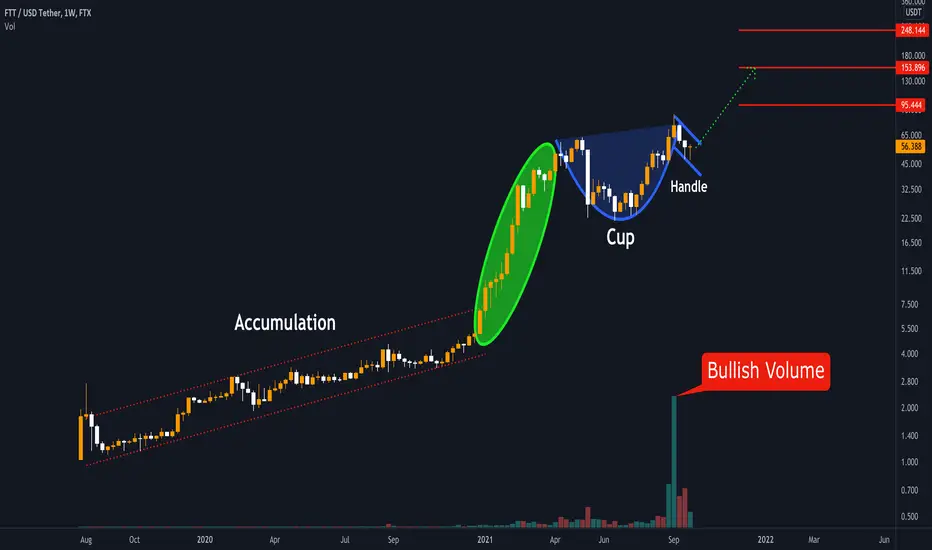
$FTT will melt faces in fourth quarter of 2021Triple digits soon. Look at the dynamics acting totally similar to the run in early 2021.

ATOM on the way, please BTC be niceATOM bullish while BTC doesnt shit us
Probably new all time high if we get some good momentum breaking these important levels

BINANCE COIN - TARGET HIT. Whats Next?In our last analysis, we were short from the 417 level with targets of 328. We bounce off perfectly off the channel and now making our way up.
We are now looking for buying opportunities to take BNB higher. Waiting for a deeper pullback, ideally a retest of the channel support before moving higher.
Watch for lower timeframe reversal patterns once we approach the channel support in the next week or so.

NEAR USDT LONG SWING TRADE | NEARUSDT | LONG @ 7.5 - 8 | TP @ 8.5, 9, 9.5, 10, 10.5 | SL @ 6.5 | PATTERN = LOW POLE REVERSAL |
PNF chart on the hourly shows a trend reversal, LOW POLE REVERSAL
The strategies I use involve a mix of PNF and Renko. My type of trading is strictly swing trading.

BTC bearflag formation on 4HThis is what I am seeing. I see 2 possibilities here, as marked in orange and yellow arrows.
I do feel BTC might go put $42.8k and then start dumping from there - yellow arrow.
If this doesn't happen and if BTC moves up to $44k + levels, good chance of dumping from there - orange arrow.
In my opinion and given the news that is meant to come out in the next couple of days and the ongoing China FUD, the closing of exchanges in China etc. most likely scenario is the yellow arrow. Trade with caution.
I have a buy limit at $38k as I do not want to miss on it if it doesn't go below $38k.

LONG FTTPERP FROM 47 TO 50 TARGET 110FTTUSD has both fundemantals and technicals on his side.
Technically 47 when it will hit and bounce at 47 usd ftt will be having it's double bottom on the the overall pullback from 83.
technically a bounce from 47 usd area can lead us to the target area 120 to 130 USD.
but hey it's crypto, then fundamentals say this:
sam bankman is now free to pump ftx coin. Why? because he bought back binance dominance in ftx; if binance went from 9 usd to 500 usd with all the fuds against CZ I only wonder where Sam bankman will take his coin. In my opinion it can go far way beyond 1k by next year. Noticed how FTT pumped since they bought back binance shares in FTX?
So what's the plan?
I personnaly bought a lot of ftt on and i'm also trading a small part on margin. My Margin long will be 5X around 47 only if price bounces when it hits that area. If price goes UP from here ? no worry i'll buy at market at 52 and wait. the only problem will be fees.
Bearish scenario? Only if price BREAKS below 47 and goes to 1.618 area which is 41, and from 41 if we don't get the strongest rally in crypto's history then ftt is worthless.
what's the strategy from now? Wait today and tomorrow either 3 scenario happen
1. Hit 47 and bounce we buy after bounce around 48. don't buy before you see any reaction it would be gambling.
2. Price rallies from here this area at the moment of publishing is the 78% fibs from 47 usd to 60, then same strategy just fomo in or wait for a small pullback at 5min if you're too cautious
3. it breaks 47 USD and no reaction please wait 41USD and watch the reaction, something surprising might happen.
When take profit in case of pump? December baby, let it roll up down until december and just take profit at the end of the first week of december , we might miss out but better miss a few than see your profits melt.
Good luck to everyone

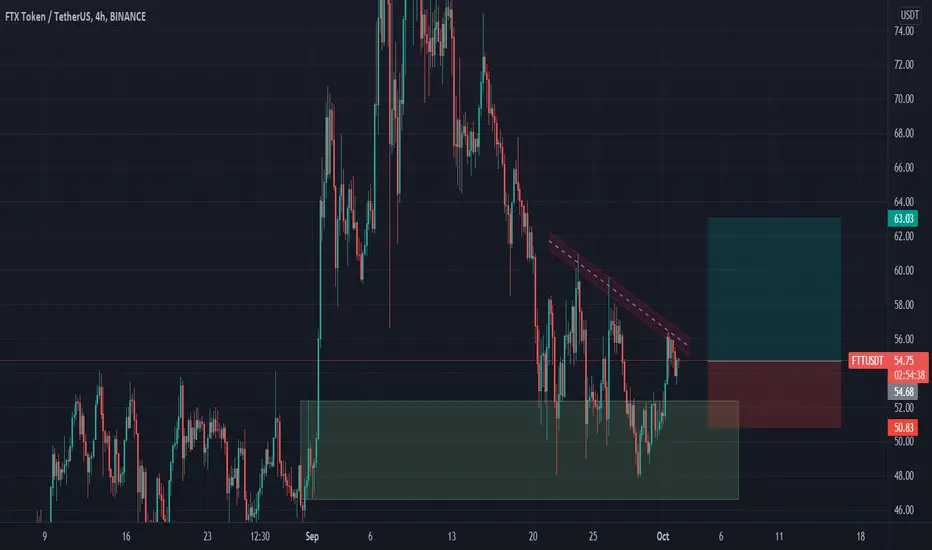
Time to go, TP 70.6Following 4h graph.
Broke and got confirmation for the descending line, now it's time to go.
We also got an RSI confirmation.
TP1 59.5
TP2 64
TP3 70.5
SL 48.7

AAVE USDT SHORT SWING TRADE | AAVEUSDT | SHORT @ 300 - 292 | TP @ 292, 288, 284, 280, 276 | SL @ 316 | PATTERN = N/A |
PNF chart on the hourly shows a trend reversal
The strategies I use involve a mix of PNF and Renko. My type of trading is strictly swing trading.

BCH USDT SHORT SWING TRADE | BCHUSDT | SHORT @ 545 - 540 | TP @ 535, 530, 525, 520, 515 | SL @ 565 | PATTERN = N/A |
PNF chart on the hourly shows a trend reversal
The strategies I use involve a mix of PNF and Renko. My type of trading is strictly swing trading.

KSM USDT SHORT SWING TRADE | KSMUSDT | SHORT @ 352 - 348 | TP @ 344, 340, 336, 332, 328 | SL @ 368 | PATTERN = HIGH POLE WARNING |
PNF chart on the hourly shows a trend reversal, HIGH POLE WARNING.
The strategies I use involve a mix of PNF and Renko. My type of trading is strictly swing trading.

ETH USDT LONG SWING TRADE | ETHUSDT | LONG @ 3050 - 3100 | TP @ 3150, 3200, 3250, 3300, 3350 | SL @ 2950 | PATTERN = LOW POLE REVERSAL |
PNF chart on the hourly shows a trend reversal, LOW POLE REVERSAL.
The strategies I use involve a mix of PNF and Renko. My type of trading is strictly swing trading.

MKR USDT SHORT SWING TRADE| MKRUSDT | SHORT @ 2380 - 2370 | TP @ 2360, 2350, 2340, 2330, 2320 | SL @ 2460 | PATTERN = DESCENDING TRIPLE BOTTOM BREAKDOWN |
PNF chart on the hourly shows a trend reversal, DESCENDING TRIPLE BOTTOM BREAKDOWN.
The strategies I use involve a mix of PNF and Renko. My type of trading is strictly swing trading.

MKR USDT LONG SWING TRADE | MKRUSDT | LONG @ 2500 - 2550 | TP @ 2600, 2650, 2700, 2750, 2800 | SL @ 2420 | PATTERN = TRIPLE TOP BREAKOUT |
PNF chart on the hourly shows a breakout, TRIPLE TOP BREAKOUT
The strategies I use involve a mix of PNF and Renko. My type of trading is strictly swing trading.

RUNE USDT LONG SWING TRADE | RUNEUSDT | LONG @ 8 - 8.5 | TP @ 9, 9.5, 10, 10.5, 11 | SL @ 7 | PATTERN = LOW POLE REVERSAL |
PNF chart on the hourly shows a trend reversal, LOW POLE REVERSAL
The strategies I use involve a mix of PNF and Renko. My type of trading is strictly swing trading.

FTTUSDT Next target $100?FTTUSDT (Day Chart) Technical analysis
FTT/USDT Currently trading at $60.00
Long Entry: above $50.00 -$60.00
Target 1 : $70.00
Target 2 : $85.00
Target 3 : $100.00
Taeget 4: $125.00
Max leverage: 2x or buy it on the spot market
Always keep stop loss

FTT/USD - Long opportunity for 10%, resistance broken! 🚀FTT has broken the resistance that has acted in this role since early September. After several re-tests we finally broke it once we bounced on a good support level
Now we're making this resistance level support, should that succeed, I see up quickly moving up with a nice target at $67. Once there best to secure profits and re-assess.
We also have a resistance at $62, however that will likely not hold us much.
The indicators like MACD and RSI are also curving up nicely, hence we're building a nice rally here. Risk reward favors a long.
Good luck!
Like and follow if you liked this idea!

SNX USDT LONG SWING TRADE | SNXUSDT | LONG @ 10.5 - 11 | TP @ 11.5, 12, 12.5, 13, 13.5 | SL @ 9.5 | PATTERN = N/A |
Testing my first swing trade on TradingView, not my first swing trade ever. PNF chart on the hourly shows a trend reversal.
The strategies I use involve a mix of PNF and Renko. My type of trading is strictly swing trading.

Shorting XRP, XRP formed a expanding pattern in in Hourly chart After an impulsive movement to the downside now XRP has formed expanding pattern. I am looking to short XRP From mine Double top.

BTC - prediction for upcoming days. I think the next inflation point for $BTC is 37400. If the BTC price Fall to 37400 In corrective nature there if possibilities $BTC could reverse to the bullish from there.
If you like my ideas please follow me. Thank you.

BTC Back to 30K I think BTC Will Drop to 30K. After An Bullish price action in 2020 and early 2021, Currenlty BTC is In correction.

BTC continuation downWe lost the support at 44k last night and saw a pretty sharp breakdown and is now acting as resistance on the smaller time frames.
Expecting a continuation move down to the area of interest around 38-40k before seeing another attempt and trying to change market structure.
IMO the market is still bearish and any bullish rally we have is a short term recovery.... You know how everyone screams "BUY THE DIP" in a bull market?
Well in a bear market we "SELL THE RECOVERY"
If you have trouble looking at charts objectively because of a confirmation bias, try inverting the chart and having another look
