FTTUSDT ANALYSISI have 4 positive signals It is above the horizontal line
You can still buy this coin but watch carefully EngineeringRobo' s sell signal
If you hold this coin sell with EngineerinRobo' s sell signal
Have a good trade If you want to use EngineeringRobo please dm me.
Ftxtoken

Ranging FTT Offers Multiple Opportunities for ProfitThe FTX platform is a major futures platform in the Crypto market, and FTT is the platform's token. The exchange offers many possibilities for futures crypto trading and has created numerous triple leveraged tokens. The company even created futures for the US elections and spot tokens such as TRUMPWINS and TRUMPLOSES.
FTT Fundamentals
The FTT token has some major fundamental advantages. The FTT platform rewards its clients for holding FTT tokens by giving discounts on trading fees and even making large holders of FTT VIP users (which provide lower fees, account manager, flexible API limits, provide input to FTX products, among other perks). These rewards increase demand over time as the platform gains popularity.
Additionally, the company also reduces the supply of FTT tokens by repurchasing and burning the tokens. FTX burns an amount equal to 33% of the fees generated on FTX markets, 10% of net additions from the insurance fund, and 5% of the fees earned from other uses of the FTX platform.
When demand increases and supply decreases, the token is bound to gain value. This propelled FTT to grow a whopping 240% since its inception.
FTT on the Chart
The FTT token usually grows in short bursts followed by prolonged periods of ranging. Although you could profit by just holding the token for a long time, the ranging periods also offer many opportunities for quick profits. The spread between the higher end of the support level and the lower end of the resistance level is 6.5%. Therefore, even if you take a position just above the support and sell just below resistance, you will still profit 6%. If you take more risk and enter the trade at the lower level of support and exit at a higher level of resistance, the profit margin rises to around 12%-15%.
The great aspect of this token is that it is usually quick to establish ranging levels after a strong push. This aspect makes it easier to identify a suitable entry and exit.

FTT is testing a crucial support levelWe have a nice price action around 3000 sats as you can see on the chart. This was and continues to be a strong support area. Also, one more reason to be confident about this support level is because the same 3000 sats level is also the point of control for the VPVR. I expect a rebound from this area in the near future.

FTTUSDT ANALYSISIf you wanna buy a coin, correct time to buy FTT because the candles passed the resistance line(3.21). Also, it was the last horizontal line. This means who knows how much benefit to wait you.
Actually, already I bought it.
Enjoy your benefit:)

FTX Token (FTT) Bullish Breakout, Long-Term Up IncomingFTX Token (FTTBTC) just printed a very strong bullish breakout and this is giving me the feeling of upcoming, sustained long-term growth.
We can see a strong big candle today which puts FTTBTC above all my EMAs/MA.
The trading volume has been green for the past 3 days and the RSI is looking very good (these are bullish signals).
The MACD is printing a young bullish crossover and allows for additional growth.
We can easily see 35%+ coming out of this pair in the coming days/weeks but 85%+ is also possible mid-term...
----
Conditions for change
This is an early signal since the daily candle is yet to close.
If prices breakdown and close below EMA200/MA200, the above signals become invalid and a new analysis is needed.
Any trading above EMA50 and we remain strongly bullish on FTX Token vs Bitcoin.
Remember to hit LIKE to show your support.
Namaste.

FTX US and Coinbase Custody... Leverage Long? | FTX TOKEN ($FTT)Hey fam, we are trying out a new color scheme. Let us know what you think in the comments.
FTX has seen some really bullish news recently between getting added to Coinbase Custody and launching FTX US. While having its leveraged tokens being delisted from Binance was a big blow to this up and coming exchange, there are still plenty of reasons to be bullish on FTX's native token FTT. One of the best reasons to be bullish on FTT is the overall uptrend according to our Fractal Trend indicator and the general appetite for exchange tokens in the crypto market.
With all that said, while a leveraged long would be exciting based on the FA, the TA isn't exactly giving us a clear entry here especially with BTC struggling to find clear support (see the related ideas below). So for now, let's look at some levels of interest to help plan for a nice long setup later.
Currently we are consolidating within a pennant. The bull case here is a rally out of the pennant to the upside. This would help it to retain FTT's overall uptrend since the COVID crash.
If the current price structure does not hold, which seems more likely, we can look for lower levels. Below us we see S1 - S3 support as plotted by our Directional Bias and Orderblock Mapping indicators. Of these S1 gives the bulls a solid support level off of which to ensure a continued uptrend.
Above us is R1 which will act as resistance regardless of which direction the price action goes, but should specifically be watched if FTT can rally past the top of the pennant.
Resources: ftx.us + cointelegraph.com + cointelegraph.com
✨ Drop a comment asking for an update, we do NEW setups every day! ✨
Like, Comment & Follow to help the community grow 🎉🎉
✨ Drop a comment asking for an update, we do NEW setups every day! ✨
Like, Comment & Follow to help the community grow 🎉🎉

ALL BULL and BEAR ARE SCAM, EXIT before your money goes to zero.Have you noticed that every time your BULL account is lower?
And even if BTC rises, it always continues lower and lower?
That's because they are robbing you.
I imagine you already noticed that on many occasions BEAR and BULL were at the same time in red with gigantic losses, however they were never at the same time in green.
That's what it's about, stealing from you.
Because it does not rise 3x with each bitcoin rise, it always rises less.
It also does not drop 3x, it drops much more, generally between 6 and 12x depending on the strength of the fall.
They made you believe that the graphs were paired, but they lied to you. They made up a story of illiquidity, and instead of correcting prices, they go on and on stealing.
I claimed in binance, but that's a Chinese mafia, they will never respond, they laughed in my face for more evidence that I showed them of the scam.
They know perfectly well that it is a scam, you get nothing with claiming.
What a theory says is one thing, what reality says is a completely different thing. It is a matter of taking calculations, it is not a matter of being mathematical geniuses.
EOSBULL is at 2.97.
EOS is for its part at 1.9 usd.
For EOS to regain the price on March 6, which was 3.8 usd, it must practically double.
If EOS doubles, the EOSBULL should triple. And if that happened, the EOSBULL would be at 9 (yesterday I did this same calculation and it gave 15).
Was the EOSBULL then on March 6 around 12? DO NOT. ON March 6 EOS was hovering around 90.
EOSBULL unfortunately should make an extra 1000% profit to just regain its value. And several days have passed and the trend remains the same.
All bull and bear are scams, ALL.

FTTBTC: +25% in BTCI find out token that is up in BTC - FTTBTC , token of FTX exchange.
Assuming all other exchange tokens pumped not this great I think there's a decent chance to short this local top.
Stop could be tighter - I'm keeping an eye on the market.
Information is just for educational purposes, never financial advice. Always do your own research.

FTX Token Chart Mapped | Resistance & Support LevelsHere we have for you the FTTBTC (FTX Token) chart with Fibonacci support and resistance levels mapped.
FTX Token (FTTBTC) Chart Analysis by Alan Masters
Here we have a very strong/bullish chart.
Prices for FTTBTC are now trading above EMA50 on really high volume. With a strong daily candle close (closing at 0.00002690 or higher), FTTBTC can continue straight up.
The RSI is bullish sitting at 65.
The MACD is trending up and gaining momentum.
Full bullish candle today.
Broken falling wedge.
Bullish Cryptocurrency Market.
FTX Token can easily continue to grow...
Make sure to hit LIKE if you enjoyed this post.
Thanks a lot for reading.
Namaste.

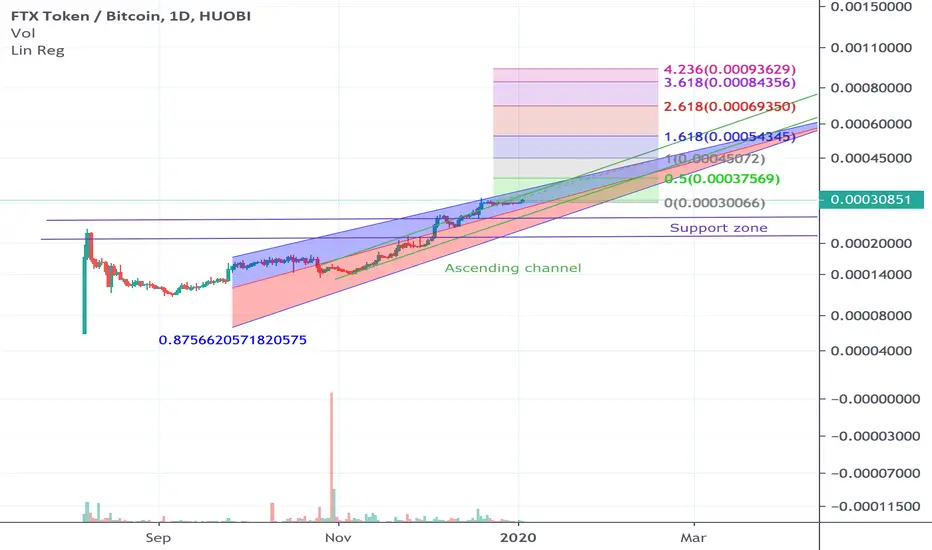
FTX Token Fib ExtensionFTX has been on a large bull run, sometimes we often miss these runs due to the youth of the coins but uncertainty is a great time to capitalise on opportunities. Strong linear regression uptrend. Also a strong parallel ascending channel.
FTTBTC Buy SignalPattern: Channel Up on 1D.
Signal: Bullish once the price touches the 1D MA50 again on a Higher Low.
Target: 0.000222 (Resistance).
