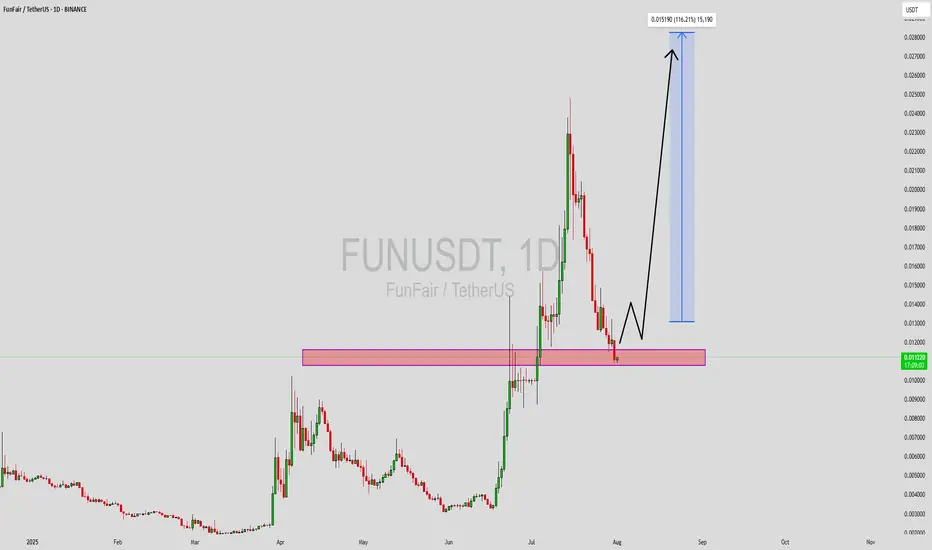
FUNUSDT Forming Bullish ReversalFUNUSDT is currently forming a bullish reversal pattern, signaling a potential shift in market momentum after a prolonged consolidation. This pattern, combined with a steady increase in trading volume, suggests growing investor interest and the possibility of an upcoming trend reversal. The structure aligns well with historical price action, where FUN has previously bounced from similar technical setups, making this an attractive chart for swing traders and medium-term investors.
The volume profile shows accumulation behavior, typically seen before major breakouts. This reflects the confidence of larger market participants entering at lower levels. If FUNUSDT confirms the breakout above resistance zones, the next leg up could lead to a potential price surge of 140% to 150% from current levels. Given its relatively low market cap and recent technical developments, the upside potential remains significant if momentum sustains.
What adds to the bullish thesis is the overall pattern integrity supported by clear trendline reactions and support zone validation. FUN has also maintained a healthy base formation, which often precedes explosive upward moves. A close above key resistance with volume confirmation would likely attract more traders and potentially push FUN into price discovery territory.
Keep this altcoin on your watchlist as it presents a high-reward setup supported by solid technical foundations and increasing trader sentiment.
✅ Show your support by hitting the like button and
✅ Leaving a comment below! (What is You opinion about this Coin)
Your feedback and engagement keep me inspired to share more insightful market analysis with you!
FUN
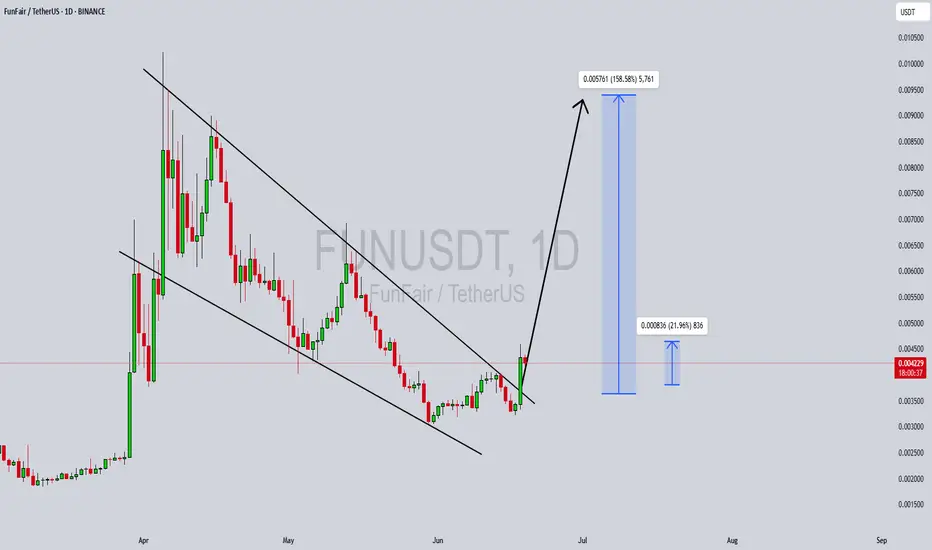
FUNUSDT Forming Bullish WaveFUNUSDT is currently showcasing a bullish wave pattern, signaling the potential continuation of its upward momentum. This type of pattern often indicates growing market interest and renewed buyer activity. As seen in the recent chart movements, the price has begun forming higher lows and higher highs, a key structural sign of bullish strength. The presence of good volume further validates the ongoing buying pressure, making this setup appealing to short-term traders and swing investors.
FUNToken, designed for the online gaming and gambling ecosystem, is gaining traction due to the increasing adoption of decentralized applications in these sectors. As regulatory clarity improves and user interest rises, utility-based tokens like FUN often see renewed demand. The project’s low market cap and strong community engagement create a favorable environment for speculative rallies, particularly during altcoin market uptrends.
With expectations of a 20% to 30% gain, FUNUSDT offers a moderate yet promising short-term opportunity. The bullish wave pattern suggests room for continued price expansion, especially if key resistance levels are broken with momentum. Traders should keep an eye on breakout confirmations and ensure risk is managed effectively, as low-cap tokens often experience higher volatility.
✅ Show your support by hitting the like button and
✅ Leaving a comment below! (What is You opinion about this Coin)
Your feedback and engagement keep me inspired to share more insightful market analysis with you!

Altcoins Bull Market Confirmed —Fun TokenEvery time there is a strong rise immediately what follows is a correction, always, unless of course you are in a bull market. Here you have the most revealing signal of all: Price stability after a major rise, sideways rather than bearish.
Fun Token (FUNUSDT) produced a more than 340% bullish wave. What happens right after the peak? If you guessed a drop I don't blame you, that is what normally happens but here things are different. Since the market is growing and set to grow strong for long, after this major rise instead of a crash we have consolidation, sideways. This reveals that participants are not selling, they are not selling because they know the rise is not over, there will be additional growth.
Go back in time and look at 30-50 altcoins and see what happens after each strong bullish wave, a correction. Now, do the same but focus on a bull market; what happens after a strong bullish wave? Some consolidation followed by additional growth.
The altcoins bull market is already confirmed.
Thanks a lot for your continued support.
Namaste.

Fun Token: March 2026 New All-Time High? It Will Be FunA very strong bullish signal is present on this chart and we have some interesting price dynamics as well and a time-fractal to consider.
Good evening my fellow Cryptocurrency trader, how are you feeling today?
There was a very strong market flush recently with FUNUSDT (Fun Token), removing all LONGs and all SHORTs between December 2024 and April 2025.
After December, there was a crash producing a major low. The lowest prices in 5 years, since March 2020. Then immediately there was a strong rise producing the highest prices since December 2023. Then a retrace and the action goes back to baseline.
The multiple years long low removes all LONGs. The more than a year strong high removes all SHORTs. A full market flush.
The very strong bullish signal is related to the low point from June 2023. As the present retrace ends, the action is back above this level and this is super-bullish.
From March 2020 through late March 2021 we have 55 candles and 385 days. The same would give us a date of 30 March 2026 for the new ATH. That is if FUNUSDT grows in exactly the same way. This is just an entertaining exercise. This bull market can last 221 days, 180 days, 360 days... Anything goes. It can last 465 days for all I know, but, if the same pattern repeats, we have an entire year to see the market grow.
The exact date? The exact high? Anything goes.
What cannot be doubted is the fact that the Cryptocurrency market is set to produce the strongest growth period since 2021. It will be FUN.
Namaste.

FUN/USDT – Triangle Formation Close to Breakout Point
Pair: FUN/USDT
Timeframe: 1H
Pattern: Symmetrical Triangle
FUN is consolidating inside a symmetrical triangle, but recent candles show pressure on the lower trendline. Price is hovering around 0.0070 and just tested the ascending support. This structure usually leads to a breakout — but the direction will depend on how price reacts in the next few candles.
**Bearish Bias:**
If the price breaks and closes below the triangle with volume, we may see a quick move toward the 0.0045–0.0050 support zone. Sellers are trying to push it out of consolidation.
**Bullish Scenario:**
To shift bullish, FUN must reclaim the 0.0075 level and break above the triangle resistance. Only then a trend reversal or new rally can begin.
No confirmed breakout yet — stay patient and let the move confirm itself.

FUNUSDT Forming Bullish BreakoutFUNUSDT is currently showing a bullish breakout from a long-term descending channel, indicating a potential reversal and strong upside momentum building. After a prolonged downtrend within the falling structure, the price has now breached resistance with notable volume support, signaling that buyers are beginning to regain control. This technical breakout, combined with fresh investor interest, adds significant weight to a potential bullish continuation move in the coming days and weeks.
The pattern visible here is suggestive of a classic trend reversal. With volume expanding and momentum indicators turning bullish, the setup implies a strong recovery is underway. Historical data shows that when FUNUSDT breaks out of such structures, it often leads to parabolic price movements. The chart projects a target gain of around 140% to 150%, with intermediate resistance levels offering multiple potential entries and take-profit zones. The initial breakout is already attracting attention from both retail and institutional traders.
On the fundamental side, FunFair continues to be a recognized name in the blockchain gaming and decentralized gambling space. Its legacy presence, combined with renewed volume interest and community activity, is contributing to the renewed investor enthusiasm. Additionally, the project is increasingly being mentioned across various trading forums and crypto communities, further amplifying the probability of a continued upward trend.
Overall, FUNUSDT is one of the more exciting low-cap altcoins currently in a technical sweet spot. With the breakout confirmed and bullish targets ahead, this could be a great opportunity for traders looking to capitalize on early-stage momentum before wider market recognition kicks in.
✅ Show your support by hitting the like button and
✅ Leaving a comment below! (What is You opinion about this Coin)
Your feedback and engagement keep me inspired to share more insightful market analysis with you!
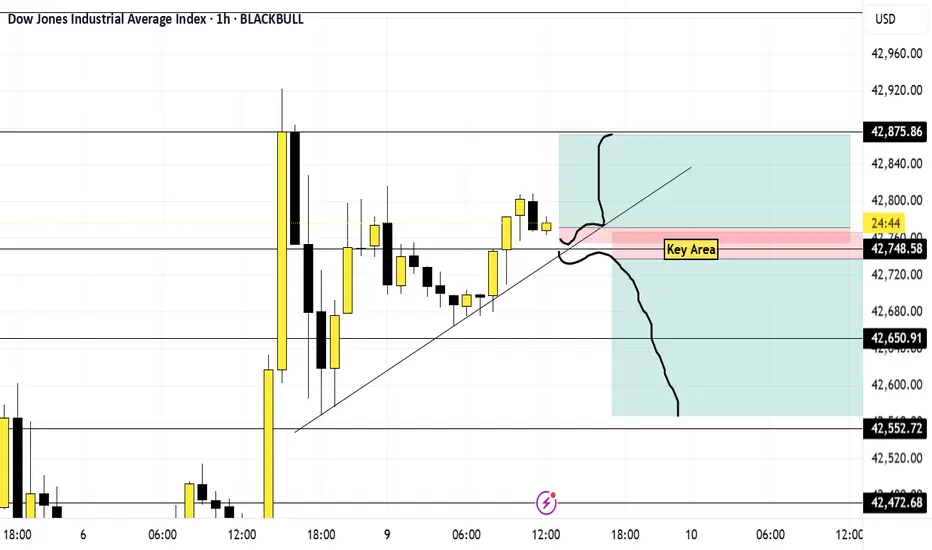
US30 JUNE 9Happy Mondays! Why are libraries so tall? Because they have many stories, like you will once you lock in on trading.
Now we can only do three things when it comes to trading Buy, Sell or nothing.
Price is moving up right now. If price breaks and retests my trend line and key area then I'm going to sell. However, if price rejects those same areas and starts to create higher highs and lows then I'll buy it.
If price decides to act like that one friend who got too high and decides to go nowhere then I shall do nothing and wait. That it that all.
Have fun and enjoy the process
FUNUSDT Forming Falling WedgeFUNUSDT is currently forming a classic falling wedge pattern, which is widely recognized in technical analysis as a bullish reversal signal. As the price continues to compress within the wedge while holding higher volume on green candles, it suggests growing accumulation by investors. A breakout from this pattern could signal a significant price reversal, with an anticipated gain of 140% to 150%+ based on historical wedge breakout projections. The setup is becoming increasingly favorable for swing traders and mid-term holders.
FUNToken is drawing renewed investor attention due to its integration in blockchain gaming and online entertainment sectors. As demand for decentralized platforms and provably fair gaming continues to grow, FUNToken offers a well-positioned use case. The token has a history of sharp rallies following prolonged consolidation, and the current chart formation indicates that another major move may be imminent. Moreover, sentiment across social and community platforms around FUNToken is turning positive, boosting its speculative momentum.
The technical structure of the chart aligns with increasing trading volume and consistent support holding at key levels, signaling strong underlying demand. The falling wedge is narrowing, suggesting a potential imminent breakout. Once the upper resistance of the wedge is breached with strong volume, price could accelerate rapidly toward upper Fibonacci extension levels, aligning well with the projected 140% to 150% upside potential.
Given these factors, FUNUSDT stands out as a promising opportunity in the altcoin market. Traders and investors watching for strong technical breakouts with real use-case utility will likely find FUN appealing at current levels. Keep an eye on volume spikes and confirmation closes above the wedge for potential entry points.
✅ Show your support by hitting the like button and
✅ Leaving a comment below! (What is You opinion about this Coin)
Your feedback and engagement keep me inspired to share more insightful market analysis with you!

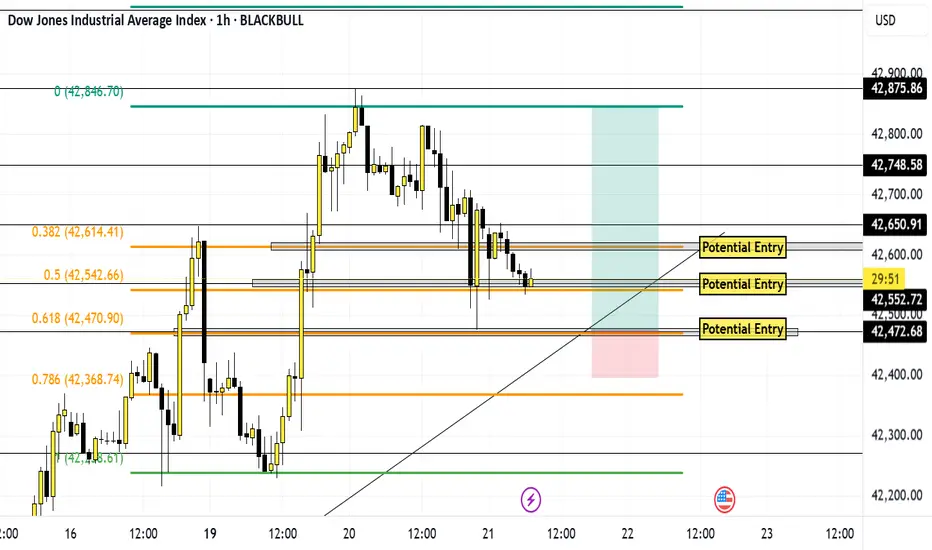
US30 May 21 If athletes get athlete's foot, what do elves get? Mistle-toes.
Now let's get to it. Before heading into the trade, I am definitely bullish. Price seems to be making a retracement before it pushes back up. I have given myself 3 potential entry points. But I am only going to enter them if:
Price makes market structure
Price breaks and retests through a key level/ entry point
If it bounces off of the trend line
Or a break of structure
And all of this, for me has to happen around 12pm est because I like to trade the afternoon session. But like a stallion price is going to do whatever it wants.
Stay safe and be patient
US30 Breakdown May 19thWhy shouldn't you write with a broken pen? Because it's pointless. Just like your life if you don't stay focused on your purpose. Ok let's get to work!
Price is on a beautiful uptrend and right now it's on a retracement down to 42650 area. I believe price will continue to push up to the 42870 Level.
How I'll enter
I am going to wait for price to get down to the 42650 level
Wait for a break of structure as confirmation for a buy (on a 1min)
Then Buy
But like my ex, price does whatever it wants, so be careful and always wait for a break and retest or a break of structure near the key areas.
Have fun. And trade responsibly

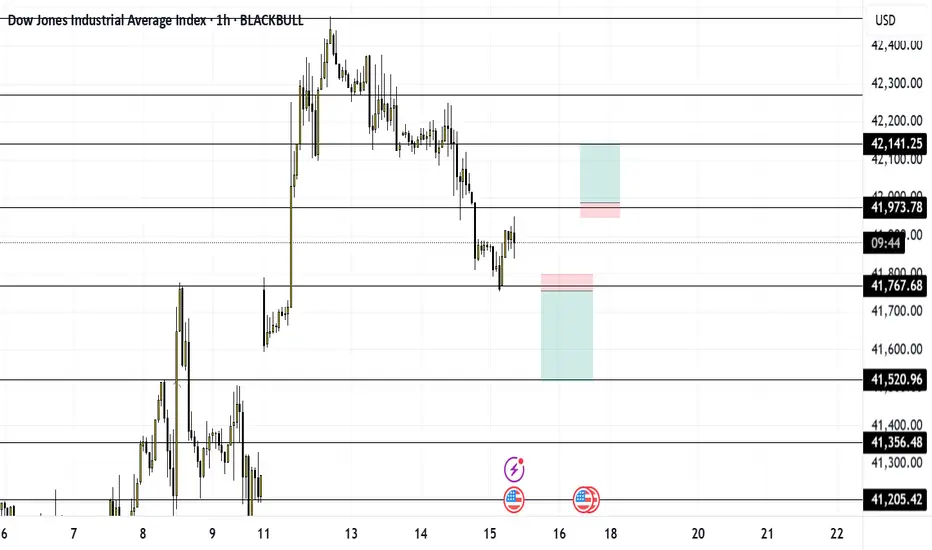
US30 MAY 15What kind of birds stick together? Velcrows! And we shall stick together as we conquer this market. Today price is stuck between 2 key areas (41,973 and 41797).
I am going to wait for price to break and retest one of those areas before I get into a buy or sell respectfully. on the 1m timeframe.
And I'm trading level to level. If it goes for the sell, it is evident that price will try to fill in the price gap that it left behind and few days ago. 41,527 level
And if price decides that it wants to go for the buy, I'll buy up to the next level where price last stopped on the hourly, 42,139 level.
But, like a 21-year-old girl, 5 shots in off of Tequilla, price will do whatever it wants, so trade responsibly. And have fun!!!
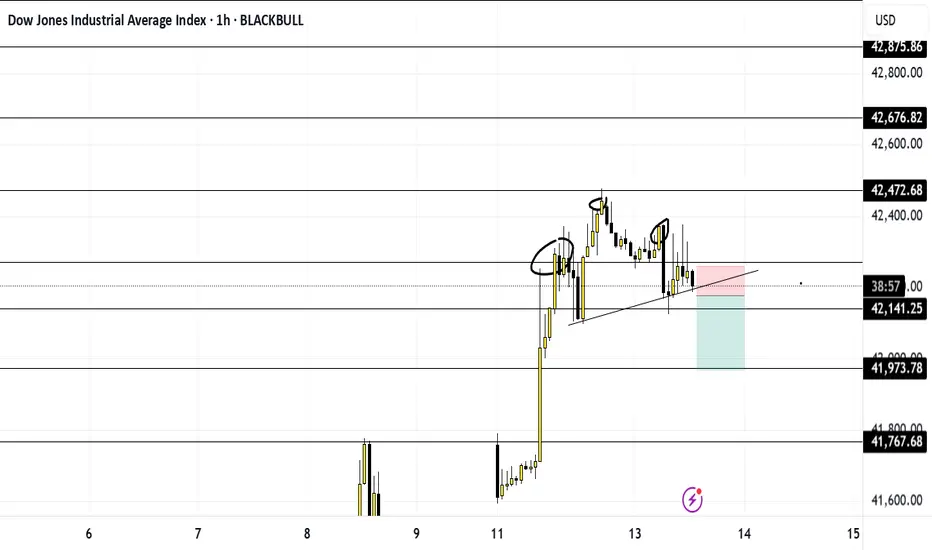
US30 AFTERNOON SESSION MAY 13Damn!! Why price acting up for? Lol let's handle it.
Price, after a very heavy push up seems as if its starting to fall off bit. Its making a head & shoulders pattern and its starting to sell. When price breaks and retests the neckline I'm going to get in for the sell and sell it down to 41970. Trade responsibly and have fun.
FUN Testing Red Resistance – Breakout Potential! 🚀 FUN Testing Red Resistance – Breakout Potential! 📈
FUN is currently testing the red resistance zone. If the price breaks through, the first target could be the green line level! 📊
Let’s catch this breakout together! 💼💸

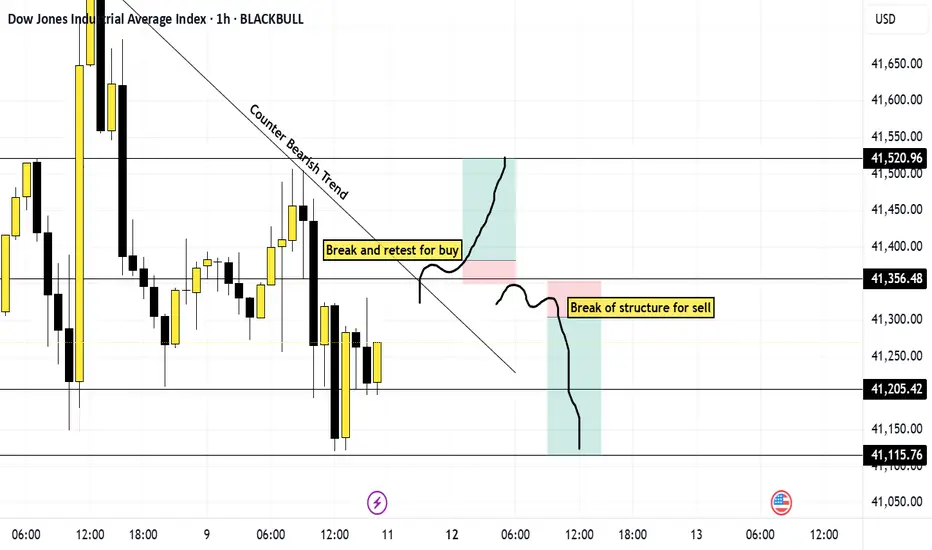
US30 Breakdown May 11thWhy don't skeletons fight each other? Cuz they ain't got guts, like you if you keep making excuses. Ok let's get to work.
Price has been steadily moving upwards this past month. Right now, there seems to be a counter bearish trend, so I plan to react to the market when it gets to my key level 41,353. If price breaks and retests that level on the 1 minute, and for extra confirmation the counter trendline, I will buy it to 41,500.
If price gets to that 41,353 level and decides to break structure and trend down, then I will sell it to 41,100 level.
But like my ex, price does whatever it wants, and it could buy earlier or sell earlier then I've predicted. So, when price gets around one of my key areas (any of the horizontal lines) and decides to start making higher highs and higher lows or breaks and retest it then I'll buy. And If price decides to start making lower highs and lower lows at my key area then I'll sell it.
Have Fun with trading. Keep smiling and I promise if you look at it with positivity you will always win
FUNUSDT(FUNToken) Updated till 05-04-25FUNUSDT(FUNToken) Daily timeframe range. while other alts going banana this thing doing pretty well till now. continuous push till 0.010245 which is local resistance. if it can have a confirm close above 0.006676 it will retrace back to 0.010245.

FUNUSDT: 120% Daily Volume Surge – A Bullish Breakout Brewing?FUNUSDT Analysis
Big Volume, Big Opportunity – Watch for the Break
"FUNUSDT shows a solid 120% daily volume increase – this is the kind of move that gets attention. Opportunities like this? You can’t ignore them."
Here’s the Plan:
Blue Box Zone: If we see the bullish breakout on the chart, I’m ready to go long from around the blue box. These levels are far from bad – they’re where winners trade.
Confirmation is Key: Wait for the breakout to signal strength. As always, use CDV, volume profile, and other data to ensure the trade has the support it needs.
Key Observations:
"The blue box is carefully chosen using volume footprint, CDV, and liquidity heatmap. Look for upward market structure breaks in lower time frames to confirm your entry."
This could be the start of something big for HIVEUSDT. Play it smart, trade it strong. 🚀
Let me tell you, this is something special. These insights, these setups—they’re not just good; they’re game-changers. I've spent years refining my approach, and the results speak for themselves. People are always asking, "How do you spot these opportunities?" It’s simple: experience, clarity, and a focus on high-probability moves.
Want to know how I use heatmaps, cumulative volume delta, and volume footprint techniques to find demand zones with precision? I’m happy to share—just send me a message. No cost, no catch. I believe in helping people make smarter decisions.
Here are some of my recent analyses. Each one highlights key opportunities:
🚀 RENDERUSDT: Strategic Support Zones at the Blue Boxes +%45 Reaction
🎯 PUNDIXUSDT: Huge Opportunity | 250% Volume Spike - %60 Reaction Sniper Entry
🌐 CryptoMarkets TOTAL2: Support Zone
🚀 GMTUSDT: %35 FAST REJECTION FROM THE RED BOX
🎯 ZENUSDT.P: Patience & Profitability | %230 Reaction from the Sniper Entry
🎯 DEXEUSDT %180 Reaction with %9 Stop
🐶 DOGEUSDT.P: Next Move
🎨 RENDERUSDT.P: Opportunity of the Month
💎 ETHUSDT.P: Where to Retrace
🟢 BNBUSDT.P: Potential Surge
📊 BTC Dominance: Reaction Zone
🌊 WAVESUSDT.P: Demand Zone Potential
🟣 UNIUSDT.P: Long-Term Trade
🔵 XRPUSDT.P: Entry Zones
🔗 LINKUSDT.P: Follow The River
📈 BTCUSDT.P: Two Key Demand Zones
🟩 POLUSDT: Bullish Momentum
🌟 PENDLEUSDT.P: Where Opportunity Meets Precision
🔥 BTCUSDT.P: Liquidation of Highly Leveraged Longs
🌊 SOLUSDT.P: SOL's Dip - Your Opportunity
🐸 1000PEPEUSDT.P: Prime Bounce Zone Unlocked
🚀 ETHUSDT.P: Set to Explode - Don't Miss This Game Changer
🤖 IQUSDT: Smart Plan
⚡️ PONDUSDT: A Trade Not Taken Is Better Than a Losing One
💼 STMXUSDT: 2 Buying Areas
🐢 TURBOUSDT: Buy Zones and Buyer Presence
🌍 ICPUSDT.P: Massive Upside Potential | Check the Trade Update For Seeing Results
🟠 IDEXUSDT: Spot Buy Area | %26 Profit if You Trade with MSB
📌 USUALUSDT: Buyers Are Active + %70 Profit in Total
🌟 FORTHUSDT: Sniper Entry +%26 Reaction
🐳 QKCUSDT: Sniper Entry +%57 Reaction
📊 BTC.D: Retest of Key Area Highly Likely
This list? It’s just a small piece of what I’ve been working on. There’s so much more. Go check my profile, see the results for yourself. My goal is simple: provide value and help you win. If you’ve got questions, I’ve got answers. Let’s get to work!

$FUN stops here; bearish expanding triangleTake a look. Will try to short this. Can even make a case for head and shoulders forming as well but for patterns sake there is a bearish expanding triangle here.
WSL.

Continued shopping in the new weekBefore the start of the new week, let's look at the market position and the prospects for a new weekly candle. After an aggressive continuation of sales within the framework of the annual pullback, as expected, ether is attempting a reversal, the purpose of which is to retest 4000 at least and likely consolidate higher. Today and tomorrow, there is still a possibility of a new sales impulse at 3150-250 with continued growth from the second bottom. Aggressive rebounds can be expected from 3750 and 4000 due to the low opening of the week and the continued likelihood of a transition to stable sales from the 4000 retest. The coming statistics and dynamics of the foreign exchange market will have a great impact.
Against the background of the attempted reversal on the air, individual alts also made similar reversals. AST and VIB showed good growth waves. The AST has weaker signals for a move, and therefore a new wave of growth can be expected in the new week after the shadow is drawn on a new weekly candle with a retest of the current loyalties. This month, there remains an opportunity to test the range of 0.15-25 when ether returns to a bullish trend in the coming week.
According to VIB, the signals for the move are much stronger, as well as it is in a more oversold position on large timeframes, and therefore growth may continue in a row with a test of 0.125-150 today or tomorrow. This is also facilitated by maintaining top growth in binance, which provides a good inflow of liquidity. With a successful breakdown of 0.125-35, the probability of a test of the range of 0.12-15 remains with stable ether.
VITE also remains interesting, which has not yet shown an attempt to reverse the weekly candle, and therefore a wave of growth is likely today. However, coins were added to circulation at the end of last week, which is highly likely to lead to a rebound from 0.0175-900 and an attempt to move from a repeated retest of loyalties.
Also, good growth waves in the new week can be shown by coins located at strong supports OG ALPACA PIVX VIDT BIFI UFT FIRO CREAM WING AMB PDA.
There is a rather negative trend for TROY, we have not seen a break since the third wave, and therefore there is a high probability of a rollback to 0.0025-35 in the new week. Price retention is possible only if yesterday's daily candle breaks today.

#FUN/USDT Ready to go higher#FUN
The price is moving in a descending channel on the 1-hour frame and sticking to it well
We have a bounce from the lower limit of the descending channel, this support is at a price of .005113
We have a downtrend on the RSI indicator that is about to be broken, which supports the rise
We have a trend to stabilize above the moving average 100
Entry price 0.005590
First target 0.006100
Second target 0.006663
Third target 0.007416

Solve a WEEKLY PUZZLE :)See the screenshot below.
Imagine this is the only data you have and only timeframe.
What will happen in the nearest future?
Price will go up to green, stays in the grey range, or down to red?
Answer in the comments with your arguments, and later I'll publish a video breakdown.

NOOT: $0.0000 0000 55 | another Kind of Memelow cost
few holders
regulated supply
decent price action
NOT YET viral
only few holders
soon it shall be dazzling


Solution to a WEEKLY PUZZLE :)I appreciate your interest, please comment and support the puzzle section so I continue to post them in the future.
