GOLD Weekly Open Analysis:Gap Down Sparks Fresh Bearish Momentum🟠 GOLD (XAU/USD) – Weekly Open Analysis: Gap Down Sparks Fresh Bearish Momentum
Gold opens the week with a sharp gap-down, reflecting a cooling of global tensions and softer tones in tariff negotiations over the weekend. With both geopolitical risks and trade conflicts showing signs of de-escalation, investors quickly shifted away from safe-haven demand, leading to immediate downside pressure in early Asia hours.
🔍 Market Context:
The price action remains within a bearish parallel channel on the M30 timeframe.
A visible GAP ZONE has formed between $3326 – $3328, which now acts as a key resistance area to watch for a potential retest.
This week brings critical US economic data including CPI, PPI, and a Fed speech, all of which could drive large volatility.
The market is likely to remain extremely sensitive to any shifts in:
US inflation expectations
FED forward guidance
Further headlines on tariffs or geopolitical escalations (Russia–Ukraine, India–Pakistan)
🔧 Trading Strategy for Today (13/05/2025):
Bias: Short-term bearish unless clear reversal signs appear.
Primary focus: Sell the rally, especially near key resistance zones.
🔺 Key Resistance Levels:
$3288
$3308
$3326–$3328 (Gap Fill Zone)
🔻 Key Support Levels:
$3262
$3246
$3236
$3200
🎯 Trade Ideas:
🔵 BUY ZONE:
Entry: $3246 – $3244
SL: $3240
TPs: $3250 → $3254 → $3258 → $3262 → $3266 → $3270 → $3280
Valid only if buyers show strong defense at key support zones.
🔴 SELL ZONE (Main):
Entry: $3326 – $3328
SL: $3332
TPs: $3322 → $3318 → $3314 → $3310 → $3305 → $3300
🔴 SELL SCALP (Early Intraday):
Entry: $3306 – $3308
SL: $3312
TPs: $3300 → $3296 → $3290 → $3286 → $3282 → $3278 → $3270
⚠️ Key Reminders:
Volatility is expected to remain high throughout the week due to macro events and shifting risk sentiment.
Trade with discipline — stick to your TP/SL and avoid emotional entries.
Wait for confirmation at your planned levels. Let the market come to you.
📣 Final Note:
This week is packed with catalysts. Patience and precision will define successful trades. Follow this account for real-time updates as the market reacts to US CPI and Fed commentary.
Fundamental-analysis

Fundamental Market Analysis for May 12, 2025 EURUSDEUR/USD is retreating from the gains made in the previous session, trading near 1.12400 in Monday's Asian session. The Euro (EUR) has been under pressure since European Central Bank (ECB) official Olli Rehn said last week that the ECB may consider cutting interest rates at its next meeting, provided that upcoming forecasts confirm a continued trend of disinflation and slowing economic growth.
Despite this, EUR/USD found some support thanks to optimism surrounding the trade talks between the US and China that took place in Geneva. Both sides reported “substantial progress” after two days of talks aimed at de-escalating the ongoing trade dispute. Chinese Vice Premier He Lifeng called the talks an “important first step” in stabilizing bilateral relations, while U.S. Treasury Secretary Scott Bessent echoed his sentiment, noting significant progress.
Markets are now awaiting Washington's response to the European Commission's proposed countermeasures against U.S. tariffs. On Thursday, the Commission launched a public consultation that outlined potential tariffs on up to 95 billion euros worth of imports from the U.S. if trade talks break down.
Meanwhile, the U.S. economic outlook remains uncertain. Federal Reserve (Fed) officials have noted the risk of stagflation, and Fed Chairman Michael Barr has warned that higher tariffs could disrupt supply chains, leading to higher inflation, lower growth and higher unemployment. Investors remain cautious as further escalation of trade tensions could pose serious problems for the US economy.
Trading recommendation: BUY 1.12300, SL 1.11900, TP 1.13000

Gold Friday Volatility – Liquidity SweepsGold Friday Volatility – Liquidity Sweeps & Potential Channel Break Ahead
Gold kicked off Friday with intense volatility, triggering sweeping liquidity grabs during the Asian session. Price dropped aggressively into the 327x region, clearing stop zones and vacuuming liquidity — only to quickly rebound and fill the imbalance above.
This classic FVG (Fair Value Gap) behavior was especially visible on the M30 timeframe, as price repeatedly left behind inefficient zones and promptly returned to fill them. Volatility remains elevated — and traders should proceed with caution.
📉 Technical Context – End of the Downtrend?
Since Thursday, gold has been trading in a clean descending parallel channel, respecting lower highs and pushing downward. However, late in the Asian session today, a bullish momentum surge appears to be testing the upper boundary of this channel.
We are now watching the 3324 level very closely.
A confirmed breakout above this zone — with candle closure outside the trendline — would suggest a structure shift and open the door for BUY setups on the retest.
Until then, we observe. Let price confirm. We trade the reaction, not the assumption.
🌍 Macro Risk – Trade Tensions & Weekend Volatility
The market remains extremely reactive to:
Geopolitical risks: Military tensions are still simmering.
US–China tariff discussions: President Trump is expected to make remarks on tariff policy.
Any surprise here could heavily impact USD and gold.
⚠️ Liquidity sweeps are common on Fridays — especially into London and NY sessions — so risk management is critical today.
📌 Key Technical Levels to Watch
🔺 Resistance:
3345 → 3364 → 3395
🔻 Support:
3280 → 3270 → 3256 → 3244 → 3225
The 3324 and 3366 zones are particularly critical.
If price closes firmly above these zones, bullish continuation becomes more likely.
If price gets rejected, we stay within range and look for sell opportunities.
🎯 Trade Plan – Friday, May 10
🟢 BUY ZONE
Entry: 3280 – 3278
SL: 3274
TPs: 3285 → 3290 → 3295 → 3300 → 3305 → 3310 → 3320
🔴 SELL ZONE
Entry: 3364 – 3366
SL: 3370
TPs: 3360 → 3356 → 3352 → 3348 → 3344 → 3340 → 3330
🧠 Final Thoughts:
Friday often delivers unexpected liquidity traps.
With news expected from the White House and technical structure on the verge of a break, this session could offer both risk and reward — if approached with discipline.
✅ Use clear levels.
✅ Respect TP/SL.
✅ Stay sharp as NY volume enters.
📣 Let’s end the week strong. Drop your charts and ideas below!

Fundamental Market Analysis for May 9, 2025 USDJPYUSDJPY:
The Japanese yen (JPY) rises against its US counterpart during the Asian session on Thursday and reverses part of the previous day's correction from a one-week high. Minutes from the Bank of Japan's (BoJ) March meeting showed that the central bank remains open to further tightening if the economic and price outlook persists. This, along with a rebound in safe-haven demand, is lending support to the Japanese Yen, which, along with the emergence of fresh US Dollar (USD) selling, is keeping the USD/JPY pair below the 144.00 round figure.
Optimism over the start of trade talks between the US and China, which will take place this week in Switzerland, is fading rather quickly amid uncertainty over how a new deal between the world's two largest economies might be structured. In addition, US President Donald Trump has denied that he will reduce tariffs against China, dampening hopes of a speedy resolution to the trade war between the world's two largest economies. In addition, persistent geopolitical risks kept investors on edge and proved to be the key factor that influenced the yen's growth amid the general weakening of the dollar.
Trading recommendation: SELL 145.80, SL 146.00, TP 144.90

XAU/USD - Fed warns of Economic UncertaintyThe XAU/USD pair on the M30 timeframe presents a Potential Buying Opportunity due to a recent Formation of a Bullish Flag Pattern. This suggests a shift in momentum towards the upside and a higher likelihood of further advances in the coming hours.
Possible Long Trade:
Entry: Consider Entering A Long Position around Trendline Of The Pattern.
Target Levels:
1st Resistance – 3473
2nd Resistance – 3519
🎁 Please hit the like button and
🎁 Leave a comment to support for My Post !
Your likes and comments are incredibly motivating and will encourage me to share more analysis with you.
Best Regards, KABHI_TA_TRADING
Thank you.

Fundamental Market Analysis for May 8, 2025 GBPUSDEvents to pay attention today:
15:30 EET. USD - Number of Initial Jobless Claims
14:00 EET. USD - Bank of England Key Interest Rate Decision
GBPUSD:
GBP/USD was down six-tenths of a per cent on Wednesday as markets continued to hold on to the safe-haven US dollar. The Federal Reserve (Fed) left rates unchanged as markets had expected, but Fed policymakers, still adopting a wait-and-see stance, curbed risk appetite during the midweek market session. The Bank of England (BoE) will hold its own rate meeting on Thursday and is expected to cut rates by another quarter point.
Forex Today: All eyes on the Bank of England
Market sentiment declined after Fed Chairman Jerome Powell's press conference. He said that US trade tariffs could hamper the Fed's inflation and employment targets this year. Powell warned that continued policy instability could force the Fed to take a ‘wait-and-see’ approach to interest rates. While the Trump administration's tariffs have weighed heavily on consumer and business sentiment, the lack of significant negative economic data makes it difficult for the Fed to justify an immediate change in interest rates.
Powell: The right thing to do is to wait for further clarity
The Bank of England is expected to cut the rate by a further quarter point at its upcoming meeting on Thursday, marking the fourth rate cut since it peaked in 2023. The Bank of England's Monetary Policy Committee (MPC) is expected to vote nine to one in favour of another rate cut in an attempt to support the faltering UK economy.
Trading recommendation: SELL 1.3330, SL 1.3350, TP 1.3230

Gold Ahead of FOMC – China Rate Cut Shocks Market as USD Surges⚠️ Gold Ahead of FOMC – China Rate Cut Shocks Market as USD Surges
Gold (XAU/USD) is facing a pivotal moment after a dramatic correction from $3,435 down to the 3,360s, triggered by a combination of surprising policy moves and rising macro uncertainty.
🧭 Macro Recap: Why Did Gold Drop?
🇨🇳 China unexpectedly cut interest rates by 10 basis points ahead of a key trade dialogue with the US.
➤ This supports global liquidity sentiment but simultaneously strengthens the USD in the short term.
💵 DXY surged, taking advantage of China's rate cut — adding pressure to gold.
⚠️ Geopolitical tensions in South Asia (India–Pakistan) resurfaced but failed to lift gold.
➤ This hints that the current correction is more dollar-driven than risk-off in nature.
🏛️ All eyes now shift to FOMC later today, where Fed policy will dictate gold’s next major move.
Will Powell surprise markets with dovish signals, or does this China cut hint at coordinated central bank play before a wider easing cycle?
📊 Technical Outlook – Gold in Volatile Expansion
Despite the macro volatility, gold continues to respect key liquidity zones and high-volume clusters on the chart. However, momentum is broad and inconsistent — requiring traders to react to confirmed breaks, not early assumptions.
🔺 Resistance Levels:
3390 → 3402 → 3416 → 3425 → 3432 → 3444 → 3468
🔻 Support Levels:
3365 → 3356 → 3332 → 3314
🎯 Trade Strategy – 7 May 2025 (FOMC Day)
🟢 BUY SCALP
Entry: 3355
SL: 3350
TPs: 3360 → 3364 → 3368 → 3372 → 3376 → 3380
🟢 BUY ZONE (Mid-Term Opportunity)
Entry: 3332 – 3330
SL: 3326
TPs: 3336 → 3340 → 3344 → 3348 → 3352 → 3358 → 3365
⚠️ Key BUY Level: 3314 – 3312
This is a critical level for bulls — aligned with 0.5 FIBO retracement and previous demand flip zone. However, a move here could invalidate structure and signal deeper bearish pressure. Use caution.
🔴 SELL SCALP
Entry: 3430 – 3432
SL: 3436
TPs: 3425 → 3420 → 3415 → 3410 → 3400
🔴 SELL ZONE (High-Risk Short)
Entry: 3468 – 3470
SL: 3474
TPs: 3464 → 3460 → 3455 → 3450 → 3445 → 3440 → 3430
🧠 Final Thoughts:
Gold remains range-bound but extremely reactive to macro news.
Today’s FOMC meeting could be a game changer. Whether the Fed maintains its current stance or signals dovish pivot will determine the direction for the rest of the week.
🎯 In times like this, it’s not about picking tops or bottoms — it’s about trading the reaction and protecting your capital.
✅ Stick to SL.
✅ Let price confirm.
✅ Be prepared for high volatility spikes.
Good luck, traders — and stay sharp.

Fundamental Market Analysis for May 7, 2025 EURUSDEURUSD:
EUR/USD failed to hold on Tuesday, marking a new short-term consolidation range near the key 1.1300 mark as traders wait for a reason to move. The key event this week is the Federal Reserve (Fed) rate announcement in the middle of the week, which has pinned investor sentiment to the pole for now.
The Fed's upcoming rate decision on Wednesday remains the focus of markets this week. While many expect the Fed to maintain current rates, investors will be closely monitoring comments from policymakers, especially Fed Chairman Jerome Powell, for any signs that the shift to a rate-cutting cycle may occur sooner than expected.
Recently, the Fed has been facing increasing pressure to lower interest rates. Market participants have consistently sought lower funding costs, and the Trump administration has been particularly vocal in insisting that the Fed must cut rates to ease the cost of servicing US debt. However, this stance runs counter to the Fed's dual mandate of promoting full employment and controlling price stability, which President Donald Trump does not appear to be taking into account.
Trading recommendation: BUY 1.1350, SL 1.1330, TP 1.1440

XAUUSD Bullish Continuation Setup (read-caption)📊 Chart Overview:
Asset: Unspecified (likely XAUUSD or a crypto asset).
Timeframe: Looks like 4H or Daily.
Tools Used:
EMA 50 (🔴 Red Line) — 3,283.978
EMA 200 (🔵 Blue Line) — 3,185.603
Resistance & Support Zones (🔴 Highlighted boxes)
Price: 3,335.415
🔍 Technical Analysis:
🟩 Trend Direction:
📈 Uptrend Confirmed: Price is above both EMA 50 and EMA 200 → Strong bullish momentum.
✅ Golden Cross: EMA 50 is above EMA 200, confirming long-term bullish bias.
📌 Key Levels:
🧱 Main Support Zone (🟥 Bottom Box - ~2,950–3,050):
Historical strong bounce zone.
Acts as a bullish base in case of a deeper pullback.
🔄 Mid Resistance/Support (~3,180–3,260):
Now acting as support after price bounced above it.
Also aligns with EMA 200 ➕🟦 – adds confluence.
📌 Main Resistance Zone (~3,300–3,380):
Current area of consolidation.
If broken, price likely to retest upper resistance.
🚧 Top Resistance Zone (~3,450–3,500):
Target area if bullish breakout continues.
✈️ Next take-profit zone for bulls.
🧭 Market Forecast:
🔁 Retest Expected: Price might pull back slightly to the main resistance area (~3,300), retesting previous resistance as support.
🚀 Upside Potential: Upon successful retest, price is projected to head toward the upper resistance (~3,480).
📉 Bearish Scenario: If price breaks back below 3,260 and EMA 50, expect a dip toward 3,180 or even the main support zone.
📈 Summary:
Bias: ✅ Bullish
Watch for:
🔍 Retest of 3,300 zone
✅ Breakout above 3,380
❌ Breakdown below 3,260 invalidates bullish scenario

NATRIUM | Investing | Why BILL GATES is Betting on NATRIUMBill Gates is betting big on Natrium - should you be, too?
Natrium is this next-generation nuclear reactor design that's attracting a lot of attention from people like Bill Gates and other major investors. What's particularly interesting about it is that it combines a fast reactor with a built-in molten salt "battery." Essentially, it can generate a steady output of power and then provide an extra boost during peak demand by drawing on its stored heat. This design aims for greater flexibility in meeting fluctuating electricity needs.
The technology is a joint development by TerraPower, the company co-founded by Bill Gates, and GE Hitachi. They're presenting it as a zero-carbon power source capable of reliably backing up intermittent renewables like wind and solar, ensuring a consistent supply of clean energy.
The excitement from investors like Bill Gates appears to be driven by the need to address climate change and secure reliable energy supplies. They view Natrium as a way to deliver large-scale, carbon-free power while potentially overcoming some of the limitations of older nuclear reactor designs. Gates has emphasized the enhanced safety features and potential for lower operating costs. Furthermore, Natrium's specific design to complement the intermittency of solar and wind, through its energy storage, is a significant draw for investors looking at future energy solutions. The substantial public and private investment, including government funding and bipartisan legislative support, also signals strong confidence in this technology.
The description of TerraPower as a "Bill Gates-backed" firm developing this multi-billion dollar demonstration plant highlights the high-profile nature of the project. The fact that corporate partners, such as the data center company exploring Natrium for their power needs, are also getting involved indicates a broader recognition of its potential beyond just government initiatives.
Compared to traditional nuclear reactors, Natrium offers some potential advantages. Its sodium coolant operates at near-atmospheric pressure, simplifying safety compared to the high-pressure water systems in older designs. This allows for natural heat dissipation in case of issues, reducing the risk of large steam explosions. Another key aspect is Natrium's potential for more efficient fuel utilization and reduced long-lived waste generation. The design aims for better fuel efficiency and a smaller volume of long-term radioactive waste compared to current light-water reactors.
Natrium's primary advantage over wind and solar is its dispatchability. Unlike the intermittent nature of renewables, Natrium can provide power consistently, 24/7. The integrated energy storage allows it to complement renewables by absorbing excess energy or releasing power during periods of low renewable output. This firm grid support is a significant benefit for utilities concerned about grid stability and the variability of renewable sources.
For utilities transitioning away from coal, Natrium offers a carbon-free, relatively direct replacement in terms of power output. It also has a smaller land footprint compared to large-scale wind or solar installations.
There are inherent challenges with a first-of-a-kind system like Natrium. The prototype is still under construction, lacking a proven operational track record. Construction and licensing processes could face delays and cost overruns. Critics also raise valid points about the actual safety and cost-effectiveness compared to projections. The use of sodium coolant, while offering safety advantages, also presents risks due to its reactivity with air and water, requiring robust containment systems. Regulatory scrutiny will undoubtedly be extensive.
And fuel supply is a critical uncertainty. Natrium requires high-assay, low-enriched uranium (HALEU), which is not currently widely available. Disruptions in the supply chain and limited existing production capacity pose a significant risk to the timely and cost-effective operation of Natrium plants.
Looking ahead, Natrium is being considered for deployment in regions needing reliable power to complement renewables and to power energy-intensive industries. The long-term vision involves integrating Natrium with renewable energy sources to create a more stable and decarbonized grid.
The speculative outlook for Natrium in the next 5-10 years is heavily dependent on the successful completion of the Wyoming demonstration plant. If it meets its targets, it could pave the way for wider adoption. However, the timeline is ambitious, and challenges related to fuel supply and regulatory approvals remain. A successful demonstration could trigger significant investment and adoption in the coming decades, positioning Natrium as a key player in the energy transition.
If you're interested in investing in companies involved with TerraPower's Natrium reactor, several publicly traded firms are integral to its development and supply chain:
🔧 Engineering & Construction
KBR Inc. | (NYSE: KBR)
KBR has formed a strategic alliance with TerraPower to commercialize and deploy Natrium reactors globally. The collaboration focuses on creating a replicable contracting framework to reduce financial risk and ensure cost transparency in deploying Natrium technology.
terrapower.com
⚛️ Nuclear Fuel & Components
BWX Technologies Inc. | (NYSE: BWXT)
BWXT has been awarded a contract by TerraPower to design the Intermediate Heat Exchanger for the Natrium demonstration project. This component is critical for transferring heat within the reactor system.
Centrus Energy Corp. | (NYSE American: LEU)
Centrus Energy is collaborating with TerraPower to establish domestic production capabilities for high-assay, low-enriched uranium (HALEU), which is essential for fueling the Natrium reactor.
⚙️ Manufacturing & Industrial Partners
Doosan Enerbility Co., Ltd. | 034020.KQ (KOSDAQ)
Doosan Enerbility is supplying critical components for the Natrium reactor, including the core barrel and internal supports.
HD Hyundai | 329180.KQ
HD Hyundai is manufacturing the reactor vessel for the Natrium project.
🌍 International Collaborators
SK Inc. | 034730.KQ
SK Inc., a South Korean conglomerate, has invested $250 million in TerraPower to support the demonstration and commercialization of the Natrium reactor.
Korea Hydro & Nuclear Power (KHNP) | 15760.KS (KOSPI)
KHNP has entered into a strategic collaboration with TerraPower to support the Natrium project, leveraging its expertise in nuclear power development.
OTHERS:
1. Mirion Technologies (NYSE: MIR)
Mirion is supplying the Radiation Monitoring System (RMS) and Nuclear Instrumentation System (XIS) for the Natrium Reactor Demonstration Project in Wyoming.
2. GE Vernova (NYSE: GEV)
Through its subsidiary, Global Nuclear Fuel–Americas (GNF-A), GE Vernova is partnering with TerraPower to establish the Natrium Fuel Facility in Wilmington, North Carolina. This facility aims to produce high-assay, low-enriched uranium (HALEU) fuel essential for the Natrium reactor.
3. NuScale Power Corporation (NYSE: SMR)
While not directly involved with the Natrium project, NuScale is a prominent developer of small modular reactors (SMRs), a category that includes Natrium. The company's advancements in SMR technology contribute to the broader nuclear energy landscape.
4. Southern Company (NYSE: SO)
Southern Company is collaborating with TerraPower on the development of a molten chloride fast reactor (MCFR), a separate advanced nuclear project. Their involvement in advanced nuclear technologies aligns with the innovations seen in the Natrium project.
________________________________
Sources: Recent industry reports and news articles and TerraPower press releases provide the data above. Also put together with the help of AI.
world-nuclear-news.org, ans.org, gatesnotes.com, scientificamerican.com, terrapower.com, reuters.com

EUR/GBP Wedge Breakout (06.05.2025)The EUR/GBP Pair on the M30 timeframe presents a Potential Selling Opportunity due to a recent Formation of a Wedge Breakout Pattern. This suggests a shift in momentum towards the downside in the coming hours.
Possible Short Trade:
Entry: Consider Entering A Short Position around Trendline Of The Pattern.
Target Levels:
1st Support – 0.8476
2nd Support – 0.8463
🎁 Please hit the like button and
🎁 Leave a comment to support for My Post !
Your likes and comments are incredibly motivating and will encourage me to share more analysis with you.
Best Regards, KABHI_TA_TRADING
Thank you.

Fundamental Market Analysis for May 6, 2025 USDJPYUSDJPY:
The Japanese Yen (JPY) declined against its US counterpart during Tuesday's Asian session, albeit without any follow-through selling. Despite the Bank of Japan's (BoJ) ‘restrained’ guidance last Thursday, Japan's rising inflation and prospects for continued wage increases leave the door open for further policy tightening by the central bank. In addition, uncertainty over US President Donald Trump's trade policy and rising geopolitical tensions continue to act as tailwinds for the safe-haven yen.
Meanwhile, the prospect of more aggressive rate cuts by the Federal Reserve (Fed) is not helping the US Dollar (USD) attract meaningful buyers and is helping to limit the upside for the USD/JPY pair. Traders also seem unwilling to wait for more signals on the Fed's policy outlook before positioning for the next leg of directional movement. Thus, the main focus will be on the outcome of the two-day FOMC meeting, which starts this Tuesday and which will give the dollar a fresh impetus.
Trading recommendation: BUY 143.90, SL 143.60, TP144.80

USD/CAD - Wedge Breakout (06.05.2025)The USD/CAD pair on the M30 timeframe presents a Potential Buying Opportunity due to a recent Formation of a Wedge Breakout Pattern. This suggests a shift in momentum towards the upside and a higher likelihood of further advances in the coming hours.
Possible Long Trade:
Entry: Consider Entering A Long Position around Trendline Of The Pattern.
Target Levels:
1st Resistance – 1.3893
2nd Resistance – 1.3928
🎁 Please hit the like button and
🎁 Leave a comment to support for My Post !
Your likes and comments are incredibly motivating and will encourage me to share more analysis with you.
Best Regards, KABHI_TA_TRADING
Thank you.

Silver – Bearish Move Toward Support🧠 Market Overview:
Instrument: Likely Silver (based on file name).
Chart Context: The price is currently trading below both the 50 EMA (red) and 200 EMA (blue), indicating bearish momentum and a possible shift in market structure.
📊 Key Technical Components:
🔹 Exponential Moving Averages (EMA):
50 EMA (32.614) is above the 200 EMA (32.526) but both are above the current price.
This crossover is recent and could indicate the beginning of a larger downtrend if confirmed by continued price action below both EMAs.
🔹 Market Structure:
POI (Point of Interest) marks a previous swing high where selling pressure emerged.
The chart shows internal liquidity (INT.LQ) sweeps both above and below consolidation areas, hinting at smart money manipulation to grab liquidity before making a move.
🔹 Resistance Zone:
Clearly defined between approx. 33.4–34.0, where price was rejected after a failed attempt to break higher.
Multiple rejections from this zone show strong selling pressure.
🔹 Support Zone:
Sitting between approx. 30.8–31.2.
Price previously consolidated here before a bullish move, making it a likely target for a return test or a potential bounce.
📉 Bearish Scenario & Projection:
The price broke below a short-term structure and failed to hold above EMAs.
The current price action shows a bearish pullback likely to form a Lower High (LH).
The projected path shows a pullback to previous support-turned-resistance, followed by a breakdown targeting the support zone.
✅ Bias:
Short-term bias: Bearish
Medium-term bias: Bearish, unless price reclaims the 200 EMA and consolidates above the resistance zone.
🔍 Confluences Supporting Bearish Outlook:
Price below EMAs (dynamic resistance).
Failed higher highs with liquidity sweeps (indicating smart money selling).
Clear market structure shift to the downside.
Anticipated retest of support zone around 30.8–31.2.

Gold (XAU/USD) Analysis – Technical + Fundamental OutlookTechnical Outlook
Gold is currently trading inside a descending channel and has reached the midline, which is acting as dynamic resistance.
📍 Key Levels:
Resistance: 3310 – 3320 (aligned with the midline of the channel) – price has not yet confirmed a breakout above this zone
Next Bullish Targets: 3350 – 3358 / 3385 – 3390
Support Zone: 3270 – 3280 (potential bullish re-entry area)
🟣 All key price levels are marked on the chart with light purple lines for clarity.
🟠 RSI is near 65, showing bullish momentum but approaching overbought territory, signaling a possible short-term pullback.
🔁 Likely scenario: A minor correction toward 3270–3280 followed by continuation toward 3350+ if support holds.
Fundamental Context
The ISM Services PMI came in stronger than expected (51.6 vs. 50.2 forecast), reflecting economic resilience in the U.S. This typically supports the USD and weighs on gold, but:
Rising tariff threats from Trump raise recession concerns.
Services Prices Index rose to 65.1, signaling growing inflation pressures.
These inflation concerns may impact the Fed’s upcoming rate decisions.
Central bank demand and geopolitical risks continue to support gold medium-term.
Summary
Despite being inside a descending channel, gold is showing short-term bullish strength. A confirmed break above 3320 could open the way toward 3350+. Otherwise, a pullback to the 3270–3280 area may offer the next setup.

Fundamental Market Analysis for May 6, 2025 GBPUSDGBPUSD:
The GBP/USD pair started the new week on a subdued note and is fluctuating in a narrow trading range around 1.3260-1.3265, near the one-week low reached during the Asian session.
The US Dollar (USD) remains on the defensive below multi-week highs amid heightened economic uncertainty amid US President Donald Trump's tariff plans and is a key supportive factor for the GBP/USD pair. Furthermore, the prospect of more aggressive policy easing by the Federal Reserve (Fed) is further undermining the US Dollar.
Despite a better than expected US non-farm payrolls report on Friday, investors seem convinced that the US central bank will resume its rate-cutting cycle in June and reduce borrowing costs by 100 basis points by the end of this year. This, along with optimism about a potential de-escalation of the trade war between the US and China, is reducing demand for the safe-haven dollar.
However, traders seem reluctant to make new bullish bets on GBP/USD and prefer to wait for this week's key event - the Bank of England's (BoE) monetary policy meeting on Thursday. The UK central bank is expected to cut interest rates by 25bps and take a somewhat soft stance amid downside risks to growth from the trade war.
In addition, this week traders will face the publication of the FOMC meeting minutes, which will affect the USD price dynamics and give a meaningful impetus to the GBP/USD pair.
Trading recomendation: SELL 1.3280, SL 1.3290, TP 1.3180

Week ahead analysis May 4th to 11th**Week Ahead Analysis (May 5 – May 11, 2025)**
### **Baseline: Market Expectations**
- **Tariffs & Fed Policy:** Trump's tariff announcement has heightened concerns about economic slowing, prompting bond markets to price in up to four Federal Reserve rate cuts this year.
- **Trade Talks & Sentiment Shift:** Reports suggest China may restart trade negotiations, boosting risk sentiment. However, China insists the U.S. must first remove all unilateral tariffs, adding uncertainty to the discussions.
- **Market Reaction:** Risk assets—equities and high-beta currencies like AUD, NZD, and CAD—are climbing as volatility cools. Meanwhile, safe havens such as JPY, CHF, and gold are facing selling pressure, though overall risk sentiment remains cautious.
### **Potential Surprise Scenarios**
- **Trade Deal Secured:** A deal would likely send equities higher, strengthen risk-sensitive currencies, and drive safe havens lower.
- **No Deal Reached:** In contrast, safe havens could gain while risk assets retreat.
### **Big Picture Outlook**
Regardless of the immediate outcome, the market's medium-term trajectory hinges on the broader effects of trade policy. If tariffs persist, economic uncertainty may sustain the Fed’s dovish stance. A successful trade deal, however, could restore confidence, shifting expectations back toward growth stabili

TMG Holding Fundamental and Chart AnalysisTMG Holding trend has recently taken an upward trend between the support line 46.873 and the resistance line 54.511, up by 0.78%. It is expected to keep rising till breaking the 1st resistance line at 54.115 and then the 2nd one at 54.423 points because of positive fundamental analysis. On one hand, the CBE's decision about cutting the interest rate by 2.25% would lead to positive impact on corporates because of the current reasons behind the economic activity, decreasing interest rate will lead to a decrease in the cost of borrowing, which will decrease the cost of production and will increase the corporates' profit and their monetary value. Accordingly, this will lower the products' price and individuals will have a higher will to diversify their investments and increase their purchasing power. On the other hand, besides the current annual advertisements about SouthMed and the summer getting closer, there is news on Reuters about an advanced stage of negotiations for a new large-scale mixed-use project in Iraq. This project is estimated to generate total sales vicinity of $17 Billion and annual recurring income exceeding $1.5 Billion.

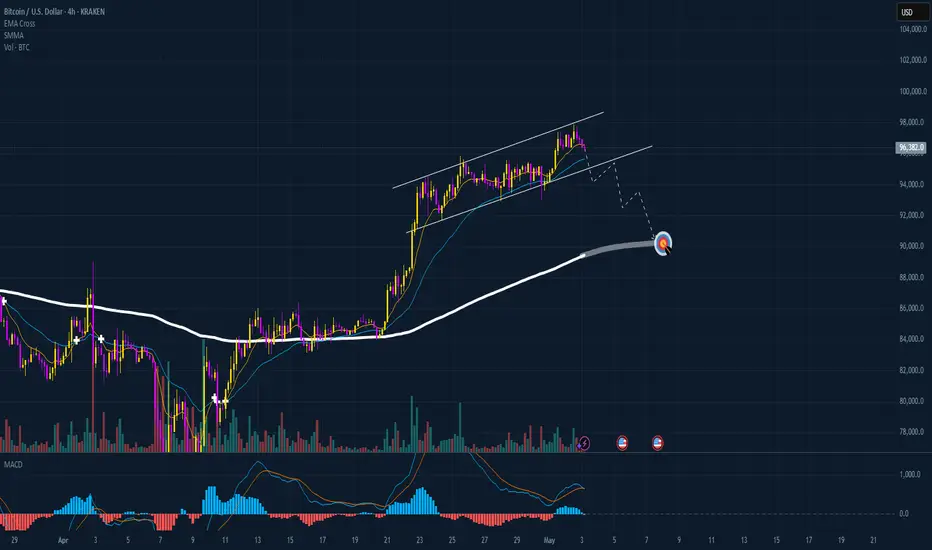
BTC HAVE A HIGH PROBABILITY TO FALL DOWN!!!The BTC starts looking weak and it's perfect time to long for a short. We are almost at the top of this run from last weeks and we can see that BTC made a perfect divergence pattern. My indicator shows me also that we are entering a mid-term bearish trend and there is a high chance that we are gonna fall much deeper than in last weeks. My target is clear and I'm holding my strategy so I wait for the price to hit my SMA line like it was in the last days but now I wait for the price to hit the SMA line at 4H chart because we didn't hit it since 2 weeks so in this moment we can see even in a few candles that the price is gonna touch it. I am actually in the short and waiting for the price to go for my target, we also have a weekend so the price will be probably slow but everything can happen. In my opinion next week are gonna be red and the price should touch my target. I recommend to watch a 1H and 2H chart and looking when price will hit the SMA line on these timeframes because my target is set in a 4H chart but we can book profits even when the price will hit the SMA at 1H and at 2H chart. Be careful and stay focused.
EUR/USD - Channel Breakout (02.05.2025) FX:EURUSD The EUR/USD pair on the M30 timeframe presents a Potential Buying Opportunity due to a recent Formation of a Breakout Pattern. This suggests a shift in momentum towards the upside and a higher likelihood of further advances in the coming hours.
Possible Long Trade:
Entry: Consider Entering A Long Position around Trendline Of The Pattern.
Target Levels:
1st Resistance – 1.1387
2nd Resistance – 1.1430
🎁 Please hit the like button and
🎁 Leave a comment to support for My Post !
Your likes and comments are incredibly motivating and will encourage me to share more analysis with you.
TVC:DXY
Best Regards, KABHI_TA_TRADING
Thank you.

CAD/JPY at Key Decision Zone: Breakout or Rejection?🕵️♂️ Chart Overview:
Instrument: CAD/JPY
Chart Type: Candlestick
Time Frame: Appears to be intraday (possibly 1H or 4H)
EMAs Used:
50 EMA (Red): 102.814
200 EMA (Blue): 102.710
📊 Key Zones Identified:
1. Immediate Zone (103.30 - 103.50)
Marked as: “Resistance + Support”
This is a key decision zone. Price has tested this region multiple times, showing it holds dual roles — a flip zone.
Price is currently testing this zone again. A break and retest above could confirm bullish momentum.
2. Upper Resistance Zone (104.80 - 105.50)
A broader supply area where previous strong selling pressure occurred.
This is the next logical target if price breaks and holds above 103.50.
3. Lower Support (101.29)
Strong horizontal support, clearly defined from previous lows.
If the price fails to break above the current zone, a rejection could lead to a move back down toward this support.
📈 Bullish Scenario:
Break above 103.50, with a successful retest confirming new support.
Momentum could carry price toward the 105.00–105.50 resistance.
Supported by 50 EMA crossing above 200 EMA (early sign of bullish crossover — Golden Cross).
📉 Bearish Scenario:
Rejection from the 103.30–103.50 zone could signal continuation of range-bound or bearish pressure.
Break below 102.00, followed by momentum towards 101.29 key support.
Would invalidate short-term bullish structure.
📌 Additional Technical Notes:
The chart shows consolidation between 102.00 and 103.50 — likely accumulation or re-accumulation phase.
EMAs are tightening, indicating a potential volatility expansion move is near.
Volume is not visible but would be useful to confirm breakout strength.
📍Conclusion:
CAD/JPY is currently at a critical decision zone. The next few candles will be key. Monitor:
Breakout direction
Retest confirmations
Momentum and volume indicators (if available)

Gold on Edge – Will NFP Trigger the Next Big Move?🚨 Gold at a Crossroads – Will NFP & White House Comments Trigger a Volatility Spike? ⚡
🧭 Macro Overview
Gold enters the US session with a mild rebound after a sharp selloff, following its historic climb to $3,500/oz. The recent drop was driven less by fundamentals and more by aggressive profit-taking, especially from retail flows in Asia, notably China.
Rather than a trend reversal, this correction looks like a healthy technical reset, just ahead of two major catalysts:
1️⃣ US Non-Farm Payrolls (May edition)
2️⃣ White House remarks on tariffs and trade strategy
These two factors will likely define gold’s direction heading into next week — either toward deeper support zones or a potential recovery rally into resistance.
📊 DXY & Macro Market Lens
The US Dollar Index (DXY) has bounced off its base near 98.xx, currently testing the 100.00 level. Whether the dollar strengthens further depends largely on today’s labour data and fiscal signals from Washington.
Traders should remain tactically neutral, relying on intraday timeframes like H1/H2 and respecting key price structure.
🔺 Key Resistance Levels
3,260
3,275
3,285
3,312
🔻 Key Support Levels
3,244
3,230
3,215
3,200
🎯 Trade Plan – Friday 3rd May, 2025
🔵 BUY ZONE A:
Entry: 3,232 – 3,230
SL: 3,226
TP: 3,236 → 3,240 → 3,244 → 3,248 → 3,252 → 3,256 → 3,260
🔵 BUY ZONE B:
Entry: 3,214 – 3,212
SL: 3,208
TP: 3,218 → 3,222 → 3,226 → 3,230 → 3,235 → 3,240
🔴 SELL ZONE:
Entry: 3,276 – 3,278
SL: 3,282
TP: 3,272 → 3,268 → 3,264 → 3,260 → 3,250
⚠️ Final Notes
Volatility may spike sharply during the NY session as NFP and political news collide.
This is the kind of session where traders can either capitalize massively or get caught offside — stay disciplined.
Avoid emotional entries — let price come to you, wait for confirmation, and stick to your TP/SL.
📣 Conclusion
We’re likely in a calm-before-the-storm scenario. Gold hasn’t made its real move yet — but when it does, it’ll be swift.
Prepare. Execute. Protect your capital.

Fundamental Market Analysis for May 2, 2025 EURUSDThe EUR/USD pair attracted moderate buying interest during the Asian trading session on Friday and demonstrates a desire to consolidate above the psychologically important level of 1.13000. At the moment, spot quotes seem to have broken a three-day series of declines, reaching a two-week low near 1.12650, recorded on Thursday, amid repositioning of market participants awaiting the publication of key macroeconomic indicators from the Eurozone and the United States.
Representatives of the European Central Bank (ECB) earlier expressed concern over the risks of lower inflationary pressures in the region. In this regard, market participants are waiting with special attention for the preliminary data on the consumer price index (CPI) in the eurozone. Indicators that turned out to be lower than forecasts may strengthen expectations of the ECB key interest rate reduction by 25 basis points following the results of the meeting in July. Such a development could put pressure on the single European currency and contribute to the resumption of the EUR/USD corrective movement from the level of 1.1575 - the maximum since November 2021, recorded last month.
In the United States of America, investors' attention is focused on the upcoming Non-Farm Payrolls report (NFP), according to forecasts of which the US economy could create only 130 thousand new jobs in April, which is significantly lower than the March value of 228 thousand. At the same time, the unemployment rate, according to preliminary estimates, will remain at 4.2%. These data may have a significant impact on expectations of further monetary policy steps by the Federal Reserve (Fed), which, in turn, will affect the dynamics of the US dollar and determine the short-term trajectory of EUR/USD.
Additionally, the persistent expectations of a looser monetary policy of the Federal Reserve System (FRS) restrain the potential for strengthening of the US dollar, despite its three-day rise to local highs. In particular, market participants have increased expectations for four 25 basis point interest rate cuts before the end of this year, after recently released statistics pointed to an unexpected contraction in US GDP - for the first time since 2022. As a result, the dollar bulls' positions remain limited, which provides support to the EUR/USD pair.
Trading recommendation: BUY 1.13100, SL 1.27500, TP 1.14200
