AUD/NZD Triangle Breakout (15.04.2025)The AUD/NZD Pair on the M30 timeframe presents a Potential Selling Opportunity due to a recent Formation of a Triangle Breakout Pattern. This suggests a shift in momentum towards the downside in the coming hours.
Possible Short Trade:
Entry: Consider Entering A Short Position around Trendline Of The Pattern.
Target Levels:
1st Support – 1.0666
2nd Support – 1.0617
🎁 Please hit the like button and
🎁 Leave a comment to support for My Post !
Your likes and comments are incredibly motivating and will encourage me to share more analysis with you.
Best Regards, KABHI_TA_TRADING
Thank you.
Fundamental-analysis

XAU/USD Weekly Outlook Liquidity Grab Before Next Move📌 XAU/USD Weekly Outlook: Range-Bound Behavior Hints at Potential Liquidity Grab Before Next Move 💰📊
Gold (XAU/USD) is currently consolidating within a broad 30-point price channel between 3,216 and 3,246. Price action shows clear indecision, as bulls and bears wrestle for control without confirmation of a breakout or breakdown.
While the overall trend remains bullish, momentum has softened compared to last week. Technical indicators are signaling overbought conditions, and a deeper liquidity sweep is becoming increasingly probable. Traders should remain patient and watch for clearer signals during the upcoming European session.
🔍 Market Structure Highlights
Upside Barriers: 3,246 (ATH), 3,255, 3,268, 3,285, 3,302
Downside Supports: 3,216, 3,195, 3,172, 3,152, 3,120
📈 Trade Opportunity Zones
Potential Long Setup:
Buy Zone: 3,172 – 3,170
Stop Loss: 3,166
ls: 3,176 | 3,180 | 3,184 | 3,188 | 3,192 | 3,196 | 3,200
Potential Short Setup:
Sell Zone: 3,268 – 3,270
Stop Loss: 3,274
Target Levels: 3,264 | 3,260 | 3,256 | 3,252 | 3,248 | 3,244 | 3,240
🧭 Weekly Strategy Insight
With no significant economic data on the calendar this week, price movements will likely be driven by intraday liquidity and order flow. Focus should be placed on the London and New York sessions, where volume tends to peak and directional bias becomes more evident.
Current market behavior suggests that a fake-out or liquidity trap could develop before the next significant move. Traders are advised to avoid chasing price and instead wait for optimal entries at key zones.
⚠️ Risk Reminder
Even in the absence of major news, volatility remains elevated. Always execute trades with a solid risk plan and predefined TP/SL levels. Protect your capital first — the opportunities will come with patience and discipline. 🛡️

Fundamental Market Analysis for April 14, 2025 GBPUSDThe initial market reaction to US President Donald Trump's decision last week to suspend sweeping reciprocal tariffs for 90 days was short-lived amid heightened fears of a US recession amid an escalating trade war between the US and China. China's 84 per cent tariffs on US goods went into effect on Thursday, and Trump raised duties on Chinese imports to an unprecedented 145 per cent. Given that the US still imports a number of hard-to-replace materials from China, these developments have weakened confidence in the US economy.
Meanwhile, data released last week showed that the US consumer price index (CPI) declined 0.1% in March, while core CPI rose +2.8% year-on-year, below consensus forecasts. In fact, markets are now pricing in the likelihood of a 90 basis point rate cut before the end of this year. Conversely, investors believe the likelihood of a Bank of England (BoE) interest rate cut next month is slightly less likely.
The aforementioned favourable fundamental backdrop supports a positive outlook for spot prices in the near term, although bulls seem reluctant to make aggressive bets and prefer to wait for important UK macro releases. Tuesday will see the release of the all-important monthly employment report, followed by the latest consumer inflation data on Wednesday. In addition, this week investors will be keeping an eye on the release of monthly US retail sales data and Fed Chairman Jerome Powell's speech, which will play a key role in influencing dollar price action. This, in turn, should give a significant impetus to the GBP/USD pair in the second half of the week.
Trading recommendation: BUY 1.3130, SL 1.3010, TP 1.3310

Institutional Supply Zones in Play: Will the Euro FX Rally Hold?Euro FX Futures is currently showing strong bullish momentum on the weekly timeframe, surging toward major supply zones that have historically triggered significant sell-offs. The chart reveals two key supply areas where institutional selling pressure has previously emerged. The first, more immediate zone represents a medium-term supply area that could attract profit-taking or initiate a pause in the current rally. The second, higher zone is a long-term supply area with even greater significance, marking the origin of strong bearish moves in the past. These zones are crucial in the current context, as they highlight potential turning points or consolidation phases as price approaches them.
The overall structure remains bullish, but as the market climbs into these well-defined supply regions, traders should be cautious and watch for any shift in momentum or early signs of distribution. These zones often act as magnets for liquidity and can become battlegrounds between buyers and sellers. Whether this bullish move powers through or reacts with a pullback will depend on how price behaves within these high-supply environments. For now, the market is in a strong phase of upside continuation, but strategic traders will be closely monitoring these zones for potential setups.

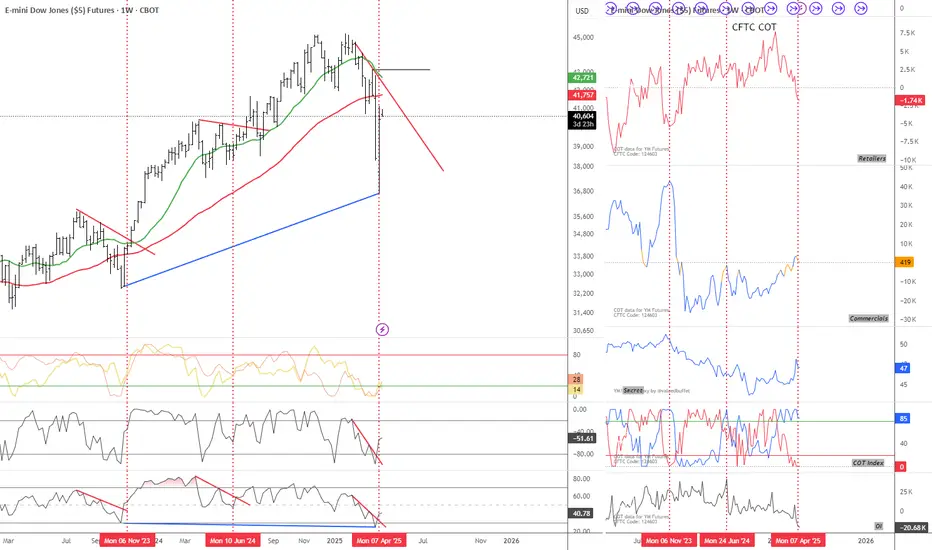
Is it going to happen again? My view to the markets right now...CBOT_MINI:YM1!
Is the Dow Jones breaking the downtrend again?
I believe there's a strong chance the markets are setting up for another move higher. From a fundamental standpoint, the recent pause in tariffs is a big deal. It removes an immediate layer of uncertainty that’s been hanging over the global economy, especially for exporters and multinational companies. On top of that, the fact that key tech products have been left out of the latest tariff actions is boosting confidence in the sector that has been leading market strength for years.
Economically, we’re still seeing resilience in key indicators. Unemployment remains low, consumer spending is steady, and central banks are staying cautious with tightening. The environment still leans more towards slow growth than recession, which supports equities over the medium term.
More importantly, my own criteria for a favorable market setup are lining up. Whether it’s sentiment, intermarket signals, or trend conditions—this looks like a solid spot for a bullish stance.
You can see my chart to check out my current viewpoint on the Dow Jones and how I’m positioning based on all this.
Not Financial Advice
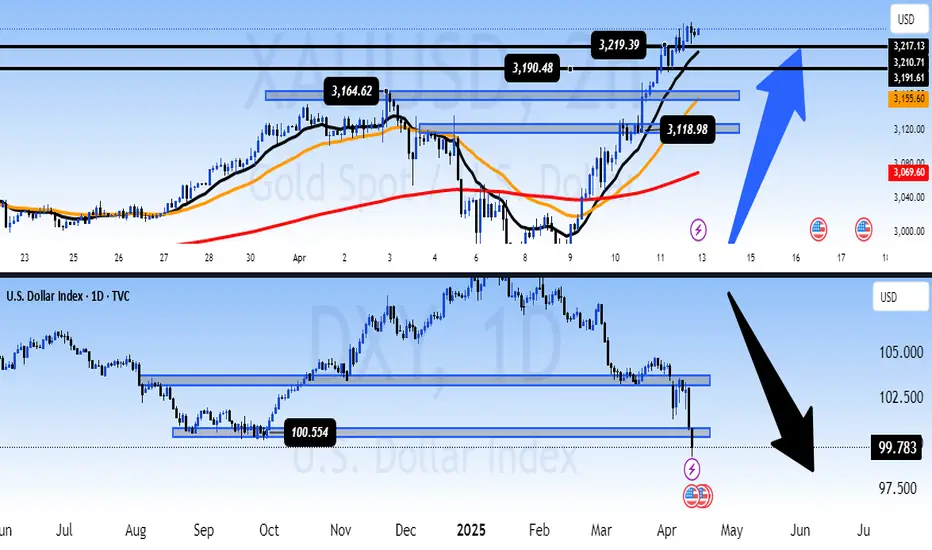
[XAU/USD & DXY] – Long-Term Outlook📌 – Long-Term Outlook: Is Gold Entering a New Bull Cycle as USD Weakens?
📊 Technical Analysis – Gold & DXY
The divergence between Gold and the U.S. Dollar Index (DXY) has become increasingly clear:
🔹 Gold (XAU/USD):
Price has broken the previous high at 3,190 and is now testing 3,219 – a fresh all-time high on the daily chart.
The MA13, MA34, and MA200 are showing a perfect “bullish fan” formation, indicating a sustainable uptrend rather than a short-term pump.
The key support zone around 3,164 – 3,118 remains critical for any healthy pullback.
🔻 U.S. Dollar Index (DXY):
Price has decisively broken below the psychological 100.55 support and is now hovering near 99.78.
If DXY fails to hold above 99.7, the next downside target could be 97.5 in the coming quarter.
The technical structure is clearly bearish, confirming USD weakness across the board.
→ This negative correlation aligns with macro expectations: a weaker dollar is fueling gold’s bullish momentum.
🌍 Fundamental Analysis – Macro Drivers
US PPI & CPI both come in lower than expected:
Inflation is showing clear signs of cooling.
Markets are now pricing in a possible rate cut as early as June.
Shift in Fed tone – from hawkish to neutral:
While not officially declared, recent Fed statements have been more dovish, supporting risk assets and weakening the dollar.
Strong safe-haven demand remains:
Geopolitical risks and economic uncertainty continue to push capital into gold, especially as USD enters a weakening phase.
🧭 Long-Term Perspective
Gold is potentially entering a new bull cycle. With consecutive ATH breakouts and favorable macro conditions (falling inflation, expected rate cuts, USD weakness), gold could push to even higher levels into Q2 and Q3.
The USD faces downside pressure in the coming months, especially if the Fed signals a firm pivot toward easing.
⚠️ Strategy Caution
Short-term corrections may occur, especially after such a sharp rise.
However, any pullbacks into key support zones could present strategic long opportunities for longer-term investors.
💬 What’s Your Take?
Is this the beginning of a major bull cycle in gold, or do you expect deeper pullbacks before continuation?
Drop your analysis and charts below! 👇👇👇
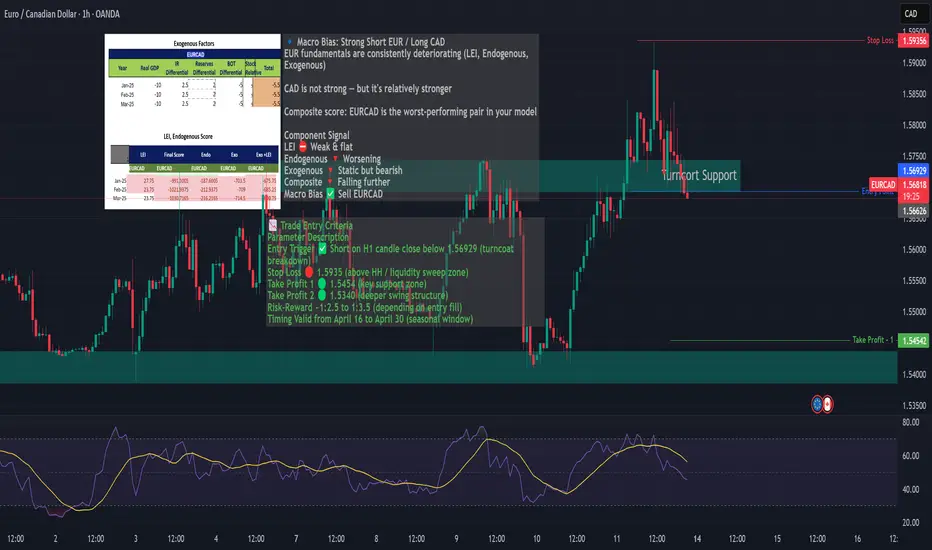
EURCAD Breakdown Watch–Bearish Divergence + Fundamental WeaknessEURCAD rallied into a key turncoat zone (former resistance → support)
Currently consolidating within this zone and showing clear RSI bearish divergence on both 1H and 4H timeframes.
Price is losing momentum while macro and seasonal factors align for a short bias.
🔍 Macro & Seasonality Confluence:
EUR Fundamentals: Worsening LEI, Endogenous & Exogenous scores
CAD Stability: Mildly bearish, but stronger than EUR
Seasonal Bias: EURCAD turns bearish after April 15
GOLD Explosive Bull Run or Setup for a Historic Short?📌 XAU/USD Outlook: Explosive Bull Run or Setup for a Historic Short? 💥📈
✨ Market Overview:
Gold (XAU/USD) has entered an exceptionally volatile phase, with price swings exceeding $100 per day. After dropping from 3,280 to 3,080, gold has roared back to a new all-time high at 3,200 in just two sessions — raising the critical question: Is this a true recovery wave, or merely a bull trap ahead of a potential historic short?
A surge of capital has flooded into financial markets, aggressively buying the dip across multiple asset classes. Investor psychology is now at the forefront, driving gold into extreme territory.
🌍 Fundamental Outlook:
Recent U.S. economic data came in weaker than expected, supporting the bullish momentum in gold. If history repeats itself, we could witness similar outcomes with the upcoming CPI and PPI releases — both of which are forecast to remain soft, potentially weakening the USD and further lifting gold.
Short-term: U.S. consumer demand appears weaker, pressuring USD.
Medium-to-long term: These weak data points may be laying the groundwork for a massive short on gold once the Fed initiates its expected rate cuts — potentially as early as June.
📊 Technical Outlook:
Gold’s price action is becoming increasingly difficult to predict. It took a full week for gold to fall $200 — but only two days to fully reclaim that ground and establish a new ATH.
Today, the market may continue this bullish surge, particularly if the PPI data surprises to the downside.
Key Support Levels:
3,200
3,188
3,174
3,157
3,130
3,120
Key Resistance Levels:
3,265
3,302
🧭 Trading Plan:
BUY Zone (High Probability):
Entry: 3,175 – 3,173
Stop Loss: 3,168
Take Profit: 3,180 | 3,184 | 3,188 | 3,192 | 3,196 | 3,200 | Open
SELL Zone (Aggressive Counter-Play)
Entry: 3,301 – 3,303
Stop Loss: 3,308
Take Profit: 3,296 | 3,292 | 3,288 | 3,284 | 3,280 | 3,270 | Open
⚠️ Risk Management Advisory:
Price action is extremely volatile — trade setups should be chosen carefully. Ensure proper stop-loss and take-profit are in place for every trade. Avoid emotional entries and respect risk-to-reward principles to protect your capital.
💡 Conclusion:
Gold is in a critical zone. With macro sentiment, news flow, and technicals all aligned, traders must stay alert. In the short term, the FOMO-driven rally looks likely to continue — but remain vigilant for signs of a reversal that could usher in a massive short wave.
🗨️ Share Your View:
Do you see gold continuing this bullish run — or is this the calm before a historic dump? Share your thoughts and strategies below! 💬👇

Fundamental Market Analysis for April 11, 2025 EURUSDEUR/USD hit its highest levels in nearly two years on Thursday, breaking through and closing above 1.1200 for the first time in 21 months. Market tensions continue to ease after the Trump administration dropped its own tariffs at the last minute, causing a general weakening in US Dollar flows.
US consumer price index (CPI) inflation fell significantly short of forecasts in March. The core CPI fell to 2.8 per cent year-on-year, a four-year low after nearly eight months above 3.0 per cent. Core CPI inflation also fell to 2.4 per cent year-on-year. Investment markets will face a major challenge if the tariffs reverse the Federal Reserve's (Fed) multi-year efforts to curb inflation.
On Friday, the week will conclude with the release of the University of Michigan (UoM) Consumer Sentiment Index survey. The University of Michigan's consumer sentiment index is expected to decline again in April as consumers feel the pressure of the Trump administration's tariff and trade policies, and is likely to fall to a near three-year low of 54.5. In addition, expected consumer inflation data will be released on Friday, with UoM's 1-year and 5-year expected consumer inflation previously standing at 5% and 4.1% respectively.
Trade recommendation: SELL 1.1305, SL 1.1380, TP 1.1150

GBP/JPY Triangle Breakout (11.04.2025)The GBP/JPY Pair on the M30 timeframe presents a Potential Selling Opportunity due to a recent Formation of a Triangle Breakout Pattern. This suggests a shift in momentum towards the downside in the coming hours.
Possible Short Trade:
Entry: Consider Entering A Short Position around Trendline Of The Pattern.
Target Levels:
1st Support – 184.40
2nd Support – 182.60
🎁 Please hit the like button and
🎁 Leave a comment to support for My Post !
Your likes and comments are incredibly motivating and will encourage me to share more analysis with you.
Best Regards, KABHI_TA_TRADING
Thank you.

AUDUSD Long – Fair Value Gap + Macro Confluence + Bullish LEI AUDUSD Swing Long Setup – Technical + Macro Confluence
✅ Bias: Long AUD/SD
Based on a multi-factor thesis:
Macro: RBA steady; AUD LEI rising steadily (87 → 96), Endogenous improving
USD Weakness: Fed dovish + GDP downgraded = downside pressure
Seasonality: USD historically weak entire April

NZDUSD Long Setup – FVG + Order Block + Macro Bullish BiasI'm looking to go long on NZDUSD based on a strong confluence of fundamentals, seasonal trends, and technical structure.
🔹 Macro bias: USD weakening as Fed leans dovish, while NZD is gaining momentum from rate cuts and improving LEI.
🔹 Seasonality: Historically, NZD shows strength in the first half of April, while USD tends to weaken mid-to-late April.
🔹 Technical setup:
Price left a Fair Value Gap (FVG) on the 4H chart
Pullback into a bullish Order Block (OB)
Entry within imbalance

XAU/USD Outlook: Gold's Bullish Momentum Strengthens 📌 XAU/USD Analysis: Gold on a Strong Bullish Momentum Amid Economic Optimism 📈💰
✨ Overview:
Gold (XAU/USD) is currently demonstrating significant bullish momentum, driven by improved global economic sentiment. The recent 90-day tariff suspension among major global economies and hints from the recent FOMC meeting about potential rate cuts later this year are fueling investor optimism.
📊 Technical Analysis:
🔹 Key Resistance Levels:
3,146
3,162
3,168
🔸 Key Support Levels:
3,096
3,078
3,066
3,052
📈 Moving Averages Analysis:
MA 13 (Short-term): Clearly supports bullish momentum, offering buy signals as price sustains above this MA.
MA 34 (Medium-term): Supporting bullish sentiment with prices comfortably above.
MA 200 (Long-term): Reinforces the robust long-term bullish outlook with price consistently trading above this level.
🚀 Trading Strategy & Recommendations:
BUY Strategy (Preferred Scenario):
Entry Zone: 3,094 – 3,096
Stop Loss: 3,090
Take Profit Levels: 3,100 | 3,104 | 3,108 | 3,112 | 3,116 | 3,120
SELL Strategy (Cautious Approach):
Entry Zone: 3,164 – 3,166
Stop Loss: 3,170
Take Profit Levels: 3,160 | 3,156 | 3,152 | 3,148 | 3,144 | 3,140
🌍 Fundamental Context:
Positive Market Sentiment: The global economic outlook has turned favorable due to tariff suspensions and strong performance in equity markets.
Interest Rate Outlook: Recent signals from the FOMC regarding possible interest rate cuts are providing further support for gold’s upward trajectory.
⚠️ Risk Management:
Emphasize caution when engaging in short positions, given the prevailing bullish conditions.
Always implement strict stop-loss measures and maintain risk-to-reward ratios of at least 1:2.
Avoid over-leverage and ensure trades are sized appropriately.
💡 Conclusion & Final Thoughts:
Gold remains strongly bullish, backed by both technical indicators and a positive fundamental backdrop. Traders are encouraged to focus primarily on buy opportunities near significant support levels and remain alert to potential trend reversals at key resistance zones.
🗨️ Engage with Us:
What are your current strategies for gold? Share your insights and views in the comments section below! 💬👇

Fundamental Market Analysis for April 10, 2025 USDJPYThe Japanese yen (JPY) showed strength during the Asian trading session on Thursday, reacting to the release of producer price index (PPI) data that exceeded market expectations. This macroeconomic signal reinforced speculation about possible further monetary policy tightening by the Bank of Japan (BoJ), keeping the probability of an interest rate hike in the future. Additional support for the yen was provided by positive expectations of a potential trade agreement between Japan and the United States.
Amid the weakening of the US dollar (USD), the USD/JPY pair showed a pullback and fell below the psychologically important level of 147.000, which was also supported by a limited correction of the US currency amid a general recovery in market confidence.
The divergence in monetary expectations between the Bank of Japan and the Federal Reserve remains significant. While Japan is increasingly likely to tighten monetary policy, markets in the US are pricing in a scenario of multiple cuts in the Fed's key interest rate in 2025. This discrepancy has prevented the US dollar from maintaining momentum after an overnight recovery from a weekly low, prompting a reallocation of capital in favor of the more stable yen despite its status as a low-yielding currency.
Improved global risk sentiment, driven by US President Donald Trump's announcement of a temporary suspension of retaliatory tariffs against key trading partners, may also help strengthen the yen as a safe haven asset, especially amid continued uncertainty in international markets.
Trade recommendation: SELL 146.800, SL 147.400, TP 145.400

Micron's Time to Be THAT Semiconductor is coming and FastNASDAQ:MU is extremely undervalued, I produced this chart last night. Its time that the market appreciates this monster with such solid fundamentals. Micron since 2022 has been working hard to become a major producer in the United States. I believe that Trump and his government could get behind the only major memory company to be based in the United States.
-----------------------
Balance Sheet:
Cash: $8.22b
Debt: $11.54b
Equity: $48.63b
Total Liabilities: $24.42b
Total Assets: $73.05b
All Stated in $ USD
-----------------------
Valuation:
Price To Sales: 2.72
Price To Earnings: 18.30
Forward Price To Earnings: 6.84
-----------------------

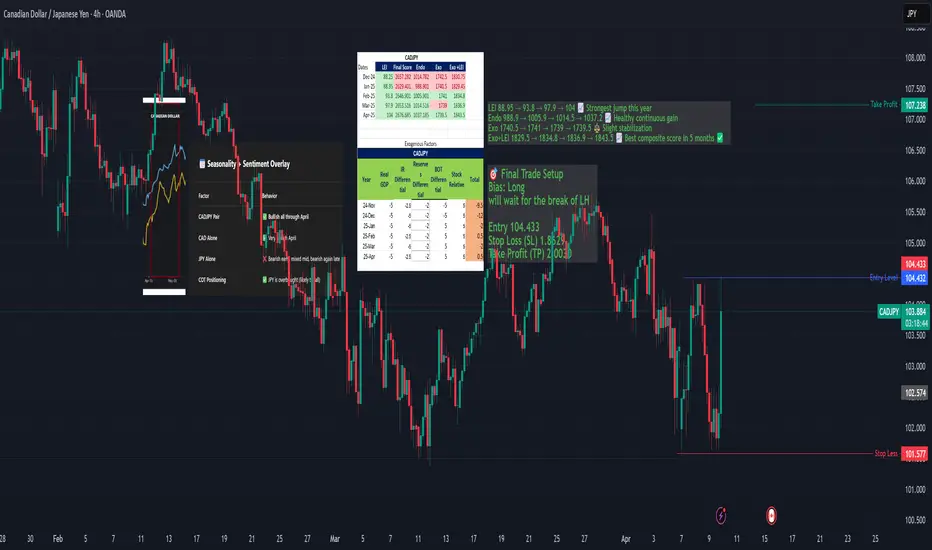
CADJPY: Bullish Setup Building — Fundamental AnalysisCADJPY is approaching a major support zone with a strong macro and seasonal backdrop favoring a bullish reversal.
Macro scores (LEI, endogenous) show consistent strength
Seasonality supports upside from late April into May
JPY is overbought per COT data
🔁 However, price structure remains bearish on 4H and Daily, so we are waiting for a confirmed CHoCH and HL before executing a swing long.
This idea is a "watch & prepare" setup — get ready to strike once structure flips.
Markets On Edge: Gold Soars, Dollar Stumbles, Bitcoin Bounces 🔍 Midweek Market Outlook: What’s Driving DXY, Gold & Bitcoin Right Now?
We’re in the middle of one of the most eventful trading weeks of the year.
The U.S. Dollar is retreating under policy pressure
Gold has officially gone parabolic, smashing through $3,000
Bitcoin is pulling back hard, down nearly 30% from its highs
These aren’t just price moves — they’re reflections of real economic stress and shifting capital flows.
In this week’s outlook, I break down:
📌 The key macro drivers behind these moves
📌 How the latest inflation data, Fed tone, and geopolitics are shaping sentiment
📌 Why gold is rallying like it’s 1980 all over again
📌 And what traders should anticipate next on DXY, XAUUSD, and BTCUSD
If you trade or invest in these markets, this is one of those weeks where fundamentals can’t be ignored.
🧠 Insights. 🎯 Forecasts. 🛠️ Trade Prep.
Check it out — link in the comments.

GOLD MARKET UPDATE – Trend Breakouts and Market Structure Shift🟡 GOLD MARKET UPDATE – Trend Breakouts and Market Structure Shift
Gold has broken through both the parallel ascending channel and a narrow triangle pattern at the edges, resulting in a strong buying momentum (FOMO BUY). This move can be attributed to a mild positive shift in the US stock market yesterday, along with some upward momentum in the Asian and European markets today.
📉 Current Situation: It’s still unclear whether this movement is tied to positive news about tariffs, but an important level to watch is 3075 – 3077. If this level is breached, it may be time to reassess the outlook and consider shifting towards a BUY.
💡 Currently, there’s strong buying activity during the European session. It’s recommended to avoid jumping into BUY positions at these levels and to refrain from selling too aggressively.
📌 Scenario for Today: Look for potential BUY opportunities at the important levels 3030 – 3018 during the European session, and stay tuned for updates regarding FOMC tonight.
🔮 Be Cautious: The FOMC meeting will take place later today, which could lead to significant market movements. Be prepared for potential volatility and liquidity sweeps in less liquid areas.
🧭 Key Technical Levels:
🔺 Resistance: 3075 – 3090 – 3110
🔻 Support: 3030 – 3018 – 3000 – 2988 – 2974
🎯 Trade Setup:
🔴 SELL ZONE: 3074 – 3076
SL: 3080
TP: 3070 – 3066 – 3062 – 3058 – 3054 – 3050 – 3040
🟢 BUY ZONE: 2976 – 2974
SL: 2970
TP: 2980 – 2984 – 2988 – 2992 – 2996 – 3000
📌 Reminder: The market is currently very sensitive, so stick to risk management rules, ensure full TP/SL implementation, and avoid making hasty decisions.
Be cautious and watch the market movements closely!
— AD | Money Market Flow

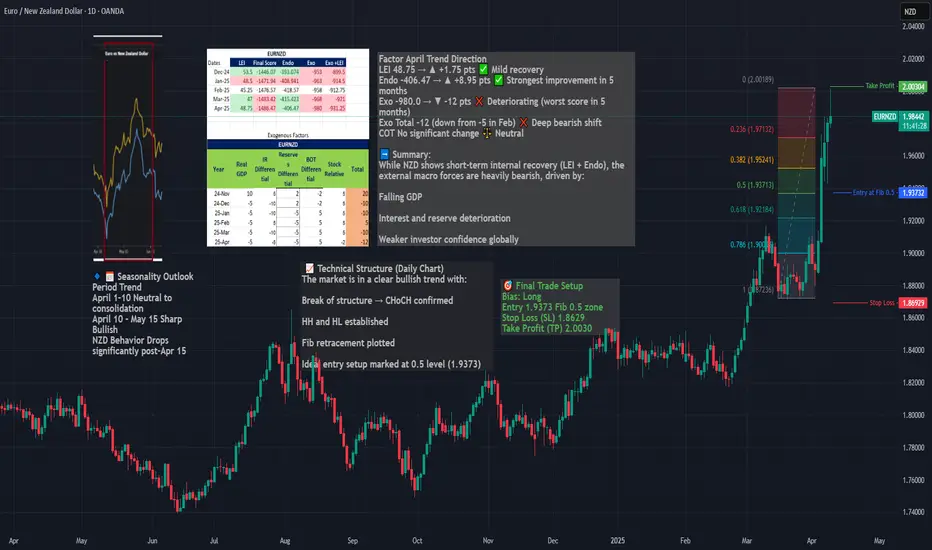
Long EURNZD – Seasonal, Fundamentals & Technical ConfluenceWe are entering a long position on EURNZD, capitalizing on a powerful confluence of:
Seasonal EUR strength + NZD weakness (April 10 – May 15)
A clear bullish market structure (CHoCH, HH/HL)
A clean Fibonacci retracement entry at 0.5
Strong macro divergence, with NZD exogenous conditions deteriorating
Macro & Seasonal Context
EUR enters a strong seasonal uptrend from April 10 to end of month
NZD shows seasonal weakness from April 15 onward
NZD’s exogenous model score worsened to -12 in April
While NZD LEI and endo improved, it remains structurally weak
Timing
Best execution: on pullback to 1.9373 zone, ideally between April 10–15, aligned with seasonal entry window.
Will the support zone keep BTC falling?BTC has once again bounced off the upper border of the downtrend channel. Here, it is worth remembering the long-formed gap around $74,500, which was closed during the last decline.
Here, you can see how the price fell into a strong support zone from $77,742 to $73,980, but if this zone is broken, we can again see a strong decline around also very strong resistance and the lower border of the channel at $68,590.
Looking the other way, you can see that the increases were stopped by the resistance zone from $84,000 to $86,700, only breaking out of this zone at the top will give the possibility of growth towards strong resistance at $94,300.
The RSI is still in the lower part of the range and is again heading towards the lower borders, but here the price has formed a lower low, which can still give another reaction.

GOLD MARKET OUTLOOK – Investor Panic After Fake News🟡 GOLD MARKET OUTLOOK – Investor Panic After Fake News, Bearish Bias Remains
📉 Current Strategy: Focus on SELL setups at key resistance zones – short-term bearish outlook remains valid
📌 US Session Recap:
Gold saw a sharp sell-off after a fake news report circulated about the US delaying its planned tariff policy.
→ While the White House later confirmed it was misinformation, the damage was done — panic selling hit across global markets.
💥 As a result, gold dropped aggressively and reached the 295x zone, aligning perfectly with AD’s previous short bias.
Meanwhile, US equities also continued to bleed red.
🧠 Market Sentiment: “Cash is King” is Back
With global instability and fear on the rise:
🔹 Investors are hoarding cash
🔹 USD demand increases, along with inflows into US government bonds
🔹 Risk assets like gold, stocks, and crypto are being dumped
💡 This could be part of Trump’s larger play — forcing global capital to flow back into US Treasuries while applying pressure on speculative markets.
🔮 AD’s View:
Unless we see a clear shift in investor sentiment, the base case remains: → Sell rallies through midweek, then reassess.
🧭 Key Technical Zones to Watch:
🔺 Resistance: 3005 – 3016 – 3035 – 3056 – 3076
🔻 Support: 2980 – 2969 – 2956 – 2930 – 2912
🎯 TRADE PLAN:
🟢 BUY ZONE: 2930 – 2928
SL: 2924
TP: 2934 – 2938 – 2942 – 2946 – 2950
🔴 SELL ZONE: 3034 – 3036
SL: 3040
TP: 3030 – 3026 – 3022 – 3018 – 3014 – 3010 – ???
📌 Keep an Eye on DXY:
The US Dollar Index is currently testing a major 3-year support level.
→ If equities fail to recover and fear persists, DXY could bounce — and gold would likely continue its correction lower.
⚠️ Final Note:
We’re in a highly volatile and uncertain environment.
→ Stick to the plan. Respect your SL/TP levels. Avoid emotional decisions.
—
📣 Found this perspective useful? Follow for daily macro-backed trade ideas and real-time market structure breakdowns.
Clarity. Consistency. Risk Management.
— AD | Money Market Flow

Fundamental Market Analysis for April 8, 2025 EURUSDAfter a tense week in which the US fully adopted a protectionist trade policy - despite lacking the necessary industrial infrastructure - tariffs on imports were imposed. The US now applies a general 10 per cent import tax on all goods from each country, as well as various ‘reciprocal’ tariffs calculated by dividing US imports by exports. After imposing a 34 per cent tariff on Chinese products, China responded with its own 34 per cent tariff on all goods imported from the US. Unable to find alternative solutions, the Trump administration threatened to impose an additional 50 per cent tariff on all Chinese goods, which is set to take effect on April 8.
US data takes centre stage again this week, with the release of Consumer Price Index (CPI) data on Thursday. On Friday, producer price index (PPI) data and the University of Michigan (UoM) consumer sentiment survey are expected.
Investors are raising bets that the Federal Reserve (Fed) will begin cutting interest rates to reduce recession risks. Markets are factoring in nearly 200 basis points of rate cuts through the end of 2025, despite the Fed issuing cautious policy statements indicating that trade uncertainty complicates any potential rate cut.
Trade recommendation: SELL 1.0950, SL 1.1030, TP 1.0830

THE REALITY!You cant beat the Index fund in Long term growth....Compare your portfolio with Major Indices
Warren buffet Quote - You can't Beat S&P500 Index
