Fundamental-analysis


Fundamental Market Analysis for November 22, 2024 USDJPYHigher market sentiment and rising US bond yields are limiting the rise of the low-yielding yen.
The US Dollar is holding near its highest level in the last year and is providing support to the USD/JPY pair.
The Japanese Yen (JPY) attracted buying for the second day in a row following the release of slightly better-than-expected Japanese consumer inflation data. This came amid statements released on Thursday by Bank of Japan Governor Kazuo Ueda, which kept expectations of an interest rate hike in December. In addition, Japanese Prime Minister Shigeru Ishiba's 39 trillion yen economic stimulus package boosts the Yen and puts some pressure on the USD/JPY pair.
Nevertheless, the prevailing risk-on and higher US Treasury yields keep traders from aggressive bullish bets on the low-yielding Yen. Investors remain concerned that U.S. President Donald Trump's policies could lead to renewed inflation and force the Federal Reserve (Fed) to slowly cut interest rates. This has been a key factor in the recent rise in US bond yields, which has kept the US Dollar (USD) near yearly highs and provided support to the USD/JPY pair.
Trade recommendation: Watch the level of 154.00, trading mainly with Buy orders.

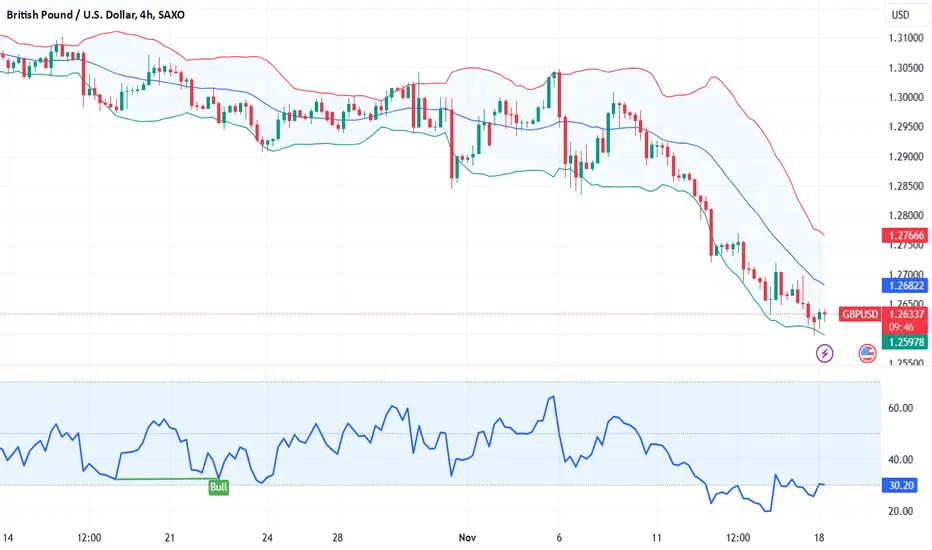
Fundamental Market Analysis for November 21, 2024 GBPUSDThe GBP/USD pair declined to 1.26500 during Asian trading on Thursday. This decline can be attributed to the weakening of the US dollar (USD). The US Dollar Index (DXY), which measures the value of the dollar against six major peers, is holding near 106.50 at the time of writing.
However, downside risk to the US Dollar may be limited due to cautious remarks from Federal Reserve (Fed) officials. Boston Fed President Susan Collins said on Wednesday that while further interest rate cuts are necessary, policymakers should proceed cautiously to avoid moving too fast or too slow, Bloomberg reported.
Meanwhile, Fed Chair Michelle Bowman emphasized that inflation has remained elevated over the past few months and stressed the need for the Fed to take a cautious approach to rate cuts.
The Reuters poll showed that nearly 90% of economists (94 out of 106) expect a 25 bps rate cut in December, which would bring the federal funds rate down to 4.25-4.50%. Economists forecast a slower rate cut in 2025 due to the risk of higher inflation as a result of President-elect Trump's policies. The federal funds rate is forecast to be 3.50-3.75% by the end of 2025, 50 bps above last month's forecast.
GBP/USD's upside potential seems restrained due to safe-haven flows amid the escalating conflict between Russia and Ukraine. On Wednesday, Ukraine fired a salvo of British Storm Shadow cruise missiles into Russian territory, marking the latest use of Western weapons against Russian targets. This came after Ukraine used U.S. ATACMS missiles the previous day.
Trading recommendation: Trade mainly with Sell orders from the current price level.

Buy AUD/JPY Bullish ChannelThe AUD/JPY pair on the M30 timeframe presents a potential Buying opportunity due to a recent downward breakout from a well-defined Bullish Channel pattern. This suggests a shift in momentum towards the Upside in the coming Hours.
Key Points:
Buy Entry: Consider entering a Long position around the current price of 101.04, positioned close to the breakout level. This offers an entry point near the perceived shift in momentum.
Target Levels:
1st Support – 101.94
2nd Support – 102.54
Your likes and comments are incredibly motivating and will encourage me to share more analysis with you.
Best Regards, KABHI FOREX TRADING
Thank you.

Sell NZD/CAD Triangle BreakoutThe NZD/CAD pair on the M30 timeframe presents a Potential Selling Opportunity due to a recent breakout from a Triangle Pattern. This suggests a shift in momentum towards the downside in the coming hours.
Possible Short Trade:
Entry: Consider Entering A Short Position Below the Broken Trendline Of The Triangle After Confirmation. Ideally, This Would Be Around 0.8240
Target Levels:
1st Support – 0.8210
2nd Support – 0.8195
Your likes and comments are incredibly motivating and will encourage me to share more analysis with you.
Best Regards, KABHI FOREX TRADING
Thank you.

Fundamental Market Analysis for November 19, 2024 USDJPYThe Japanese yen (JPY) rose against its US counterpart during Tuesday's Asian session, although it lacked bullish confidence amid uncertainty over the timing of the Bank of Japan's (BoJ) next interest rate hike. In addition to this, risk-on sentiment reflected in the overall positive tone in the equity markets may be contributing to the safe-haven yen's decline.
That said, geopolitical risks and lower US Treasury yields could prevent a significant downside for the low-yielding yen. In addition, speculation that Japanese authorities may intervene to support the national currency may deter bears from aggressively betting on the yen. The focus will now shift to Japan's consumer inflation data and global PMIs due out later this week.
Japan's Economy Minister Ryosei Akazawa said Tuesday that “it is crucial to raise wages for all generations with an economic package.”
He also noted that he is “aiming for the cabinet to approve the economic package soon.”
At the time of writing the analysis, the USD/JPY pair is consolidating on the latest round of declines just above the 154.10 level, having lost 0.36% on the day.
Trade recommendation: Trade mainly with Sell orders from the current price level.

Sell USD/JPY Bearish FlagThe USD/JPY pair on the M30 timeframe presents a potential selling opportunity due to a recent downward breakout from a well-defined Bearish Flag pattern. This suggests a shift in momentum towards the downside in the coming Hours.
Key Points:
Sell Entry: Consider entering a short position around the current price of 154.42, positioned close to the breakout level. This offers an entry point near the perceived shift in momentum.
Target Levels:
1st Support – 153.18
2nd Support – 152.55
Your likes and comments are incredibly motivating and will encourage me to share more analysis with you.
Best Regards, KABHI FOREX TRADING
Thank you.

BTC USD UpdateIts been bless to trade this asset, absolutly amazing , in my 17 years of trading i never seen anything move as much as btc .In my 17 years of trading, I've never seen anything move as much as BTC. It's the only asset in the world where you can make more with spot trades than swings. Absolute beast. All we need is 100K and then some, lol. Stay patient, fellow traders.

BCH Parabolic Incoming?it seems BCH is poised for a parabolic rise,
Technical analysis is saying so, fundamental reasons is there as well as a big update to the core has been commited over the past days, you can read about it here:
u.today
based on the news it now rivals ETH!
"This upgrade fully utilizes Bitcoin Cash's fundamentally more scalable architecture to provide math capabilities that surpass those of Ethereum such as "bare metal" performance, more byte-efficient and cheaper transactions"
let's see how this unfolds.

Fundamental Market Analysis for November 18, 2024 GBPUSDThe Pound-Dollar pair starts the new week on a subdued note and is consolidating in a range above the round 1.26000 mark, or the lowest level since mid-May, reached on Friday. For now, spot prices appear to have broken a six-day losing streak on the back of a modest decline in the US Dollar, although the fundamental backdrop supports the prospects for an extension of the recent established downtrend.
The US Dollar remains on the defensive below the one-year high (YTD) set last Thursday as bulls took a pause to take a breather after the explosive rally following the US election. However, any meaningful decline in the dollar seems unlikely amid expectations that US President-elect Donald Trump's policies are likely to revive inflationary pressures and limit the scope for further rate cuts by the Federal Reserve (Fed). This has been a key driver of the recent rise in US Treasury bond yields, suggesting that the path of least resistance for the US Dollar lies to the upside.
The British Pound (GBP), on the other hand, may struggle to attract buyers amid uncertainty over the Bank of England's (BoE) future interest rate path. Data released last week showed that UK wage growth excluding bonuses slowed in September, while the unemployment rate rose to 4.3% from 4.1%. In addition, UK GDP unexpectedly contracted in September for the first time in five months, reinforcing expectations of a BoE rate cut. Nevertheless, Bank of England members are not expected to cut interest rates at the December meeting.
This, in turn, makes it reasonable to expect strong follow-through buying to confirm that the GBP/USD pair has formed a short-term bottom. Bearish traders, however, can now wait for a sustained breakout and consolidation below the 1.2600 round figure before placing new bets amid a lack of market-significant economic releases on Monday from both the UK and the US.
Trading recommendation: Watch the level of 1.26000, if consolidated below consider Sell positions, if rebounded consider Buy positions.
INVESTMENT IDEA - BAJAJ FINANCE Bajaj Finance , a major financial services provider in India, showcases a promising investment setup supported by both technical and fundamental strengths.
Technical Reasons :
Trend Line Support: The stock is holding above a long-term trend line, indicating resilience and potential for an upward move.
Intact Trend: Continuous higher highs and higher lows signal that the bullish trend remains intact.
Doji and Inside Candle Pattern on Weekly: This pattern suggests a possible reversal or continuation, highlighting a period of consolidation with potential for breakout.
Fundamental Reasons :
Record Revenue and Net Profit: Both metrics are at all-time highs, underscoring the company's financial strength.
Attractive Valuation: With a current 10-year PE ratio of 27.9, Bajaj Finance trades below its 10-year median PE of 45.4, suggesting it is undervalued relative to historical standards.
Solid Growth and Returns: The company boasts a 24% compounded sales growth rate, an ROCE of 11.9%, and an ROE of 22.1%, reflecting effective utilization of capital and profitability.
These combined factors make Bajaj Finance an attractive long-term investment option, with technical support for entry and solid fundamentals for sustained growth potential.

Fundamental Market Analysis for November 15, 2024 USDJPYThe Japanese Yen (JPY) extended its losing streak against the US Dollar (USD) for the fifth consecutive session following the release of Japan's Q3 Gross Domestic Product (GDP) data on Friday. The USD/JPY pair's upside potential is supported by a strong US Dollar (USD). Traders are also preparing for the release of US retail sales data for October, due later on Friday.
Japan's preliminary gross domestic product (GDP) data for the third quarter rose 0.2% quarter-on-quarter, up from 0.5% in the previous quarter, matching market expectations. On an annualized basis, the country's GDP growth in the third quarter was 0.9%, beating the market consensus forecast of 0.7%, but showing a sharp slowdown from the 2.2% growth recorded in the second quarter.
Japan's Finance Minister Katsunobu Kato said on Friday that he will take appropriate measures against excessive currency fluctuations. Kato emphasized the importance of stable exchange rate movements reflecting economic fundamentals and expressed concern about unilateral sharp fluctuations in the market.
Meanwhile, Japan's Economy Minister Ryosei Akazawa said he expects the moderate economic recovery to continue, fueled by rising employment and wages. However, Akazawa also emphasized the need to keep a close eye on potential downside risks to the global economy and volatility in financial and capital markets.
Trading recommendation: Trade predominantly with Buy orders from the current price level.

Sell XAU/USD (Gold) Bearish ChannelThe XAU/USD pair on the M30 timeframe presents a potential selling opportunity due to a recent downward from a well-defined Bearish Channel pattern. This suggests a shift in momentum towards the downside in the coming Hours.
Key Points:
Sell Entry: Consider entering a short position around the current price of 2560, positioned close to the breakout level. This offers an entry point near the perceived shift in momentum.
Target Levels:
1st Support – 2524
2nd Support – 2501
Your likes and comments are incredibly motivating and will encourage me to share more analysis with you.
Best Regards, KABHI FOREX TRADING
Thank you.

Sell XAG/USD (Silver) Bearish ChannelThe XAG/USD pair on the M30 timeframe presents a potential selling opportunity due to a recent downward breakout from a well-defined Bearish Channel pattern. This suggests a shift in momentum towards the downside in the coming Hours.
Key Points:
Sell Entry: Consider entering a short position around the current price of 30.40, positioned close to the breakout level. This offers an entry point near the perceived shift in momentum.
Target Levels:
1st Support – 29.50
2nd Support – 29.10
Your likes and comments are incredibly motivating and will encourage me to share more analysis with you.
Best Regards, KABHI FOREX TRADING
Thank you.

Possible USD Strength Continuation?Here's the revised trading plan with the requested adjustments:
1 . Baseline Scenario :
- Macro-Fundamental Bias: Neutral to Slightly Dovish . The Federal Reserve has recently lowered the federal funds rate to 4.50% - 4.75%, reflecting a cautious approach to monetary easing. While inflation remains somewhat elevated, the Fed is balancing its dual mandate of supporting employment and controlling inflation. Current market expectations indicate a 59% probability of a quarter-point rate cut at the December meeting, down from 82.5%.
- Short Term Sentiment Bias: Bullish . The short-term sentiment on the USD is bullish, driven by Fed Chair Powell's recent comments on the strong economy and solid job market, which have reduced the likelihood of a December rate cut.
2. Risk Event Baseline :
- Market Expectations:
- Core Retail Sales m/m: Forecast 0.3% (Previous 0.5%)
- Retail Sales m/m: Forecast 0.3% (Previous 0.4%)
3. Surprise Scenarios:
- Positive Surprise :
- Plan: If retail sales figures exceed expectations, this will likely reinforce the bullish sentiment on the USD. Consider increasing long positions in USD pairs, particularly against currencies with dovish central banks. Additionally, look for opportunities in sectors that benefit from strong consumer spending, such as retail and consumer discretionary stocks.
- Negative Surprise :
- Plan: If retail sales figures come in below expectations, the market reaction is expected to be muted given the current sentiment. Maintain existing positions but be prepared to adjust if subsequent data or Fed communications indicate a shift in the economic outlook. Monitor for any signs of weakening consumer confidence or spending that could impact broader market sentiment.

A Weaker pound?
1. Baseline Scenario
- Macro-Fundamental Bias Dovish. The Bank of England has cut rates by 25bps to 4.75%, with expectations of further cuts due to slowing inflation. Markets are pricing in two 25bps cuts by the end of 2025 with a 92% chance of a third 25bps cut, dispite the Labour Government's fiscal policy expected to be reflationary. There is also a 15% chance of a 25bps rate cut in December.
- Short Term Sentiment Bias : Neutral. The pound is moving flat on an index level, indicating no strong short-term sentiment driving the price.
2. Risk Event Baseline
- Event Description : Upcoming UK GDP data releases.
- Monthly GDP (m/m) forecast: 0.2% (previous: 0.2%).
- Preliminary GDP (q/q) forecast: 0.2% (previous: 0.5%).
- Market Expectations : Markets are anticipating a slowdown in economic growth, with the preliminary GDP forecast significantly lower than the previous quarter.
3. Surprise Scenarios:
- Negative Surprise:
- Plan: If GDP data misses forecasts, reinforce bearish positions on GBP pairs. A weaker-than-expected GDP print could act as a catalyst for further pound selling, aligning with the dovish macro outlook and expectations of additional rate cuts.

Buy NZD/JPY Descending Triangle The NZD/JPY pair on the M30 timeframe presents a Potential Buying Opportunity due to a recent breakout from a Triangle Pattern. This suggests a shift in momentum towards the upside and a higher likelihood of further advances in the coming hours.
Possible Long Trade:
Entry: Consider Entering A Long Position Above The Broken Trendline Of The Triangle After Confirmation. Ideally, This Would Be Around 91.65
Target Levels:
1st Resistance – 92.11
2nd Resistance – 92.34
Your likes and comments are incredibly motivating and will encourage me to share more analysis with you.
Best Regards, KABHI FOREX TRADING
Thank you.

XAUUSDgold is fall almost over 2700 pip from 2780 right aftre the election day on usa, my analysis may easy to understand hope fully. yesterday took a long and got out with 200 pip. looking for one lit down to bounce back long postion, depend how market move.
what you all think of today end of the week?
comment in below.

Fundamental Market Analysis for November 14, 2024 GBPUSDGBP/USD extends its decline to 1.26850 in Asian trading hours on Thursday. The US dollar (USD) rally to the highest level since November 2023 is putting pressure on the major pair. Later on Thursday, Bank of England (BoE) Governor Andrew Bailey will deliver a speech.
Data released by the US Department of Labor Statistics on Wednesday showed that the US Consumer Price Index (CPI) matched expectations, rising 2.6% year-on-year in October. Meanwhile, the core CPI, which excludes the more volatile food and energy categories, rose 3.3% y/y in October, matching the forecast. Markets expect the U.S. Federal Reserve (Fed) to continue cutting rates at its next meeting in December.
“The Consumer Price Index offered no surprises, so for now the Fed will continue to cut rates in December. However, next year is a different story given the uncertainty surrounding potential tariffs and other Trump administration measures,” said Ellen Zentner, chief economic strategist at Morgan Stanley Wealth Management.
Fed officials remain cautious about cutting rates. On Wednesday, Dallas Fed Chairwoman Laurie Logan said the U.S. central bank should be cautious about further interest rate cuts so as not to inadvertently ignite inflation. In addition, St. Louis Fed President Alberto Musalem said stagnant inflation figures make it difficult for the U.S. central bank to cut rates further. Traders are raising bets on another quarter percent rate cut in December, albeit at a slower pace, before mid-2025.
Trading recommendation: Trade predominantly with Sell orders from the current price level.

Fundamental Market Analysis for November 13, 2024 EURUSDThe Euro-dollar pair remains under pressure on Wednesday, holding just above the 1.06000 level during Asian trading hours. This will mark the fourth consecutive day of losses for the Euro as the pair continues to experience downward momentum.
The main factor contributing to the recent EUR/USD weakness is the strength of the US Dollar (USD). The implementation of US President-elect Donald Trump's proposed fiscal policy could stimulate investment, increase government spending and boost labor demand. However, such a surge in economic activity could also increase inflation risks.
Minneapolis Fed President Neel Kashkari reiterated Tuesday that the central bank remains confident in its fight against transitory inflation, but cautioned that it is too early to declare complete victory. Kashkari also noted that the Fed will refrain from modeling the economic impact of Trump's policies until there is more clarity on the specifics of those policies.
Traders are now focused on the upcoming release of U.S. inflation data on Wednesday for further guidance on future U.S. policy. The core consumer price index (CPI) for October is expected to rise 2.6% year-over-year and core CPI is expected to rise 3.3%.
According to a recent study by the London School of Economics and Political Science, imposing 10 percent tariffs on all imported goods, as advocated by Trump, could have a 0.1 percent negative impact on European Union (EU) gross domestic product (GDP). This potential slowdown in economic growth in Europe could further reduce the Euro's momentum against the US Dollar.
Trading recommendation: Trade predominantly with Sell orders from the current price level.

Buy AUD/JPY BreakoutThe AUD/JPY pair on the M30 timeframe presents a Potential Buying Opportunity due to a recent breakout from a Triangle Pattern. This suggests a shift in momentum towards the upside and a higher likelihood of further advances in the coming hours.
Possible Long Trade:
Entry: Consider Entering A Long Position Above The Broken Trendline Of The Triangle After Confirmation. Ideally, This Would Be Around 101.15
Target Levels:
1st Resistance – 101.83
2nd Resistance – 102.30
Your likes and comments are incredibly motivating and will encourage me to share more analysis with you.
Best Regards, KABHI FOREX TRADING
Thank you.

Sell AUD/CAD @ Bearish FlagThe AUD/CAD pair on the M30 timeframe presents a potential selling opportunity due to a recent downward breakout from a well-defined Bearish Flag pattern. This suggests a shift in momentum towards the downside in the coming Hours.
Key Points:
Sell Entry: Consider entering a short position around the current price of 0.9140, positioned close to the breakout level. This offers an entry point near the perceived shift in momentum.
Target Levels:
1st Support – 0.9093
2nd Support – 0.9058
Your likes and comments are incredibly motivating and will encourage me to share more analysis with you.
Best Regards, KABHI FOREX TRADING
Thank you.
