#HEG ltd Cup & handle pattern 20-30% upmove dega kya?HEG ltd cmp 1882, market cap 7264 cr, company is leading manufacturer and exporter of graphite electrodes.
PE vs ROCE ratio is better as compared to another leading player graphite India. My concern is the fall in Operating margin trend. Holding% Dec'23 promoter 55.77( 59.62 Mar'21), FII 6.85(9.43 Mar'21), DII 8.85(7.41 Mar'21). Infact some new mutual fund players entered in feb'24 also so Mar'24 DII numbers should be up.
Technically the chart is making cup n handle kind of pattern on weekly time frame and breakout above 1931 can bring fast movement. Upside levels can be 1)2335 2) 2470 3) 2575 4) 2763(imp level) 5) 3108. Once 2763 is crossed I will bring sl of remaining qty at 2470 and try to ride the trend till 3661/4557.
Fundamental-analysis

Crowdstrike pushing towards all time highs!Crowdstrike has been in a strong upward trend since the beginning of 2023. Pullbacks were generally short-lived, and the trend accelerated early this year.
CRWD reached its ATH in March, surpassing the 300 mark it reached in 2021. A significant consolidation occurred after that, but it seems like the bulls have garnered sufficient strength to test 360 again, after failing to breach the level 2 weeks ago, and maybe push the stock to new highs. The stock's 7% jump after beating the Q1 earnings estimate proved to be a perfect launchpad for this, CRWD is now trading above the 50, 100 & 200 SMA again.
Should the 360 mark be broken, traders can start looking up to the 400$ mark.
Fundamentally speaking, the threat of novel cybersecurity attacks is unfortunately not going to go away. Black hats are developing smarter-than-ever malware. To the eyes of many, Crowdstrike's AI-boosted cloud-based cybersec solutions offer powerful counters to those threats, so it is probably unlikely that Crowdstrike will see a sharp drop in demand in the near future as companies and their IT-teams are still catching up. According to the IDC (International Data Corporation) GenAI (Generative AI) in the cybersecurity market is growing at a CAGR of 23.6% and projects that it will reach a $46.3 billion market value by 2027.
Stay safe out there and trade responsibly!

Sell EURAUD Channel BreakoutThe EUR/AUD pair on the M30 timeframe presents a potential selling opportunity due to a recent downward breakout from a well-defined Channel pattern. This suggests a shift in momentum towards the downside in the coming Hours.
Key Points:
Sell Entry: Consider entering a short position around the current price of 1.6336, positioned close to the breakout level. This offers an entry point near the perceived shift in momentum.
Target Levels:
1st Support – 1.6282
2nd Support – 1.6242
Stop-Loss: To manage risk, place a stop-loss order above 1.6390. This helps limit potential losses if the price unexpectedly reverses and breaks back upwards.
Thank you.

eurusd oportunutybacked with ism to provide momentum and liquidity fundamentals to determine the bias or the direction tech to execute 'enter' 'exit'

Gold : Buyers need weak data from USAFOREXCOM:XAUUSD
🌘Gold buyers trying with 2346 Support level which is in the past used as support and resistance level.
🟣Gold goes up past week because of GDP and Unemployment calims weak datas.
🔵The expectation todays JOLTs Job Openings from 8.488 decrease to 8.350 also
JOLTs Job Quits 3.329 decrease to 3.200.
🟡Decrease more than forcast Job Openings could effect to Consumer Confidence and Wage growth and Disposable Income.
🟢By the way Investors should consider to Quit job data because downtrend in Quit job
shows doubt in the labor market.
⚪Weaker conditions in the labor market may push FED to take less Hawkish stance on Intrest Rates.
🔶 Supoort levels: 2331 , 2321 💤Weak rsistance: 2339 🔷Resistance level: 2346

Sell GBP/USD Beairsh FlagThe GBP/USD pair on the M30 timeframe presents a potential selling opportunity due to a recent downward breakout from a well-defined Bearish Flag pattern. This suggests a shift in momentum towards the downside in the coming Hours.
Key Points:
Sell Entry : Consider entering a short position around the current price of 1.2710, positioned close to the breakout level. This offers an entry point near the perceived shift in momentum.
Target Levels:
1st Support – 1.2665
2nd Support – 1.2640
Stop-Loss: To manage risk, place a stop-loss order above 1.2760. This helps limit potential losses if the price unexpectedly reverses and breaks back upwards.
Thank you.

Sell XAUUSD Bearish ChannelThe XAU/USD pair on the M30 timeframe presents a potential selling opportunity due to a well-defined channel pattern. This suggests a shift in momentum towards the downside in the coming Hours.
Key Points:
Sell Entry: Consider entering a short position around the current price of 2343, positioned close to the Top of Channel level. This offers an entry point near the perceived shift in momentum.
Target Levels:
1st Support – 2320
2nd Support – 2311
Stop-Loss: To manage risk, place a stop-loss order above 2354. This helps limit potential losses if the price unexpectedly reverses and breaks back upwards.
Thank you.

Feg Token for Technichal & fundamentall is very BullishIm Bullish on Feg new token Buy & Hodl
Smartdefi launchpad soon
Chart is very Bullish

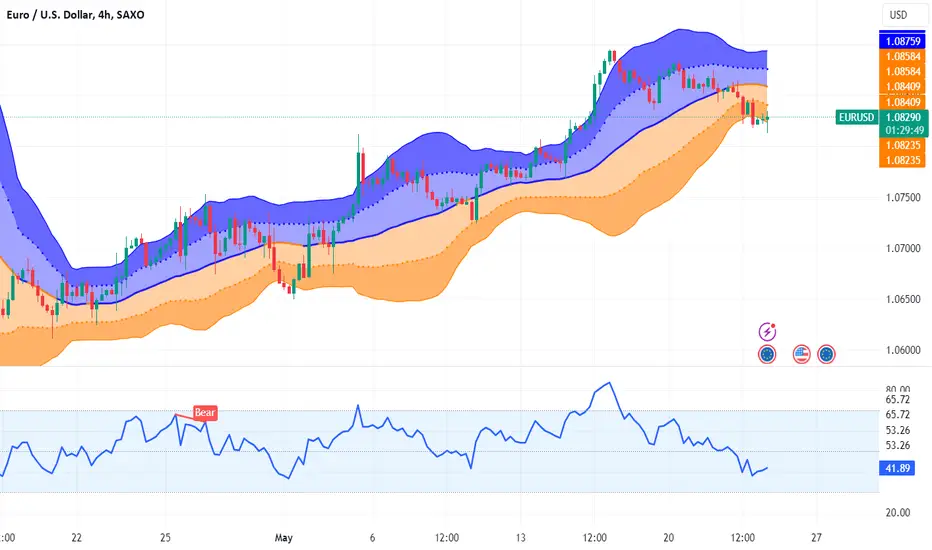
Sell EURUSD H4 Channel Breakout & Order BlockThe EUR/USD pair on the H4 timeframe presents a potential selling opportunity due to a recent downward breakout from a well-defined channel pattern. This suggests a shift in momentum towards the downside in the coming Hours.
Key Points:
Sell Entry: Consider entering a short position around the current price of 1.0820, positioned close to the breakout level. This offers an entry point near the perceived shift in momentum.
Target Levels:
1st Support – 1.0620
Stop-Loss: To manage risk, place a stop-loss order above 1.0900. This helps limit potential losses if the price unexpectedly reverses and breaks back upwards.
Opportunity Breakdown :
1. Bullish Channel Breakout & Retest
2. Price Reversal @ Fibo - 0.786
Market Factors:
Dovish ECB vs Hawkish Fed: The European Central Bank (ECB) is generally expected to maintain a dovish stance on interest rates, while the Federal Reserve might continue raising rates to combat inflation. This interest rate differential could weaken the EUR relative to the USD.
Weak Eurozone Data: Recent economic data releases from the Eurozone might have painted a weaker picture of the region's economic health, potentially undermining confidence in the Euro.
Thank you.

Sell GBPUSD ChannelKey Points:
Sell Entry: Consider entering a short position around the current price of 1.2750, positioned close to the breakout level. This offers an entry point near the perceived shift in momentum.
Target Levels:
1st Support – 1.2720
2nd Support – 1.2680
Stop-Loss: To manage risk, place a stop-loss order above 1.2810 This helps limit potential losses if the price unexpectedly reverses and breaks back upwards.
Thank you.

Fundamental Market Analysis for May 29, 2024 GBPUSDThe Pound-Dollar pair is trading with small losses near 1.27600 during the Asian session on Wednesday. A moderate recovery in the US Dollar (USD) and US yields amid lower expectations of a rate cut by the US Federal Reserve (Fed) in September is weighing on the major pair. Later on Wednesday, the Fed's Beige Book will be released and Fed Chief John Williams will deliver a speech.
Consumer confidence improved slightly in May, the Conference Board reported Tuesday. The gauge rose to 102.0 in May from 97.0 in April, beating an estimate of 95.9. However, U.S. consumers remain concerned about inflation, and many households believe interest rates will rise over the next year.
Meanwhile, US Federal Reserve officials made more hawkish comments, which generally helped to strengthen the dollar. Fed chief Michelle Bowman said Tuesday she would support either waiting for the pace of quantitative tightening to begin to slow or a more moderate process of rate cuts than was announced earlier this month. Minneapolis Fed President Neel Kashkari said the central bank should wait for significant progress on inflation before cutting interest rates, adding that he expects no more than two rate cuts in 2024.
On the other hand, the expectation that the Bank of England (BoE) will start cutting interest rates in June is dragging the Pound Sterling (GBP) down. The International Monetary Fund (IMF) raised its growth forecasts for the UK economy, but expected the Bank of England to cut rates two or three times. Amid a lack of important economic data releases from the UK, election speculation could boost GBP movement. Worries about political uncertainty may hurt the British pound and create a headwind for the GBP/USD pair.
Trading recommendation: Trade predominantly with Sell orders from the current price level.

Sell GBPCAD Bearish ChannelThe GBP/CAD pair on the M30 timeframe presents a potential selling opportunity due to a well-defined channel pattern. This suggests a shift in momentum towards the downside in the coming Hours.
Key Poin ts:
Sell Entry: Consider entering a short position around the current price of 1.7405, positioned close to the top of Channel. This offers an entry point near the perceived shift in momentum.
Target Levels:
1st Support – 1.7373
2nd Support – 1.7352
Stop-Loss: To manage risk, place a stop-loss order above 1.7425 This helps limit potential losses if the price unexpectedly reverses and breaks back upwards.
Thank you.

Premium BTCUSD Idea $$$ The BTCUSD pair is turning bullish as it breaks key resistance levels and trades near all-time highs. Institutional interest in Bitcoin, economic uncertainty, and its status as a hedge against inflation are driving this trend. As Tony Robbins said, "Setting goals is the first step in turning the invisible into the visible." Investors should seize the opportunity and capitalize on this bullish momentum.
"The only way to achieve greatness is to believe in yourself, take risks, and never give up."
entry - 67993.6
Target - 68876
SL - no sL at the moment but will give if asked
Like share and comment, don't forget hit follow button

BTCUSD, Price in a supply region- Market bears to take controlBTCUSD started an upward trend since 1st May from $56,542 to a last week's high of $71,940.
BTCUSD price is hovering around a supply region and the bears are warming up to take control at the resistance level of $70,000.
My bias is bearish.
Resistance $71,198 - $70,400
Support: $64,595

Pacific Industries Ltd Looking Good After Long CorrectionLooking Good For Long-Term Holding .
Good Fundamentals and Business Model
Stock is trading at 0.34 times its book value
CMP @ 215.30 AND BOOK VALUE @ 629
Quarterly Results Out as.....
Item YOY Mar 2024
Sales ⇡ 47% 59.6
EBIDT ⇡ 309% 5.34
Net profit ⇡ 186% 4.72
EPS ⇡ 187% ₹ 6.85
Positive factors
• Sustained Improvement in scale of operations marked by total operating income (TOI) above Rs.350 crore along with PBILDT
margin above 13% on sustained basis.
• Improvement in working capital cycle below 100 days.
Key strengths
Experienced and qualified management with strong group presence
Mr. Jagdish Prasad Agarwal, Chairman and Managing Director of PIL, has more than three decades of experience and looks after
overall affairs of the company. He is assisted by Mr. Kapil Agarwal, Executive Director, who has around 13 years of experience in
the industry. Further, the promoters are supported with the experienced second-tier management. The company belongs to
Udaipur based Geetanjali Group and group concerns include Ojaswi Marbles and Granites Private Limited, Geetanjali Marble,
Krishna Marble, Pacific Exports, Pacific Leasing and Research Limited, Yash Processors Private Limited, Pacific Iron manufacturing
Limited, Chaitanya international Mineral LLP and Geetanjali University.
As per the clarification submitted by PIL to stock exchange on February 21, 2023, Income Tax department has conducted inquiry
under section 132 and 133 of Income Tax Act, 1961 from February 16, 2023, to February 21, 2023. As conveyed by PIL’s
management to CARE Ratings, there have been no material findings from the inquiry conducted so far. As per disclosure made
to stock exchange, PIL will update stock exchange on material information of event, if any. CARE Ratings shall however continue
to monitor the developments of the case and its impact, if any on the credit profile of PIL.
Established track record of operations and diversified product portfolio
PIL was incorporated in the year 1989 and has a track record of more than three decades in the industry having established
relationship with its customers and suppliers. The company majorly exports its products to USA, Europe, Indonesia, Vietnam as
well as Middle East countries. Over the years, PIL has received various awards and certification, such as “Star Export House”
certification from the Ministry of Commerce and Industry, certificate of life member of All India Granite and Stone Association. It
also has membership of Centre for Development of Stones and Confederation of Export Unit.
Further, the company offers diversified products which includes variety of North Indian and South Indian granites in different
styles, color, size and pattern etc. Further, it has flexibility to manufacture different varieties of quartz slabs by blending resins
with quartz and other key materials to get slabs with desired colour, hardness and durability.
Location advantage with ease of availability of raw material and labour
PIL’s processing facility of granites is situated in Rajasthan and Karnataka which has the largest reserve of marbles & granites in
India with estimated reserves of 2075.64 crore cubic metres accounting of more than 91% of the total marble reserves of the
country. There are many units located in the cities of Rajasthan, Karnataka and Andhra Pradesh which are engaged in the business
of mining and processing of marbles and granites. Further, skilled labour is also easily available by virtue of it being situated in
the marble & granite belt of India.
Moderate profitability albeit moderation in scale of operations
PIL’s Total operating income (TOI) declined by 35% y-o-y to Rs. 184.11 crores as against Rs.285.40 crore in FY22. The decline
was on account of decrease in quartz sales due to levying of anti-dumping duty in July 2022 by U.S. Department of Commerce
and no sales from trading of iron ore in FY23. The anti-dumping duty was subsequently reversed in January 2023. In 9MFY24,
PIL achieved sales of Rs. 134.93 crores. PBILDT margin of PIL moderated by 322 bps to 7.55% in FY23 as against 10.46% in
FY22 on account of higher raw material cost as well as lower absorption of overhead costs. However, in 9MFY24, PBILDT margin
improved to 13.94% on the back of lower manufacturing expenses.
Comfortable capital structure albeit moderate debt coverage indicators
The capital structure of PIL improved with overall gearing of 0.43x as on FY23 end (1.25x in FY22). Improvement in overall
gearing was on account of successful completion of rights issue of Rs.47.53 crore in February 2023 which resulted in augmentation
of networth base as well as reduction in o/s debt with repayment of USL from directors/ subsidiaries and repayment of working
capital borrowings. The debt coverage indicators however continued to remain moderate in FY23 due to lower profitability with
PBILDT interest coverage of 1.72x (4.50x in FY22) and total debt/ GCA of 5.53x (6.20x in FY22)

Fundamental Market Analysis for May 24, 2024 GBPUSDThe Pound-Dollar pair is losing momentum to recover near 1.26950 in the early Asian session on Friday. The major pair is declining after pulling back from a recent top near 1.27600 amid renewed demand for the US Dollar (USD). Later on Friday, data on US durable goods orders and Michigan consumer sentiment index will be released.
On Thursday, the flash PMI from the S&P Global Composite rose to 54.4 in May from 51.3 in April, beating the market consensus forecast of 51.1. The reading was the highest since April 2022. Meanwhile, the manufacturing PMI rose to 50.9 in April from the previous reading of 50.0. The services PMI for the same period improved to 54.8 from 51.3 previously. Both indicators were better than market expectations.
Rising input prices in the manufacturing sector indicate that inflation may pick up in the coming months, which could prompt the US Federal Reserve (Fed) to delay an interest rate cut this year. This, in turn, would provide some support for the US Dollar and create a headwind for the GBP/USD pair.
On the other hand, the UK CPI inflation report earlier this week caused investors to lower expectations for a Bank of England (BoE) rate cut next month. Investors believe that the probability of a first rate cut in August is almost 50%, and a quarter-point rate change will not be fully priced in until November.
Trading Recommendation: Watch the level of 1.27000, on the rebound take Sell positions.

📈 Focus on GOLD ( XAUUSD ) !www.tradingview.com
📈 Focus on XAUUSD!
🚀 On the H4 chart, XAUUSD has tested the significant 2370 resistance, which aligns with the golden Fibonacci ratio. Technically the market is still bullish.
🔼 If the price breaks above the 2370 resistance, the next target is 2395.
🔽 If a correction happens, the price might drop to 2330 and the 38.3 Fibonacci level.

Fundamental Market Analysis for May 23, 2024 EURUSDThe Euro-dollar pair is trying to halt its three-day losing streak, hovering around the 1.08200 mark during the Asian session on Thursday. The strengthening of the Euro against the US Dollar (USD) can be attributed to the latter's corrective movement. Investors are likely to await the Purchasing Managers' Index (PMI) data from the eurozone and Germany before turning their attention to the US PMI, which will be released later in the North American session on Thursday.
The eurozone manufacturing PMI is forecast to rise to 46.2 from 45.7 in May, while the services PMI is expected to show a slight increase to 53.5 from 53.3. Meanwhile, in the US, the manufacturing and services PMIs are expected to remain unchanged at 50.0 and 51.3 respectively.
The Euro could face challenges as the European Central Bank (ECB) is expected to consider lowering borrowing costs at its June meeting. This expectation is due to the current inflation rate in the Eurozone, which stands at 2.4%, very close to the ECB's target of 2.0%. President Christine Lagarde recently stated that such action in June is highly likely if data continues to support confidence that inflation will eventually align with the ECB's target over the medium term.
The US Dollar (USD) strengthened on Wednesday as the minutes of the latest Federal Open Market Committee (FOMC) meeting indicated hawkish sentiment towards Federal Reserve (Fed) policy. Fed policymakers expressed concern over the lack of progress on inflation, which has been more persistent than expected in early 2024. As a result, the Fed is hesitant to start cutting interest rates.
Trading recommendation: Trade mainly with Sell orders from the current price level.
LINKUSDT | MT Long H4 | Chainlink's Supply-Demand ZonePair: HTX:LINKUSDT
Timeframe: H4 - Medium Term (MT)
Direction: Long
Technical Confluences for Trade:
- Price have bounced off 61.8% Fibo retracement levels
- Price action is within two different parallel channels; 1 acts as a bottom channel support and the other is within a supply-demand zone channel
- Aiming for the 32.8% Fibo Retracement with 23.6% as the TP 1 level
Fundamental Confluences for Trade:
- Chainlink's progress has been remarkable and their latest application, Transporter allows users to move crypto assets and data across multiple networks.
- Further escalation of war risk may see risk assets get affected
Suggested Trade:
Entry @ Area of Interest 12.90 - 13.50
SL @ 11.59
TP 1 @ 14.48 (Close Half-Position & move SL to Entry level once TP1 is achieved)
TP 2 @ 16.03
Risk-to-Reward @ Approx. 2.26 (Depending on Entry Level)
May the pips move in our favor! Good luck! :D
*This trade suggestion is provided on an advisory basis. Any trade decisions made based on this suggestion is a personal decision and am not responsible for any losses derived from it.

US30 neutral 1. we are currently consolidating in a tight controlled price range - this clearly illustrates to me that we are waiting a big price move soon (most likely after the high impact new releases today)
2. i believe a break below the line below wil lead to a bullish continuation upwards or a break below the line above will lead to a short term bearish break down of price to the downside.
Always maintain a open mindset about the outcome of news as nothing is guareteed in the trading market at any time

📈Ethereum: Awaiting ETF Approval📣🔍Let's dive into today's analysis. Today's focus is on ETH, which recently experienced a 28% pump in anticipation of the potential approval of an Ethereum ETF. As I mentioned in my previous analysis, breaking the $2964 level was crucial, and it provided a strong trigger for opening a position, leading to a 28% gain with a high risk-to-reward ratio.
📰Today, the final decision regarding the ETF is expected to be announced. If approved, Ethereum could see another pump, potentially surpassing the $4063 level and aiming for its all-time high (ATH) around $4600. However, if the ETF is not approved, Ethereum is likely to dump, possibly losing the $2880 support level amid market fear and excitement, which would be bad news for ETH holders. Personally, I believe the ETF is more likely to be approved, leading to another pump in Ethereum's chart.
🔔The announcement is just a few hours away. If you believe the ETF will be approved, I suggest moving to lower timeframes, finding a trigger based on your strategy, and opening a long position. Conversely, if you think the ETF will not be approved, you can apply the same approach for a short position.
📈Ignoring the ETF news and focusing purely on technicals, the RSI is significantly overbought, reaching as high as 89. This indicates high market excitement, and the RSI is now starting to come down but hasn't exited the overbought territory yet. There is a high probability of range-bound movement until the price meets the SMA25, potentially forming a box near $3798. After the SMA25 convergence, we might see renewed momentum. If the price breaks $3798 sooner, it would be even better as the resistance would be broken with more bullish momentum, allowing the price to move up more smoothly and with fewer candles.
🚀For long position targets, consider the $4063 resistance as the first target. If this resistance is surpassed, the next target would be the $4600 ATH.
📉For shorts, as long as the volume of red candles continues to decrease, I wouldn't consider shorting. To short, wait for the SMA25 to reach the candles, and if the bottom of the box breaks with increased selling volume, you could enter a risky short position. Given this would be against the primary market momentum, you should take profits quickly.
💣The main short position to watch for a complete trend reversal would be the break of the $2880 support level.
📝In conclusion, Ethereum is at a critical juncture with the potential ETF approval news imminent. If approved, we could see significant bullish movement towards and beyond $4063, aiming for the ATH around $4600. On the other hand, if not approved, Ethereum might experience a notable drop, potentially losing the $2880 support. From a technical perspective, watch the RSI and SMA25 interactions closely, and plan your trades based on the key levels and volume confirmations mentioned above. Always stay informed and be ready to adjust your strategy based on market developments.

Sell GBPUSD CPI DataThe GBP/USD pair on the M30 timeframe presents a potential shorting opportunity due to a recent breakout from a wedge pattern.
Possible Short Trade :
Entry: Consider entering a short position (selling GBP/USD) below the broken support trendline of the wedge after confirmation. Ideally, this would be around 1.2720 or lower if the price continues to decline.
Target Levels:
1.2678: This target is achieved by measuring the height of the wedge (from its apex to the breakout point) and projecting it downwards from the breakout point.
1.2650: This is a further extension of the downside target, based on the height of the recent price movement before the breakout.
Stop-Loss: Once the entry point is confirmed, place a stop-loss order above the broken support line of the wedge, ideally with some buffer around 1.2730. This helps limit potential losses if the price unexpectedly reverses and breaks back upwards.
Thank you.

What's next for Silver and Gold?OANDA:XAGUSD
OANDA:XAUUSD
TVC:DXY
Finally 😎 Silver broke through $30.
So what's next?
Long-term: I would say there is nothing on its way to go for $50. BUT, what would support Silver to go for $50? where's the demand for silver? How would supply change in the coming years? ....
I would say, let's not get ahead of ourselves and focus on what's going on now, then I try to prepare a separate post for the reasons I have for staying bullish on silver in the coming years.
Short-term: As you might have noticed, on 15 May, after the US Fed announced the CPI data, silver started its rally to $30. The recent CPI y/y data came out at the expected level of 3.4% and the CPI m/m was at 0.3% which was lower than the market expectations. So, Fed Chair Jerome Powell continued his recent interviews with a dovish tone which signals that we are very close to a rate cut **. For now, the first rate cut is expected to happen in September.
Long story short, gold and silver are pricing in the rate cuts now as this sentiment pulling DXY down. So, in the short-term , I would like to see Silver between $33.6 - $36.4 and Gold entering the $2580 - $2650 area. In the meantime, DXY can reach to 103. I have highlighted these areas on the chart 😊.
** Watch out for unemployment numbers as the Fed shifts its focus on that. If you are a day trader, you can expect higher volatility around unemployment news than before and you expect this number to have a higher impact on the longer-term trends of DXY.
** Also, keep that in mind, if they want to normalize the 3% inflation rather than 2%, it means we can expect higher levels of interest rates for a longer period of time.
