Fundamental Market Analysis for June 13, 2025 EURUSDEvents to pay attention today:
12:00 EET. EUR - Foreign trade balance
17:00 EET. USD - University of Michigan Consumer Sentiment Index
EURUSD :
EUR/USD interrupted its four-day winning streak, retreating from 1.16310, its highest level since October 2021, and is currently trading around 1.15300 in Asian hours on Friday. The pair is depreciating as the US dollar (USD) gains support as traders shift to increased demand for safe-haven assets due to rising tensions in the Middle East.
Israel has attacked dozens of targets across Iran to eliminate its nuclear programme. Israeli Defence Minister Israel Katz said Israel could face a missile and drone strike after Israel's pre-emptive strike on Iran. Katz declared a special state of emergency in the country, Axios reports.
In addition, White House Secretary of State Marco Rubio issued a statement: ‘Tonight, Israel took unilateral action against Iran. We are not participating in strikes against Iran, and our top priority is to protect American troops in the region.’ ‘President Trump and the administration have taken all necessary measures to protect our troops and are in close contact with our regional partners.’ ‘Let me be clear: Iran should not target US interests or personnel,’ Rubio added.
However, the decline in the EUR/USD pair may be limited, as the US dollar (USD) may face difficulties after US President Donald Trump's new threat to extend steel tariffs from 23 June to imported ‘steel-derived products’ such as household appliances, e.g. dishwashers, washing machines, refrigerators, etc. The tariffs were initially introduced in March at 25% and then doubled to 50% for most countries. This is the second time that the scope of the duties has been expanded.
Trading recommendation: SELL 1.15300, SL 1.15500, TP 1.14400
Fundamental-analysis

GBP/JPY - Triangle Breakout (12.06.2025)The GBP/JPY Pair on the M30 timeframe presents a Potential Selling Opportunity due to a recent Formation of a Triangle Breakout Pattern. This suggests a shift in momentum towards the downside in the coming hours.
Possible Short Trade:
Entry: Consider Entering A Short Position around Trendline Of The Pattern.
Target Levels:
1st Support – 194.34
2nd Support – 193.76
🎁 Please hit the like button and
🎁 Leave a comment to support for My Post !
Your likes and comments are incredibly motivating and will encourage me to share more analysis with you.
Best Regards, KABHI_TA_TRADING
Thank you.
Disclosure: I am part of Trade Nation's Influencer program and receive a monthly fee for using their TradingView charts in my analysis.

DXY H4 – Dollar Weakens Ahead of PPI Release DXY H4 – Dollar Weakens Ahead of PPI Release | Is the Market Pricing in a Fed Pivot?
🌐 Macro & Fundamental Context
As we head into the New York session on June 12, the market’s attention shifts to one critical data point: the US PPI (Producer Price Index). Following the softer-than-expected CPI reading of 2.4% YoY (vs. 2.5% forecast), the Dollar Index (DXY) dropped sharply—signaling fading inflation pressure and reigniting rate cut expectations.
✅ Bearish Fundamentals Building for the USD:
CPI miss fuels Fed rate cut bets (currently ~65% chance for September per FedWatch Tool).
US Treasury yields are easing, reflecting the market’s pricing of a less aggressive Fed.
Risk assets rallying as capital flows rotate away from USD into gold, equities, and long-duration bonds.
If today’s PPI also comes in below forecast, it could confirm a deeper correction in DXY. Conversely, a surprise PPI upside might trigger a short-term pullback.
📉 Technical Analysis – H4 Timeframe
🔹 Overall Trend:
DXY is locked within a clearly defined descending channel, with a consistent Lower High – Lower Low structure holding since late May.
🔹 Key Technical Zones:
Short-term resistance: 98.548 – likely to act as a ceiling unless PPI surprises to the upside.
Immediate support: 97.966 – a break below opens the door toward the key support zone at 97.191, which aligns with previous FVG imbalance and multi-timeframe demand.
🔹 EMA Structure:
Price remains below all major EMAs (13 – 34 – 89 – 200), confirming persistent bearish pressure.
EMA13 is currently acting as dynamic resistance on H4, pressing down on price.
🧠 Market Sentiment & Flow Insight
Investors are rotating out of USD as inflation fears fade and Fed easing expectations increase.
Risk-on sentiment is returning, benefiting gold and stocks while weighing on DXY.
However, a hot PPI print could spook the market briefly, leading to a corrective bounce in the Dollar before the trend resumes.
🔍 Scenarios to Watch:
PPI comes in lower than expected:
DXY may retest 98.548 resistance and reject lower.
Next targets: 97.966 → 97.191
PPI surprises to the upside:
Technical bounce toward 98.5–98.8 possible.
But trend remains bearish unless price reclaims 99.2+ zone.
✅ Conclusion
DXY remains under pressure from both macro and technical angles. The PPI report will be the next catalyst that determines whether this is a short-term dip or the continuation of a broader USD downtrend.
🎯 Tactical view: Favour short positions on DXY if price bounces into resistance and PPI supports the disinflation narrative. Target: 97.1 and below.

Fundamental Market Analysis for June 12, 2025 USDJPYThe Japanese Yen (JPY) is strengthening for the second day in a row against a weakened US Dollar (USD) and is moving further away from the two-week low reached the day before. The market's initial reaction to news of trade talks between the US and China faded rather quickly after US President Donald Trump threatened new tariffs. This, along with rising geopolitical tensions, curbs investors' appetite for risky assets and maintains the yen's status as a safe-haven currency.
In addition, the yen is further supported by expectations that the Bank of Japan (BoJ) may tighten monetary conditions amid signs of rising inflation in Japan. On the other hand, the US Dollar looks vulnerable near one-month lows as weaker US consumer inflation data released on Wednesday confirmed expectations that the Federal Reserve (Fed) will resume its rate-cutting cycle in September. This, in turn, led the USD/JPY pair to fall below 143.50 in the last hour.
Trade recommendation: SELL 143.30, SL 144.30, TP 141.30

CORN.c CORN.c Short Trade Plan (Daily Timeframe)
📍 Trade Setup
Direction: Short
Entry: Instant / Current Market Price (CMP)
Stop Loss (SL): 465.97
Take Profit 1 (TP1): 403.36 (≈ 1:1 Risk-Reward)
Take Profit 2 (TP2): 387.00 (≈ 1:1.5 Risk-Reward)
📊 Technical Justification
Trend: Downtrend confirmed – price forming Lower Highs and Lower Lows.
Candle Pattern: Bearish shooting star near resistance – strong rejection signal.
🌽 Top 3 Bearish Fundamental Reasons
Favorable U.S. Weather Conditions
→ Ideal for crop growth → higher yield expectations → bearish pressure.
Weak Global Export Demand
→ Sluggish corn exports (e.g., China slowdown) → less global demand for U.S. corn.
Strong U.S. Dollar
→ Makes U.S. corn more expensive internationally → lowers export competitiveness.
🎯 Risk Management & Execution Plan
Risk-Reward (TP1): ~1:1
Risk-Reward (TP2): ~1:1.5
📌 Once TP1 is hit:
✅ Move SL to Entry (Breakeven) to protect capital and ride remaining position to TP2.

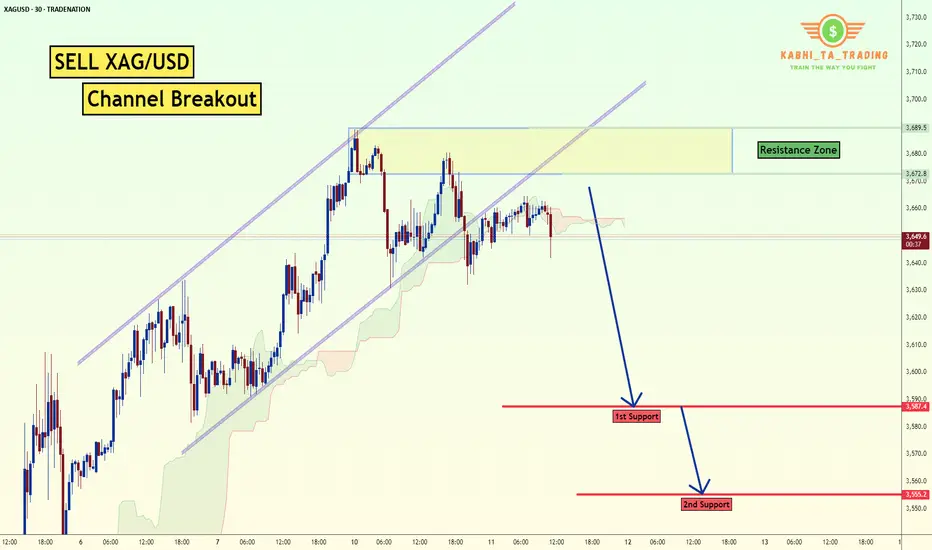
XAG/USD - Channel Breakout (11.06.2025) The XAG/USD Pair on the M30 timeframe presents a Potential Selling Opportunity due to a recent Formation of a CHannel Breakout Pattern. This suggests a shift in momentum towards the downside in the coming hours.
Possible Short Trade:
Entry: Consider Entering A Short Position around Trendline Of The Pattern.
Target Levels:
1st Support – 3587
2nd Support – 3555
🎁 Please hit the like button and
🎁 Leave a comment to support for My Post !
Your likes and comments are incredibly motivating and will encourage me to share more analysis with you.
Best Regards, KABHI_TA_TRADING
Thank you.
Disclosure: I am part of Trade Nation's Influencer program and receive a monthly fee for using their TradingView charts in my analysis.
Gold Extends Gains Post-CPI | All Eyes on PPI for the Next Move XAUUSD – Gold Extends Gains Post-CPI | All Eyes on PPI for the Next Move
🌍 Macro Pulse: CPI Sparks Momentum, But Will PPI Sustain It?
Gold surged following softer-than-expected US inflation data on Tuesday, with the CPI rising just 0.1% MoM and 2.4% YoY—both below forecasts. This triggered a broad sell-off in the USD, a pullback in Treasury yields, and a renewed appetite for non-yielding safe havens like gold.
Markets are now increasingly pricing in a rate cut by the Fed in September, adding further fuel to the rally. However, Wednesday’s US PPI data could either reinforce this bullish sentiment or reverse it sharply.
📉 Technical Landscape – H1 & H4 View
🔹 Trend Bias
The bullish structure remains intact, with price carving out higher highs and higher lows since the 3312 level. The recent breakout above 3370 confirms bullish momentum.
🔹 Price Channels
Gold continues to track within a defined ascending channel. A potential retest of the lower trendline near 3345–3350 could provide a dip-buying opportunity.
🔹 EMA Structure
The price trades comfortably above the 13, 34, 89, and 200 EMAs.
Short-term EMA crossovers are supportive of continued upside.
🔹 Critical Resistance Ahead: 3392 – 3395
A key technical zone combining Fibonacci extension levels and recent rejection wicks. A decisive break or rejection here will set the tone for the next 48 hours.
🧠 Market Psychology & PPI Scenarios
The market is currently optimistic, but still cautious. The PPI report due later today will likely serve as the next directional trigger:
If PPI prints below estimates → reinforces disinflation narrative → potential breakout above 3,400 with upside targets towards 3,420+.
If PPI comes in hot → raises concerns about sticky input costs → possible short-term reversal or consolidation.
Expect volatility to spike during the New York session.
🎯 Today’s Tactical Trade Setups – 12 June
🟢 Buy Zone: 3324 – 3322
Stop Loss: 3318
Take Profit Targets: 3330 – 3334 – 3338 – 3342 – 3346 – 3350
🟢 Buy Scalp Zone: 3337 – 3335
SL: 3330
TPs: 3341 – 3345 – 3350 – 3354 – 3360 – 3370 – 3380
🔴 Sell Zone: 3392 – 3394
Stop Loss: 3398
Take Profit Targets: 3388 – 3384 – 3380 – 3375 – 3370 – 3360 – 3350
✅ Final Take
Gold bulls are in control, but the PPI data will likely dictate whether momentum continues or stalls. With key resistance just ahead and macro risk on the table, this is not the time to trade blindly.
🧭 Strategy Tip: Let price confirm the reaction to PPI. Don’t pre-position into volatility. Play the breakout or the fade—but wait for clarity.

Gold Coiling in Rising Wedge Ahead of CPI: Breakout Imminent?XAUUSD – Gold Coiling in Rising Wedge Ahead of CPI: Breakout Imminent?
Gold (XAUUSD) is compressing within a well-defined rising wedge pattern on the 1H chart, signaling that a decisive move is near. With the U.S. CPI report due on June 12th, traders should prepare for volatility driven by macroeconomic catalysts. Whether gold breaks higher or reverses depends on how the market digests inflation data.
🌍 Macro Backdrop: All Eyes on Inflation
📌 U.S. CPI (June 12): A softer-than-expected reading could revive Fed rate cut expectations and send gold higher. A hotter-than-expected CPI could strengthen the U.S. dollar and Treasury yields, putting pressure on gold.
📌 U.S.–China Trade Sentiment: Diplomatic progress in trade talks reduces safe-haven demand in the short term, weakening gold's defensive appeal.
📌 DXY & Bond Yields: A breakout in DXY or a sharp rise in U.S. bond yields post-CPI may lead to a corrective leg lower in XAUUSD.
📈 Technical Overview – Multi-Layered Structure
Pattern: Gold is forming a rising wedge between higher lows and converging highs, typical of breakout scenarios.
Fibonacci Levels (retracement from 3,400 to 3,296):
0.382: 3,336 – intermediate support
0.618: 3,360 – significant resistance, near current swing highs
Moving Averages:
Price is currently above EMA34 and EMA89
Struggling below EMA200 (red), which acts as dynamic resistance
FVG Liquidity Zone: An open Fair Value Gap between 3,360 – 3,374 could act as a magnet before any reversal.
🎯 Trade Strategy Scenarios
🟢 Buy Scenario – Bounce from Support Zone
Entry: 3314 – 3312 | Stop-Loss: 3308 | Take-Profit: 3318, 3322, 3326, 3330, 3335, 3340
Ideal if CPI comes in lower than expected or aligns with a bullish technical rejection from wedge support.
🔴 Sell Scenario – Rejection from Resistance Zone
Entry: 3374 – 3376 | Stop-Loss: 3380 | Take-Profit: 3370, 3366, 3362, 3358, 3352, 3348, 3340
Valid if price taps into the upper liquidity zone (3,374–3,394) and fails to break, especially on CPI surprise to the upside.
🧠 Tactical Conclusion
A dovish CPI → favors BUY setup off lower wedge support
A hawkish CPI → favors SELL near upper resistance and liquidity zones
📌 The market is compressing and gearing up for a breakout. Patience is key — wait for confirmation at key zones and manage risk precisely.

Dollar Index Eyes FVG Breakout Ahead of CPIDXY 11/06 – Dollar Index Eyes FVG Breakout Ahead of CPI | Reversal Risk After 100.31?
The US Dollar Index (DXY) continues to consolidate within a rising channel on the H2 timeframe, with price tightening just ahead of a key macro event — the US CPI report. DXY is now approaching a critical Fair Value Gap (FVG) zone, where liquidity hunts and potential reversals become highly probable.
🌐 MACRO OUTLOOK & MARKET SENTIMENT
📌 US CPI (June 12):
The main macro driver for DXY this week.
A hotter-than-expected print → strengthens the Fed’s hawkish stance → DXY likely to spike.
A weaker-than-expected CPI → boosts rate cut expectations → downside pressure on DXY.
📌 Risk Sentiment:
Institutions are readjusting their exposure ahead of CPI and FOMC. This has caused DXY to hover near EMA89 — a sign of indecision.
📌 Cross-asset Flows (Bonds & Gold):
Treasury yields are stable, but surprises in CPI could lead to capital rotation between gold and USD, increasing volatility in XAUUSD and DXY simultaneously.
📈 TECHNICAL ANALYSIS
Trend Structure:
DXY is following a clean ascending channel on H2, with higher lows respecting the lower trendline.
EMA Confluence (13–34–89–200)
Price is consolidating near EMA89 and below EMA200 (99.40), forming a neutral short-term bias.
A clean breakout above EMA200 could trigger acceleration into the FVG zone.
Key FVG Zone (H2):
99.63 – 100.31 is an unfilled Fair Value Gap.
This zone may act as a magnet for price before any meaningful rejection or breakout.
Potential Reversal Area:
A rejection at 100.31 could trigger a sharp pullback toward the liquidity zone around 98.68.
🧠 STRATEGIC OUTLOOK
CPI will set the tone for DXY’s mid-term trend.
Watch the 99.63 – 100.31 FVG zone for liquidity sweeps and potential rejection.
Wait for confirmation, not prediction — especially in macro-sensitive environments.

THE USD CAD PAIR USD/CAD 1H Chart – Busy with Levels but the Bias is Clear 📊✨
Multiple confluences pointing to bullish intent: trendline support, key demand zones, and clean higher lows. Despite the clutter, price is respecting structure. Watching for a clean break above recent highs to ride the buy-side liquidity sweep. Eyes on 1.38+ 📈
#ForexTrading #USDCAD #SmartMoney #TechnicalAnalysis"

BITCOIN chart updated Bitcoin Buy Signal Triggered ₿🚀
BTC showing strong bullish momentum after holding key support.
Entered long position on breakout above short-term resistance with volume confirmation.
Higher lows forming a solid base — structure favors continued upside.
Targeting the next resistance zone around , with stop loss below recent swing low.
Watching closely for follow-through and potential scaling opportunities.
Market sentiment improving — let's see if the bulls can take control.
#Bitcoin #BTCUSD #CryptoTrading #BuyTheDip #BreakoutTrade #CryptoSetup #BullishBias #PriceAction #TechnicalAnalysis"**

Fundamental Market Analysis for June 11, 2025 GBPUSDThe GBP/USD pair continues to decline to around 1.34750 during Wednesday's Asian trading session. The pound sterling (GBP) is weakening against the US dollar (USD) due to a weaker UK employment report. Later on Wednesday, attention will shift to the US Consumer Price Index (CPI) for May.
The ILO unemployment rate in the UK rose to 4.6% in the three months to April from 4.5% previously, the British Office for National Statistics said on Tuesday. The figure was in line with expectations. Meanwhile, the change in the number of applicants for unemployment benefits in May was 33,100, compared with -21,200 previously (revised from 5,200), which is below the consensus of 9,500.
In addition, average earnings excluding bonuses in the UK rose 5.2% year-on-year (3M YoY) in April, compared with a revised 5.5% increase in the previous reading. The market forecast was 5.4%. Average earnings including bonuses rose 5.3% over the same period after accelerating to a revised 5.6% in the quarter to March. The data fell short of the forecast of 5.5%.
These figures indicate that the UK labor market is losing momentum under pressure from tax increases and the minimum wage hike by the government. This, in turn, may put some pressure on the pound sterling in the near term. “This gradual slowdown in wage growth may reassure the Bank of England after inflation unexpectedly jumped to its highest level in more than a year last month,” said Paige Tao, an economist at PwC UK.
Trading recommendation: SELL 1.34800, SL 1.35100, TP 1.34100

Oil's Volatility Meets Fed's Patience: A Path to 1.3643?USDCAD – Oil's Volatility Meets Fed's Patience: A Path to 1.3643?
🌍 Macro Landscape: Diverging Monetary Paths & Oil's Influence
The USDCAD pair is currently navigating a complex environment shaped by diverging central bank policies and the significant influence of crude oil prices. While the Federal Reserve is signaling a "higher-for-longer" interest rate stance due to sticky inflation, the Bank of Canada (BoC) is in a more nuanced position, balancing inflation control with economic growth. This divergence creates a fundamental tailwind for the USD.
However, Canada's economy is heavily tied to commodity prices, especially crude oil. Recent volatility in oil markets can exert significant pressure on the Canadian dollar. If oil prices remain subdued or face downward pressure, it could exacerbate the CAD's weakness against the USD, amplifying the impact of policy divergence.
🏦 Central Bank Policy Divergence: Fed's Firmness vs. BoC's Caution
Federal Reserve: FOMC members continue to signal patience on rate cuts. Recent inflation data (PCE, CPI) shows persistent price pressure, particularly in the services sector, reinforcing the Fed's hawkish bias. This suggests the USD may retain its strength as higher rates attract capital.
Bank of Canada: The BoC, while having taken aggressive steps previously, might be more cautious in its future rate decisions. Any dovish undertones or hints at pausing rate hikes could weaken the CAD. Conversely, a resurgence in inflation or stronger economic data could prompt the BoC to maintain a firm stance.
This policy divergence, coupled with external factors like commodity prices, creates a fertile ground for significant moves in USDCAD.
🌐 Capital Flows: Safe-Haven Dynamics and Commodity Impact
Global capital flow models indicate a shift towards the US dollar as a preferred safe haven amidst geopolitical tensions and global economic uncertainties. While Gold remains a traditional hedge, the USD's yield advantage makes it an attractive destination for institutional capital.
For CAD, its sensitivity to commodity prices means that capital flows are heavily influenced by the outlook for global growth and energy demand. A softening global economic outlook could lead to reduced demand for commodities, weighing on the CAD, and potentially driving inflows into USD-based assets.
📊 Technical Structure: Channel Breakdown & Bearish Momentum Towards 1.3643
On the H1 chart (as observed from the provided image):
Price Channel: USDCAD has been trading within a clear ascending channel. However, the price recently broke below the lower boundary of this channel, suggesting a potential shift in momentum from bullish to bearish.
Moving Averages: The price has moved below the EMA 13 – 34 – 89. This bearish alignment (EMA "fan-out formation" in reverse) confirms a short-term bearish momentum is building. The 200 EMA (red line) is currently acting as a key resistance level, near the prior support turned resistance.
Key Resistance (Sell Zone): The region around 1.36989 (aligning with previous support and possibly a Fibonacci retracement level) is now acting as a crucial resistance. Any retest of this zone, especially with bearish candlestick patterns, could offer selling opportunities. The 200 EMA reinforces this zone as a strong overhead barrier.
Key Support (Target Zone): The price is projected towards 1.36431. This level aligns with a strong prior support and also coincides with the Fibonacci Extension 1.382 level from a previous swing, making it a high-probability target for bearish moves. A bounce from 1.36734 (a mid-channel support or Fibonacci level) could offer a temporary reprieve, but the overall technical structure points to the lower target.
🎯 Trade Strategy Recommendations
Scenario 1 – Sell the Pullback (Preferred):
Entry: 1.3685 – 1.3695 (retest of broken channel line/resistance near 1.36989, possibly confluence with 200 EMA).
Stop-Loss: 1.3720 (above recent swing high/channel top).
Take-Profit: 1.3673 (initial target) → 1.3643 (main target) → 1.3620.
Scenario 2 – Breakout Momentum Sell (if price consolidates below 1.3673):
Entry: 1.3670 (break below 1.36734 with strong bearish momentum).
Stop-Loss: 1.3690.
Take-Profit: 1.3643 → 1.3620.
⚠️ Key Events to Watch:
US PCE Price Index (upcoming data): If hotter-than-expected, this would reinforce the Fed’s hawkish tone and lift USD.
Canadian CPI (upcoming data): Cooler-than-expected inflation could prompt a more dovish stance from the BoC, weakening CAD.
Crude Oil Inventory/News: Any significant news or data regarding global oil supply/demand can directly impact CAD.

Storm Ahead? Key Level Breakout or Dangerous Reversal!USD/JPY: Storm Ahead? Key Level Breakout or Dangerous Reversal!
Overview:
The USD/JPY pair stands at a crucial crossroads, with technical signals indicating the potential for significant volatility in the near term. Will the Yen regain its footing, or will pressure from the USD continue to push the pair to new highs? This analysis delves into technical, fundamental, and macroeconomic factors to outline potential scenarios and identify key trading zones.
Detailed Technical Analysis:
Primary Trend: The USD/JPY chart clearly shows a short-term uptrend, supported by an ascending trendline (dashed line on the chart) and upward-sloping moving averages (MA). Trend analysis is considered the most important area of technical analysis, and is key to determining the general direction of a security. However, the price is approaching strong resistance zones, suggesting potential selling pressure. Technical analysis is a trading tool used to evaluate stocks and attempt to predict their future movements by analyzing statistical data obtained from trading activity.
Key Price Levels:
Crucial Resistance Zone (SELL Zone): Around 144.894 - 145.178. This is a significant Fibonacci Extension zone (1.13 and 1.236), where the price has reacted in the past and could attract strong selling pressure. If the price breaks and holds above this zone, the uptrend will be confirmed.
Crucial Support Zone (BUY Zone): Around 143.600 - 143.750. This support zone is formed by previous lows and the ascending trendline. If the price corrects to this zone and shows reversal signals, it could be a good buying opportunity. The next support zone is around 142.800. The goal of technical analysis is to determine the buy and sell points of a stock.
Technical Indicators: The MAs (blue, orange, red) maintain a relatively consistent distance and are sloping upwards, supporting the uptrend. However, the convergence of MAs near resistance zones could signal a weakening of upward momentum.
Price Patterns: Currently, the price is forming a pattern similar to a bull flag or an ascending triangle, suggesting a potential continuation of the uptrend if it breaks upwards. Conversely, if the price fails to overcome resistance and breaks the uptrend line, a bearish reversal pattern could form. Wave analysis is a technique based on the observation that markets move in specific patterns called waves.
Relevant Fundamental and Economic Factors:
Macroeconomic Analysis (Japan): The Bank of Japan (BOJ) continues to maintain ultra-loose monetary policy, with negative interest rates and yield curve control. This exerts continuous downward pressure on the Yen. Any signal of change from the BOJ regarding policy will have a significant impact on USD/JPY.
Macroeconomic Analysis (United States): The U.S. Federal Reserve (FED) is still in an aggressive monetary tightening cycle to combat inflation. Inflation reports (CPI, PPI), employment data (NFP), and statements from FED officials will be key drivers for the USD. If U.S. inflation remains high, the FED may continue to raise interest rates, pushing USD/JPY higher. Fundamental analysis focuses on evaluating economic, political, and social factors affecting the value of a currency pair.
Upcoming Economic Events: Closely monitor inflation reports from both the U.S. and Japan, GDP data, unemployment rates, and policy meetings of the BOJ and FED. These events will act as catalysts for sharp movements.
Conclusion and Trading Recommendations:
USD/JPY is in an uptrend but approaching crucial resistance zones.
BUY
Entry: When the price breaks and closes above 145.178, confirming the uptrend continuation. Or when the price corrects to the 143.600 - 143.750 zone and shows bullish reversal candles (e.g., bullish engulfing, hammer).
Take Profit: Higher Fibonacci levels (e.g., 1.382 at 145.491 or 1.5 at 145.918).
Stop Loss: Below the nearest support zone, e.g., below 143.500 if buying at support, or below 144.800 if buying after a resistance breakout.
SELL Scenario:
Entry: When the price approaches the 144.894 - 145.178 zone and strong bearish reversal signals appear (e.g., Gravestone Doji, bearish engulfing, double top pattern).
Take Profit: Lower support levels, e.g., 143.700, 142.800.
Stop Loss: Above the resistance zone, e.g., above 145.300.
Risk Disclaimer: Financial markets always involve high risks. Always manage your capital carefully and never trade with money you cannot afford to lose. This analysis is for informational purposes only and not investment advice.

A Detailed Technical, Fundamental, and Macro AnalysisNZD/USD Trading Plan: A Detailed Technical, Fundamental, and Macro Analysis
1. Technical Analysis:
The 30-minute chart of NZD/USD highlights key price action within a well-defined channel between crucial support and resistance levels:
Resistance (0.60769): The price is testing significant resistance around 0.60769. If this level is broken, the price could continue higher, indicating further upward momentum.
Support (0.60271): A strong support level is found at 0.60271. If the price retraces and holds this level, a potential rebound could take place.
EMA (Exponential Moving Averages):
EMA 13 (Blue): Currently moving upwards, confirming a bullish short-term trend.
EMA 34 (Yellow) and EMA 89 (Red): These are trending sideways, suggesting that the market is in a consolidation phase, waiting for further signals.
2. Fundamental Analysis:
FED's Monetary Policy: The actions and statements of the Federal Reserve regarding interest rates have a significant impact on the USD. If the FED maintains or hikes rates, this could push the USD higher, putting downward pressure on NZD.
New Zealand Economic Indicators: The strength of New Zealand's economy, particularly export data, plays a vital role in supporting or weakening the NZD. Positive economic reports could support a bullish NZD.
3. Macroeconomic Analysis:
Global Risk Sentiment: Market sentiment is being influenced by global factors like trade tensions, economic growth projections, and political factors. A shift in risk sentiment, especially regarding the U.S. economy or geopolitical tensions, could lead to significant price movements in the NZD/USD pair.
4. Buy and Sell Zones:
BUY ZONE:
Entry: 0.60271 - 0.60300
SL (Stop Loss): 0.60200
TP (Take Profit): 0.60700 → 0.60769 → 0.60900
SELL ZONE:
Entry: 0.60750 - 0.60800
SL: 0.60900
TP: 0.60300 → 0.60200 → 0.60100
5. Strategy:
Buy Orders: If price consolidates at the support level of 0.60271 and shows confirmation with EMA indicators, consider a buy with a target at 0.60769.
Sell Orders: If price fails to break through the resistance at 0.60769, a sell order could be placed, targeting the 0.60271 support level.
6. Market Sentiment:
The market is highly sensitive to news and economic reports, and therefore, it is essential to remain alert to potential volatility. Any major economic release from New Zealand or U.S. Federal Reserve news could significantly influence the pair.

WILL GOLD CONTINUE ITS RALLY OR FACE A MAJOR CORRECTION? XAUUSD – WILL GOLD CONTINUE ITS RALLY OR FACE A MAJOR CORRECTION?
Gold is at a pivotal point after experiencing a significant correction following its recent rally. With the market showing mixed signals, the question now is whether gold will continue its upward trajectory or experience further corrections before breaking new highs. The current global economic climate, combined with macroeconomic factors, will be the driving forces behind gold's next move.
🌍 MACROECONOMIC OUTLOOK & MARKET SENTIMENT
US Dollar Strength: The USD has been strengthening, which has put some pressure on gold prices. However, this comes amid uncertainty in global trade relations, particularly between the US and China, which is creating mixed market sentiment. Gold remains a key asset for hedging against currency risks and geopolitical tensions.
Federal Reserve's Stance on Interest Rates: The Fed has signaled that while inflation remains a concern, it’s unlikely to cut interest rates in the near future. This could limit gold's upside potential in the short term, but the metal remains attractive due to its safe-haven status.
Geopolitical Tensions: With ongoing concerns over US-China trade talks and tensions surrounding Ukraine, investors continue to flock to gold as a hedge against political and economic instability. These external pressures continue to fuel demand for gold.
📈 TECHNICAL ANALYSIS (H1 – EMA 13/34/89/200)
Current Correction: Gold has been correcting after a strong surge, testing key support levels like 3300. On the H1 timeframe, the EMA indicators suggest consolidation and weakness, signaling that further pullbacks are possible before any potential breakout.
Technical Pattern – "Flag" Formation: Gold is forming a bearish flag pattern, indicating a temporary pause after a strong upward trend. This pattern suggests that gold might continue to trade sideways, with a breakout above key resistance levels leading to a continuation of the uptrend.
Key Resistance and Support Levels: Gold is facing significant resistance levels at 3320 and 3330, while key support levels at 3300 and 3270 will be crucial to watch in the coming sessions.
📍 KEY LEVELS TO WATCH
Resistance Levels: 3320 – 3330 – 3338 – 3350 – 3360
Support Levels: 3300 – 3270 – 3250
🧭 RECOMMENDED TRADE SETUPS
🔵 BUY ZONE: 3270 – 3272
SL: 3265
TP: 3280 → 3300 → 3320 → 3330 → 3350
🔻 SELL ZONE: 3320 – 3325
SL: 3330
TP: 3310 → 3295 → 3280 → 3265
✅ SUMMARY
Gold is currently experiencing a correction after a solid rally, but the long-term outlook remains bullish. Macro-economic factors, including the Fed’s policies and geopolitical risks, are likely to drive gold prices higher in the future. However, short-term fluctuations should be expected as the market tests key resistance and support levels.
Traders should focus on well-defined entry and exit points within these key levels and maintain a disciplined risk management strategy.

Fundamental Market Analysis for June 10, 2025 EURUSDAn Event to pay attention today:
13:00 EET. USD - NFIB Small Business Optimism Index
EURUSD:
The EUR/USD pair is struggling to capitalise on the previous day's gains and is attracting new sellers around 1.1435 during Tuesday's Asian session. The intraday decline is driven by solid demand for the US dollar (USD) and has pushed spot prices below 1.1400 in the last hour.
Friday's US non-farm payrolls (NFP) report, which showed higher-than-expected data, dampened hopes for an early interest rate cut by the Federal Reserve (Fed) this year. This, along with optimism about the resumption of trade talks between the US and China, is prompting traders to ease their bearish bets on the US dollar, which is proving to be a key factor putting pressure on the EUR/USD pair. However, as negotiations continued into a second day in London, traders may refrain from aggressive directional bets.
In addition, traders still see a rate cut by the US central bank in September as more likely. This, along with concerns about the financial health of the US government, may limit further strengthening of the US dollar and provide support for the EUR/USD pair. In contrast, the European Central Bank (ECB) hinted at the end of its rate-cutting cycle at its meeting last week. This could further benefit the single currency and help limit losses for the currency pair.
Traders may also refrain from aggressive betting ahead of this week's US inflation data release.
Trading recommendation: SELL 1.1390, SL 1.1410, TP 1.1300

USD/CAD - Channel Breakout (10.06.2025)The USD/CAD pair on the M30 timeframe presents a Potential Buying Opportunity due to a recent Formation of a Channel Breakout Pattern. This suggests a shift in momentum towards the upside and a higher likelihood of further advances in the coming hours.
Possible Long Trade:
Entry: Consider Entering A Long Position around Trendline Of The Pattern.
Target Levels:
1st Resistance – 1.3757
2nd Resistance – 1.3792
🎁 Please hit the like button and
🎁 Leave a comment to support for My Post !
Your likes and comments are incredibly motivating and will encourage me to share more analysis with you.
Best Regards, KABHI_TA_TRADING
Thank you.
Disclosure: I am part of Trade Nation's Influencer program and receive a monthly fee for using their TradingView charts in my analysis.

WILL EUR CONTINUE TO RALLY AHEAD OF THE IMPORTANT NFP DATA?EUR/USD – WILL EUR CONTINUE TO RALLY AHEAD OF THE IMPORTANT NFP DATA?
📈 EUR/USD IS AT A CRITICAL POINT AHEAD OF KEY ECONOMIC DATA
Amid the ongoing pressure on the US Dollar and macroeconomic factors supporting the Euro, EUR/USD might continue its short-term bullish trend. However, key data such as US CPI and central bank meetings could determine the direction for this currency pair moving forward.
🌍 Macroeconomic Overview & Market Sentiment
USD & DXY: The US Dollar continues to weaken due to signals from the Federal Reserve (Fed) that they are not in a hurry to cut interest rates. DXY has fallen below the 99 level, with macroeconomic factors showing a continued bearish trend for the USD.
Eurozone: The ECB (European Central Bank) is maintaining a slightly tight monetary policy. However, the Eurozone economy is showing signs of recovery, with positive data from the region.
US Economy: Forecasts for the US labor market data could impact the USD and lead to volatility in the EUR/USD pair. All attention is on the reports from the US this week.
📊 Technical Analysis (H1 – H4 – D1)
EMA 13/34/89/200: The EMA indicators on the H1 and H4 timeframes support the current bullish trend for EUR/USD in the short term. In particular, the EMA 13 and EMA 34 are crossing above the EMA 200, signaling a strong upward trend.
Wave Structure: EUR/USD is currently in a corrective wave after testing the strong resistance level at 1.1450. A recovery signal is emerging around the support level at 1.1380, which could present a buying opportunity in the short term.
Fibonacci Expansion: The Fibonacci extension levels at 1.1470 and 1.1490 could be the next targets if EUR/USD breaks through the 1.1400 resistance zone.
⚡ Key Levels to Watch
Resistance: 1.1450, 1.1470, 1.1490, 1.1500
Support: 1.1380, 1.1350, 1.1320, 1.1300
🧭 Trading Scenario
🔵 BUY ZONE: 1.1380 – 1.1365
SL: 1.1340
TP: 1.1420 → 1.1450 → 1.1470 → 1.1490
🔻 SELL ZONE: 1.1450 – 1.1460
SL: 1.1475
TP: 1.1420 → 1.1400 → 1.1370 → 1.1350
✅ Summary
EUR/USD is currently in a short-term bullish trend and could continue to rise if the support at 1.1365 holds. However, key economic data from the US, especially CPI and central bank meetings from the Fed and ECB, could impact the next direction for this pair. Traders should keep an eye on important support and resistance levels to identify safe trading opportunities.

Will the Trend Explode or Continue to Retrace? XAUUSD Trading Plan - Will the Trend Explode or Continue to Retrace? 🔥
📉 Current Situation:
Gold is currently undergoing a retracement after a strong increase at the beginning of the week. The market is being influenced by macroeconomic factors like the US-China trade negotiations and fluctuations in the US dollar. Gold may either continue its retracement or break out of the current price range.
🔧 Technical Analysis:
🔶 Key Levels:
🔶 Support Zone: 3,276.121 - 3,289.874. These zones are crucial in confirming the strength of the bullish trend.
🔶 Resistance Zone: 3,345.715, 3,363.845. If these levels are broken, gold could continue to rise sharply.
📊 Technical Indicators:
The Exponential Moving Averages (EMA) 13, 34, and 89 support the short-term bullish trend.
The trendline shows that the bullish trend is intact, but a slight correction may happen in the short term.
💼 Fundamental and Macro Analysis:
The US-China trade negotiations are the key drivers of market sentiment. If the negotiations yield positive news, gold could continue to rise. However, if concerns arise about tariffs or failed talks, gold could face pressure.
Key US economic indicators, such as PMI, GDP, and NFP, will play a crucial role in shaping the direction of the US dollar, and thus, the price of gold.
🎯 Trading Plan:
🔶 Buy Zone:
Entry Zone: 3,289.874 - 3,276.121
Stop Loss (SL): 3,269.000
Take Profit (TP):
TP 1: 3,302.000
TP 2: 3,317.000
TP 3: 3,327.000
TP 4: 3,340.000
🔶 Sell Zone:
Entry Zone: 3,345.715 - 3,363.845
Stop Loss (SL): 3,370.000
Take Profit (TP):
TP 1: 3,327.000
TP 2: 3,310.000
TP 3: 3,300.000
TP 4: 3,289.000
⚠️ Key Points to Watch:
🔒 Strong Support Zone: 3,289.874 represents a key support zone. If the price breaks below this level, we could see gold approach 3,276.121.
🔓 Strong Resistance Zone: 3,345.715 - 3,363.845 is the key resistance zone. If broken, gold could continue to rise to 3,380.000 or higher.
📈 Market Psychology:
Gold is in a retracement phase after a significant rise, but both technical and fundamental factors suggest that the bullish trend may continue. It is essential to closely monitor signals from the US-China trade negotiations and economic news affecting the US dollar.
💥 Conclusion:
Gold is in a retracement phase after a strong increase, but technical and fundamental factors indicate that a bullish recovery could be on the horizon. Prepare your trading plans based on key support and resistance levels.
📌 Good luck and happy trading to all!

Fundamental Market Analysis for June 9, 2025 USDJPYThe Japanese Yen (JPY) is rising at the start of the new week, reacting to upward revisions to Japan's first quarter GDP data. This comes amid signs of rising inflation in Japan and confirmation of bets that the Bank of Japan (BoJ) will continue to raise interest rates, which in turn provides a slight boost to the JPY. In addition, a modest decline in the US Dollar (USD) is putting some downward pressure on the USD/JPY pair during the Asian session.
For now, the Yen appears to have broken a two-day losing streak against its US counterpart, although traders may refrain from aggressive directional bets ahead of key US-China trade talks in London. In addition, stronger-than-expected US jobs data released on Friday dampened hopes that the Federal Reserve (Fed) will cut interest rates soon this year, which could serve as a tailwind for the dollar and limit USD/JPY pair losses.
Trade recommendation: SELL 143.85, SL 144.85, TP 141.85

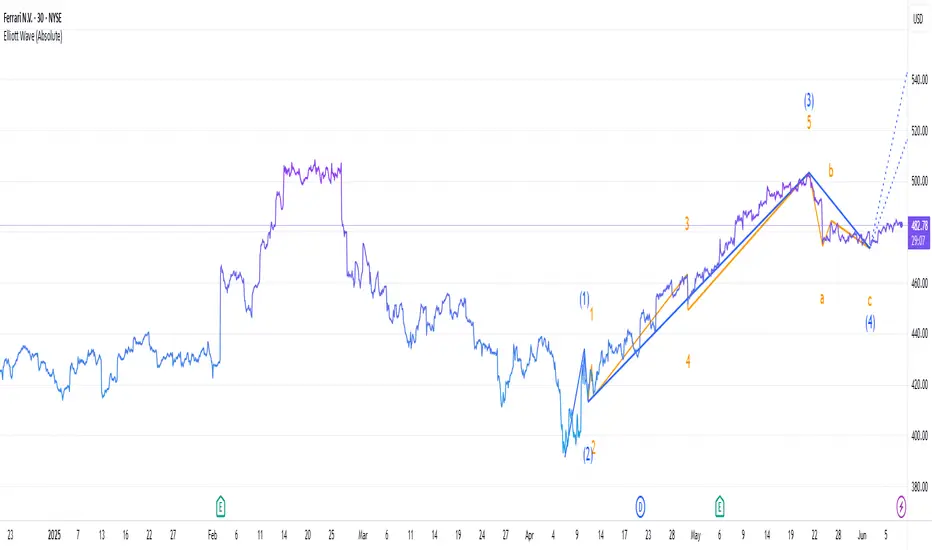
Is Ferrari's stock still bullish?Is Ferrari's stock still bullish?
Technical Outlook
Elliot Wave theory suggests a cautious bullish stance. The present correction seems to be a temporary setback, likely driven by guidance and tariff fears, but sets the stage for a potential rally to $520-$540 if support is not broken. However, risks of a deeper correction (i.e., to $420-$440) persist if pressures from the outside intensify.
The stock is currently trading above all three of its major EMA levels — daily, weekly, and monthly — that is a good technical signal. The rising daily EMA at 479.98 suggests that short-run momentum remains healthy. The weekly EMA at 461.77 provides medium-term support, while the monthly EMA at 421.08 supports the longer-term trend solidly.
Positive Sentiment Factors
Ferrari reported robust Q1 2025 results, with net revenues of €1.79 billion (up 13% YoY), an operating profit of €542 million (up 22.7%), and a net profit of €412 million (up 17%). Adjusted earnings per share were €2.30, surpassing analyst expectations of €2.28. This shows Ferrari’s strong pricing power and demand for personalized vehicles.
Analyst Sentiment: Optimism remains for Ferrari among some analysts. UBS raised its price target to $560 from $520, maintaining a Buy rating, with the new Ferrari Elettrica a major catalyst, the company said. Bernstein and RBC Capital maintained Outperform ratings on the stock at $575 and €500, respectively. Barclays upgraded Ferrari to Overweight, calling it a "safe haven" in a shaky European automotive environment.
Brand Strength and Strategic Positioning: Ferrari’s luxury brand and high demand for models like the Roma Spider, 296 GTS, SF90 XX, and Purosangue bolster its market position.
Neutral Sentiment Factors
Market and Industry Context: The broader market has been volatile due to trade developments and tariff relief rallies. Ferrari’s stock has been influenced by these macroeconomic factors, but its luxury positioning makes it less sensitive than mass-market automakers.
Formula 1 Performance: Ferrari’s underwhelming Formula 1 season, with McLaren significantly outscoring Ferrari in points poses some concern among investors. While this does not directly impact stock performance, it may indirectly affect brand sentiment among enthusiasts.
Negative Sentiment Factors
Tariff Concerns: Ferrari shares have been sensitive to Trump's U.S. tariff policies. A tariff increase would add up to $50,000 to the price of an average Ferrari, potentially cutting sales volumes in the U.S., which accounts for 28.8% of net sales. JPMorgan warned that tariff impacts might be "worse" for Ferrari, lowering the price target to $460 from $525
Conclusion
Ferrari stock has a bullish but cautious bias, supported by solid fundamentals, favorable technical momentum, and positive analyst sentiment on upcoming product releases such as the Ferrari Elettrica. Macro risks, however, including U.S. trade policy and market volatility, are still major overhangs.
USD/JPY - Triangle Breakout (06.06.2025)The USD/JPY pair on the M30 timeframe presents a Potential Buying Opportunity due to a recent Formation of a Triangle Pattern. This suggests a shift in momentum towards the upside and a higher likelihood of further advances in the coming hours.
Possible Long Trade:
Entry: Consider Entering A Long Position around Trendline Of The Pattern.
Target Levels:
1st Resistance – 144.94
2nd Resistance – 145.52
🎁 Please hit the like button and
🎁 Leave a comment to support for My Post !
Your likes and comments are incredibly motivating and will encourage me to share more analysis with you.
Best Regards, KABHI_TA_TRADING
Thank you.
Disclosure: I am part of Trade Nation's Influencer program and receive a monthly fee for using their TradingView charts in my analysis.
