Fundamental Market Analysis for May 29, 2025 GBPUSDEvent to pay attention today:
15:30 EET. USD - Initial jobless claims
22:00 EET. USD - Bank of England Governor Andrew Bailey will deliver a speech.
GBPUSD:
GBP/USD pared further gains on Wednesday, stumbling for the second session in a row and falling below 1.3500 after failing to regain 1.3600 earlier this week. Sterling markets are retreating from the upper limit of the bullish trend that lifted GBPUSD to multi-year highs, but the momentum remains favourable for sterling buyers.
The latest minutes of the Federal Reserve (Fed) interest rate meeting held on 6-7 May showed that the Fed's wait-and-see stance has deep roots. At the last Fed meeting, policymakers noted that the US dollar's (USD) status as a safe haven has suffered recently. They warned that a more ‘durable change’ in the dollar's status could have long-term consequences for the US economy.
Almost all FOMC members at the May rate meeting agreed that inflation risks could prove to be more ‘persistent than expected.’ Fed officials directly pointed to tariffs as a key factor in the FOMC's downgrade of its outlook for the US economy, and the FOMC blamed the Trump administration and its inconsistent tariff policy for the deterioration in the US economic situation and uncertain outlook for inflation and growth.
The rest of the trading week remains tense for the US. On Thursday, US gross domestic product (GDP) growth for the first quarter will be released. On Friday, the trading week will end with the release of US personal consumption expenditure (PCE) inflation data for April. Markets are hoping for a continued easing of key inflation indicators before the effects of the Trump administration's tariff policy begin to be reflected in the core data.
Trading recommendation: BUY 1.3450, SL 1.3430, TP 1.3540
Fundamental-analysis

GBP/USD Breakout (28.05.2025)The GBP/USD Pair on the M30 timeframe presents a Potential Selling Opportunity due to a recent Formation of a Breakout Pattern. This suggests a shift in momentum towards the downside in the coming hours.
Possible Short Trade:
Entry: Consider Entering A Short Position around Trendline Of The Pattern.
Target Levels:
1st Support – 1.3424
2nd Support – 1.3380
🎁 Please hit the like button and
🎁 Leave a comment to support for My Post !
Your likes and comments are incredibly motivating and will encourage me to share more analysis with you.
Best Regards, KABHI_TA_TRADING
Thank you.
Disclosure: I am part of Trade Nation's Influencer program and receive a monthly fee for using their TradingView charts in my analysis.

USDJPY PLAN – Will FOMC Be the Next Big Catalyst?USDJPY PLAN – Will FOMC Be the Next Big Catalyst?
💬 After several sessions of sideways movement, USDJPY is showing signs of a potential breakout, supported by both technical signals and macro fundamentals. As the FOMC meeting approaches, the market is poised for a major shift — making this the perfect time to prepare actionable trade plans.
🔍 TECHNICAL ANALYSIS
Primary Trend: Short-term bullish retracement within a broader downtrend – currently testing the 200 EMA on H2.
EMAs in use: EMA13 (black), EMA34 (orange), EMA89 (red) – effective dynamic support/resistance indicators.
Key Resistance Levels:
145.35: Major confluence zone with 0.618 Fibonacci and trendline resistance.
146.11 – 147.20: Previous highs and Fibonacci extension targets.
Key Support Zones:
144.61: EMA200 acting as immediate pressure point.
143.43 – 143.02: Crucial demand zone with strong reaction expected on pullback.
🌍 MACRO & FUNDAMENTAL FACTORS
FOMC Outlook: With recent CPI data softening and labor numbers moderating, markets anticipate a hold on rates. However, any hawkish tone from Chair Powell could trigger a sharp bullish move on USDJPY.
BOJ’s Dovish Stance: The Bank of Japan remains accommodative, showing no clear intent to hike rates. This weakens the Yen and supports mid-term upward momentum for USDJPY.
Interest Rate Differentials & Carry Trade Flows continue to drive volatility and directional bias in this pair.
🎯 TRADE SETUP SUGGESTION
If price breaks and sustains above 144.61 (EMA200): look to BUY on pullback toward 144.15–144.20, targeting 145.35 and 146.11.
If price gets rejected at 145.35: consider a short-term SELL toward 144.00 – 143.43 for a corrective leg.
⚠️ STRATEGY NOTE:
Avoid entering right at the time of the FOMC release. Wait for post-event confirmation. Prioritize strong breakouts or rejections, and manage risk carefully under volatile conditions.

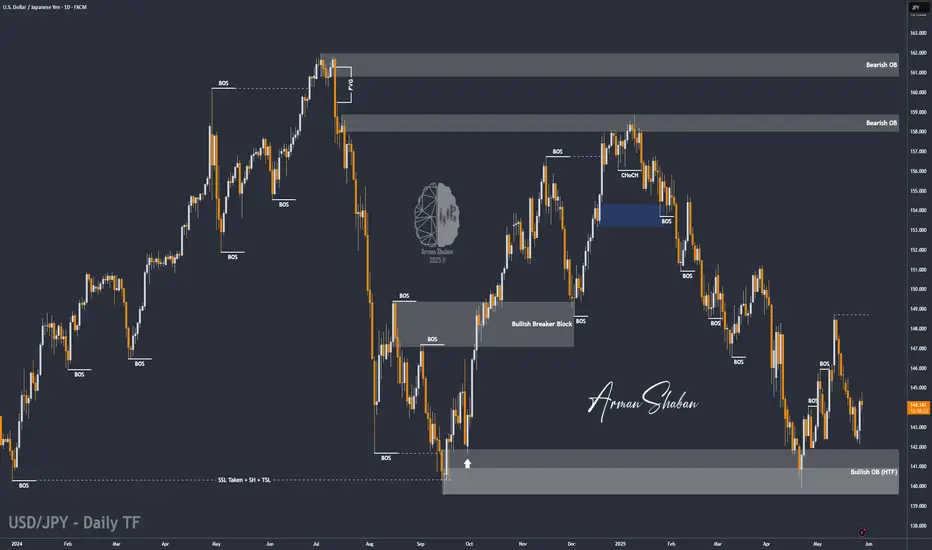
USD/JPY Poised for Upside: Momentum Building Toward Key TargetsBy examining the USD/JPY chart on the daily timeframe, we can see that the price is currently trading around 144. Given the momentum, I expect this pair to rise soon. The potential bullish targets are 145.5, 147.35, and 148.65 respectively.
Please support me with your likes and comments to motivate me to share more analysis with you and share your opinion about the possible trend of this chart with me !
Best Regards , Arman Shaban
Fundamental Market Analysis for May 28, 2025 EURUSDThe EUR/USD pair retreated below 1.1400 for the second consecutive day, helped by a recovery in the US Dollar (USD) following the release of a positive consumer confidence report.
Risk appetite increased as market participants digested the news that US President Donald Trump said that trade talks between the United States (US) and the European Union (EU) have gained momentum following his threats to impose 50 percent tariffs last Friday. Although he backtracked on his words, allowing some room for negotiations, it remains to be seen if the two sides will reach an agreement before July 9.
The convincing US consumer confidence data for May released by the Conference Board (CB) put pressure on EUR/USD. The US Dollar Index (DXY), which tracks the value of the US currency against the other six currencies, rose more than 0.62% to 99.54.
The ECB's Gediminas Simkus said he sees scope for an “interest rate cut in June”. Robert Holzmann, a member of Austria's central bank and a member of the ECB, told the Financial Times (FT) that he sees no reason to cut rates at the June and July policy meetings.
Trade recommendation: SELL 1.1265, SL 1.1365, TP 1.1065

Dive into the oil storm of 2025!In 2025, oil prices declined due to rising output from OPEC+ countries, growing inventories in the U.S., weakening global demand, a stronger dollar, and ongoing trade tensions between major economies. Further pressure came from OPEC+’s plan to boost production by 411,000 barrels per day — three times more than previously scheduled. A final decision is expected at the May 31 meeting. This move aims to strengthen the Alliance’s market position, particularly against U.S. shale producers, but it has deepened the supply-demand imbalance, pushing prices to their lowest levels in four years .
Despite current challenges, several factors could support a recovery in oil prices :
1. Rising demand in emerging markets : Developing economies are expected to continue increasing energy consumption as they grow, boosting oil demand.
2. Limited investment in production : Lower investment in exploration and drilling — especially in a low-price environment — may lead to tighter future supply, which can support prices.
3. Geopolitical risks : Conflicts and instability in oil-producing regions can disrupt supply chains, traditionally driving prices higher.
4. Slower non-OPEC+ output growth : While non-OPEC+ production is expected to rise in 2025, the U.S. Energy Information Administration forecasts slower growth in 2026, easing pressure on prices.
5. Possible OPEC+ output cuts : If the current production increase fails to deliver the desired results, OPEC+ may reverse course and reduce output to stabilize the market.
In 2025, the oil market is under strain due to surging OPEC+ output, inventory surpluses, weak global demand, and economic uncertainty. Yet, despite prices plunging to four-year lows, there’s still room for recovery. Future price trends will hinge on OPEC+ decisions, emerging market demand, geopolitical events, and investment patterns in the energy sector. The upcoming OPEC+ meeting could be a turning point for the entire market.

DXY OUTLOOK BEFORE FOMC | Will the Dollar Break Trend DXY OUTLOOK BEFORE FOMC | Will the Dollar Break Trend or Just Retrace?
The US Dollar Index (DXY) has rebounded after weeks of relentless selling pressure, but this bounce is now approaching key decision zones just ahead of two critical events: the April PCE report and the next FOMC meeting. With macro data and sentiment diverging, traders should closely monitor how the dollar reacts to upcoming catalysts.
🌍 MACRO & FUNDAMENTAL CONTEXT
Core PCE Price Index (Apr) – due Friday – is the Fed’s preferred inflation gauge. A higher-than-expected print may reinforce the “higher for longer” stance on rates.
FOMC Minutes revealed a growing divide within the committee: some members remain open to further tightening if inflation stalls.
Bond market stress is emerging again, as 10Y yields hover near 4.5%. Fiscal concerns and treasury auctions are weighing on investor sentiment.
Political noise – particularly from former President Trump’s shifting tariff threats – adds short-term volatility to USD expectations.
🧠 Bottom line: While the dollar has regained ground, macro risks remain asymmetric. A hot PCE may spark short-term demand for USD, but structural credibility risks are still on the table.
📊 TECHNICAL INSIGHT – H1 STRUCTURE
Price Channel: DXY broke slightly above a well-respected descending channel that started mid-May.
EMA Confluence: EMA 13, 34, and 89 are beginning to align upward but haven’t fully confirmed a bullish trend yet.
Key Retest Zone: 99.08 is a critical zone — a Fibonacci 38.2% level of the recent breakout. A hold here may support another test higher.
🔑 KEY TECHNICAL LEVELS
Immediate Support: 99.08 (Fib 38.2% + channel retest)
Mid Resistance: 100.02 (round number + previous structure high + near 200 EMA)
Major Target Zone: 100.48 (Fib 61.8% + multi-day pivot)
📈 POTENTIAL PRICE SCENARIOS
If DXY respects 99.08, a continuation toward 100.02 and even 100.48 is plausible as a technical correction.
If DXY fails to hold 99.08, the breakout above the trend channel may turn into a false break, opening the door for a re-test of lower channel support near 98.30.
Watch for price behavior around 100.02 — aggressive sellers may re-enter at this level, especially if macro data disappoints.
⚠️ STRATEGIC REMINDER
Avoid chasing mid-range price action.
Let the market reveal its hand post-PCE.
Volatility is expected to spike — be patient and let key levels define directional conviction.

Double Top Alert: Key Resistance at 1.3570 Before US PCE DataGBPUSD PLAN – MAY 27 | Double Top Alert: Key Resistance at 1.3570 Before US PCE Data
GBPUSD is currently testing a critical resistance zone near 1.3570, forming a potential Double Top pattern. As markets await this week’s US Core PCE inflation release, the pair may be at risk of a short-term pullback.
🌍 MACRO FUNDAMENTALS
USD Rebounds Slightly ahead of April’s PCE inflation report – a key Fed inflation gauge due this Friday.
GBP Under Pressure as dovish tones from Bank of England (BoE) officials signal a potential pause in rate hikes.
UK Political Uncertainty and sluggish EU-UK trade talks continue to dampen investor confidence in the pound.
📊 TECHNICAL ANALYSIS
Price Structure: GBPUSD surged from 1.3446 support but is now facing resistance near 1.3570, where a Double Top formation is emerging.
Key Levels:
Resistance: 1.3570 – 1.3580 (previous high and psychological barrier)
Support 1: 1.3496 (confluence of EMA89 and 38.2% Fibonacci retracement)
Support 2: 1.3446
Indicators:
EMA13, EMA34 show early signs of bearish crossover on the 30-minute chart.
RSI approaches overbought territory, hinting at potential bearish divergence.
🎯 TRADE SETUP (IF PRICE REJECTS 1.3570)
🔻 SELL SETUP
Entry: 1.3570 – 1.3550
Stop-Loss: 1.3595
Take-Profit Targets:
TP1: 1.3496
TP2: 1.3446
📌 A bullish breakout only becomes valid if price closes strongly above 1.3590 on the H1 chart.
🧠 STRATEGIC NOTES
Wait for a clear reaction or bearish confirmation near 1.3570 before entering trades.
Avoid chasing trades mid-range; focus on clean breakouts or rejections.
PCE data may trigger volatility — manage risk tightly and prepare for directional momentum.
👉 What do you think of this Double Top scenario? Will GBPUSD reject or break through resistance? Drop your analysis below and follow for daily structured plans!

SELLERS TAKE CONTROL – BUYERS WAITING BELOW 3300? XAUUSD TRADING PLAN – 27/05 | SELLERS TAKE CONTROL – BUYERS WAITING BELOW 3300?
Gold has sharply reversed after failing to break through the key 3364 – 3366 resistance zone. Price action now suggests a corrective structure is in play, potentially setting the stage for further downside before NFP week.
🌍 MACRO & FUNDAMENTAL CONTEXT
The Federal Reserve maintains a hawkish stance with U.S. 10-year yields holding above 4.5%, placing short-term pressure on safe-haven assets like gold.
U.S.–EU Trade Tensions have temporarily eased after Trump postponed 50% tariffs on EU goods until July 9. However, this pause may be short-lived, keeping geopolitical risk priced into gold.
Key data this week will influence market sentiment:
• U.S. Core PCE (April) – critical for inflation outlook
• EU HICP (May) – will shape ECB rate cut expectations for June
Gold remains caught between macro-driven demand and technical exhaustion — creating opportunities for range-based trading.
📉 TECHNICAL OUTLOOK (H1/H4)
Price broke below the rising trendline and is now trading under the EMA 13, 34, and 89, confirming a bearish shift in short-term momentum.
The 3284 – 3286 region aligns with a previous Fair Value Gap (FVG), EMA200 (H4), and structural support — a strong potential buy zone.
If this level fails, deeper pullback toward the 3247 – 3250 region (major FVG zone) becomes likely.
🔑 TRADE SETUP ZONES
🟢 PRIMARY BUY ZONE:
Entry: 3286 – 3284
Stop-Loss: 3280
Take-Profit: 3290 → 3294 → 3298 → 3302 → 3310 → 3320
🟢 BUY SCALP:
Entry: 3298 – 3296
Stop-Loss: 3292
Take-Profit: 3302 → 3306 → 3310 → 3314 → 3320 → 3330
🔴 SELL SCALP:
Entry: 3346 – 3348
Stop-Loss: 3350
Take-Profit: 3342 → 3338 → 3334 → 3330 → 3320 → 3310
🔴 STRONG SELL ZONE:
Entry: 3364 – 3366
Stop-Loss: 3370
Take-Profit: 3360 → 3356 → 3352 → 3348 → 3344 → 3340 → 3330
⚠️ STRATEGIC INSIGHTS
Selling on retracements below 3348 is favorable unless a strong breakout above 3366 occurs.
Buying is only valid near 3284 with confirmation of bullish structure (EMA support bounce or bullish engulfing pattern).
Avoid trading the mid-range between 3310–3330 unless a clear reversal setup forms — price action here remains noisy and indecisive.

Fundamental Market Analysis for May 27, 2025 USDJPYThe Japanese yen (JPY) is attracting fresh buyers in Tuesday's Asian session following the release of strong inflation data. Additionally, comments from Bank of Japan Governor Kazuo Ueda left the door open for further policy tightening by the central bank. This is in sharp contrast to expectations that the Federal Reserve (Fed) will continue to cut interest rates this year, and is proving to be a key factor that is providing a nice lift for the yen.
In addition, persistent geopolitical risks related to the protracted war between Russia and Ukraine and conflicts in the Middle East are contributing to the yen's safe haven status. The US dollar (USD), on the other hand, remains near its lowest level since April 22 amid concerns over the deteriorating US fiscal situation. This contributes to the USD/JPY pair's fall to 142.000, or more than a one-month low, and supports the prospects for further losses.
Trading recommendation: SELL 143.300, SL 143.900, TP 142.000

xau live trade and educational breakdown Gold hold on to higher ground above $3,330
Despite last week's significant climb, Gold has begun the week on the back foot, with gains restricted around $3,350 per troy ounce. The recent surge in market mood makes it difficult for XAU/USD to regain momentum. Monday is Memorial Day, thus financial markets in the United States will be closed.

USDJPY – Diverging Policies Drive Yen into Pressure Zone near 14USDJPY – Diverging Policies Drive Yen into Pressure Zone near 144
🌍 Macro Landscape: JPY Stuck Between Two Diverging Forces
In recent weeks, the US dollar has regained strength as the Federal Reserve remains committed to its "higher-for-longer" interest rate stance. On the flip side, the Bank of Japan (BoJ) is maintaining an ultra-loose monetary policy, widening the yield spread between the USD and JPY, and putting pressure on the yen.
The surge in US 10-year yields toward 4.5% is further dampening demand for JPY as a safe haven, prompting institutional capital outflows from the yen and inflows into USD-based assets.
🏦 Central Bank Policy Divergence: Fed Remains Firm, BoJ Stays Dovish
Federal Reserve: FOMC members continue to signal patience on rate cuts. Recent inflation data (PCE, CPI) shows sticky price pressure, especially in services.
Bank of Japan: BoJ remains hesitant to normalize policy despite inflation consistently above the 2% target.
This policy divergence is reminiscent of the conditions that pushed USDJPY above 151 last year — and current dynamics hint that history may repeat.
🌐 Capital Flows: JPY Loses Safe-Haven Appeal
Global capital flow models indicate a major shift. While gold and the US dollar are once again sought-after hedges amid US-China tensions and EU fiscal risk, the Japanese yen is being overlooked.
Japan’s debt-to-GDP ratio — the highest in the G7 — forces BoJ to maintain low rates to keep the fiscal structure sustainable. As a result, JPY is no longer viewed as a reliable store of safety.
📊 Technical Structure: Momentum Building Toward 144.1
On the H1 chart:
Price bounced sharply from the 142.33 demand zone, forming a higher low.
EMA 13 – 34 – 89 show a bullish alignment ("fan-out formation") confirming short-term bullish momentum.
Resistance near 144.13–144.20 is key: a clean breakout could trigger an extended rally to 145.00+
However, this zone may also trigger profit-taking, especially if traders react to upcoming macro data.
🎯 Trade Strategy Recommendations
Scenario 1 – Buy the Pullback (Preferred):
Entry: 142.70 – 142.90
Stop-Loss: 142.30
Take-Profit: 143.80 → 144.13 → 144.60
Scenario 2 – Breakout Momentum Buy:
Entry: 144.15
Stop-Loss: 143.70
Take-Profit: 145.00 → 145.50
⚠️ Key Events to Watch:
US PCE Price Index (April): If hotter-than-expected, this would reinforce the Fed’s hawkish tone and lift USD.
BoJ Governor Speech (end of week): Any unexpected hawkish shift could trigger a short-term rebound in JPY.

Will It Break Through 3366 or Reversal Ahead of NFP Week? XAU/USD PLAN – 26/05 | Gold at Crossroads: Will It Break Through 3366 or Reversal Ahead of NFP Week?
Gold is currently testing a key resistance zone following a sharp rebound last week. With the Fed maintaining its hawkish stance and US-EU trade tensions on hold, the market is in a wait-and-see mode, creating an ideal environment for structured trades.
🌍 MACRO CONTEXT:
Trump Delays 50% Tariffs on the EU Until July 9: This temporarily reduced market tension, but the long-term risks remain.
US 10-Year Yields Surge Above 4.55%: Bond markets are still pricing in tighter financial conditions, supporting the USD.
The Fed Faces Operational Pressure: The Fed continues to trim its workforce by 10%, signaling internal challenges as rate hikes push up reserve interest payments.
➡️ Investors should brace for high volatility ahead of NFP week, closely monitoring any central bank statements and reactions.
🔍 TECHNICAL OUTLOOK – H1/H4 VIEW:
Gold is consolidating near the 3360-3366 region, which is a critical sell zone where price has faced resistance. The chart reveals a rising channel and clear Fair Value Gaps (FVGs) both above and below the current price, hinting at significant volatility and liquidity sweeps in the near term.
🔑 KEY LEVELS TO WATCH:
🔺 Resistance Zones:
3364 – 3366: Local top and key reversal zone, a critical point to watch for potential rejection.
3406 – 3408: The upper bound of the FVG zone, with a potential blow-off target if a breakout occurs.
🔻 Support Zones:
3324 – 3326: 20 EMA retest, a possible bullish bounce if price holds here.
3310 – 3308: Trendline + EMA89 confluence, a strong support area.
3304: A break below this level would invalidate the short-term bullish outlook.
🎯 TRADE SETUPS:
🟢 BUY SCALP:
Entry: 3326 – 3324
Stop-Loss: 3320
Take-Profit: 3330 → 3334 → 3338 → 3342 → 3346 → 3350
🟢 BUY ZONE:
Entry: 3310 – 3308
Stop-Loss: 3304
Take-Profit: 3314 → 3318 → 3322 → 3326 → 3330 → 3340
🔴 SELL SCALP:
Entry: 3364 – 3366
Stop-Loss: 3370
Take-Profit: 3360 → 3356 → 3352 → 3348 → 3344 → 3340
🔴 SELL ZONE:
Entry: 3406 – 3408
Stop-Loss: 3412
Take-Profit: 3400 → 3396 → 3392 → 3388 → 3385 → 3380
⚠️ STRATEGY RECOMMENDATION:
If price breaks above 3366 with momentum, expect a run to 3408 and potentially 3450.
If price rejects 3366 or fails to hold above 3320, look for short positions with tight stops.
📌 Final Note:
Avoid chasing price in the middle of the range. Wait for a clear rejection or breakout confirmation to enter.

Fundamental Market Analysis for May 26, 2025 GBPUSDGBPUSD:
The GBP/USD pair is building on last week's strong upward movement and gaining positive momentum during Monday's Asian session. This momentum is lifting spot prices above the 1.3550 level, to the highest level since February 2022, and is supported by a combination of factors.
The British Pound (GBP) continues to show relative outperformance on the back of Friday's favourable UK retail sales data, which showed that consumer spending remains a bright spot despite the gloomy economic outlook. This, along with higher-than-expected inflation in April, fuelled speculation that the Bank of England (BoE) will take a pause at its next meeting on 18 June and will not be in a rush to reduce borrowing costs further.
The US Dollar (USD), on the other hand, continues to struggle to attract meaningful buyers amid concerns that the tax and spending bill will increase the US budget deficit at a faster pace than previously expected. Furthermore, growing confidence that the Federal Reserve (Fed) will further cut interest rates in 2025 has driven the Dollar to near one-month lows and is fuelling positive movement in GBP/USD.
This week, investors will face the release of important US macroeconomic data, with the release of Durable Goods Orders data on Tuesday and preliminary GDP data on Thursday. These data, as well as the FOMC meeting minutes on Wednesday and the Personal Consumption Expenditure (PCE) price index on Friday, may provide insight into the prospects of a Fed rate cut, which will have an impact on the USD and GBP/USD.
Trading recommendation: BUY 1.3590, SL 1.3570, TP 1.3690

I have almost good fundamental views about Berkshire HathawayHello Traders and Investors,
According to my fundamental analysis considering EPS revisions and forecasts and also by taking the analysis TP and recommendations. I give a good score to BRK-B.
By considering the technical matters I think BRK.B, while is not a really good option for short-term, could be a great option for the mid-term investment.
I'll have more BRK-B in my portfolio.

TSLA: Not recommended by me!Hello Traders,
TSLA Tesla fundamental score is not really good for me! My score is based on EPS data and EPS forecasts. there might be better stocks out there!
Regarding the technical aspects, White it reacted to the bottom of the channel median of the channel might be a small struggle. There is a strong possible resistance on the way up. I prefer to give a better/safer score after breaking this zone. Also, if we just consider technical analysis, any long options should have a SL, the possible rational SL is so far from the current price. in case of correction or breaking the zone, the possible SL could be very tighter.
Fundamental: Not recommended.
Technical: So-So.
Overall: I don't buy

EUROUSD COT and Liquidity Analysis chart The EUR/USD pair has demonstrated a convincing upward momentum, which might suggest a sustained long opportunity. However, traders should exercise caution—this bullish move could be a classic trap. Despite the current strength, signs of exhaustion are beginning to appear in the price action and volume. The market may soon shift direction, and a downward correction or full reversal could be imminent. Now is not the time to chase the high—stay alert, as the fall could happen sooner than expected.

BTC- New Impulse Soon You Can See read captionbitcoin (BTC) – Bullish Outlook
Price action breaking above key resistance, signaling potential trend continuation
Strong volume supports the move, confirming buyer strength
Higher highs and higher lows forming—classic bullish market structure
RSI and MACD both showing bullish divergence
Next target zone: TSXV:XX ,XXX – watch for consolidation or breakout
Overall sentiment shifting positive with macro tailwinds

Weekly Analysis for BTC (May 26–30)BTC played out clean last week. Broke above 108k, tapped a new ATH at 110.5k, and pulled back slightly. Structure still bullish — 4H HLs holding strong and 107k retest held nicely into weekend close.
Key level to watch is 110k. If we break that with momentum, price can push to 115k or even 120.7k based on fibs and hype continuation. If we reject again, we might pull back to 107k or 100k — still a buy zone unless 88k breaks.
On the macro side, confluence is heavy:
– ETFs still driving big money inflow
– US debt growing after Trump’s new tax bill
– Moody’s downgrade adds more pressure
– Geopolitical tensions + safe-haven flow also helping BTC hold strength
– Holiday week in the US (Memorial Day), so volume might be low — fakeouts possible if liquidity dries up
Best zones to watch this week:
🔸 110k breakout for continuation
🔸 107k and 100k pullback buys
🔸 110.5k ATH for possible rejection scalps
As long as 88k holds, structure is clean. Bias remains bullish with both TA and macro pointing up.
Will be posting more detial daily anaylsis. follow for more updates. Or check out Streefree_trade IG.

XAU/USD Outlook: Will Gold Open with a Bullish Gap?XAU/USD Outlook: Will Gold Open with a Bullish Gap?
Date Range: 26th – 30th May 2025
Timeframe: H4 (4-hour chart)
Market Bias: Short-term bullish
🔍 Fundamental Analysis
US–China Trade Tensions:
China halting imports of US goods puts pressure on the dollar (gold tends to move inversely).
Escalating tensions support gold as a safe-haven asset.
Tariff Threats to the EU:
Trump proposes 50% tariffs on EU products → potential retaliatory measures raise global uncertainty.
Risk-averse sentiment may push capital into gold.
Physical Gold Demand:
High seasonal demand from India and China ahead of festivals.
Inflation fears globally increase gold's appeal.
🌍 Macro Overview
Monetary Policy:
The Fed may face pressure to cut rates if trade tensions weaken the economy → bearish for USD, bullish for gold.
PBOC could devalue the yuan in response to trade friction, boosting gold prices in USD terms.
Market Sentiment:
A potential rise in the VIX (fear index) may drive investors towards safe havens like gold.
Strong demand for physical gold and ETFs, particularly in Asia, continues to support price.
Key Events This Week:
US Core PCE (inflation indicator)
US Consumer Confidence
EU and China responses to recent US trade policy
📊 Technical Analysis (H4)
Trend: Clear ascending channel
Current Price: 3,407.554
Key Resistance Levels:
3,407 – 3,444 (major resistance zone)
3,444.436 = potential all-time high
Support Zones:
3,361.648 (channel midpoint)
3,325.347 (lower channel boundary)
Fair Value Gaps (FVG):
FVG 1: 3,361 – 3,407
FVG 2: 3,325 – 3,340
Price Action Note:
A doji candle near resistance suggests a possible short-term pullback before continuation
🔄 Possible Scenarios
🔼 Bullish Scenario (60% probability):
Break above 3,444 with momentum could trigger a bullish gap and extend toward 3,500
Strong fundamental and technical support for upside
🔽 Bearish Scenario:
Rejection from 3,444 may lead to a pullback toward 3,361 or even 3,325 for buy setups
💡 Trade Plan
✅ Long Setup:
Entry: 3,361 – 3,370 (pullback into FVG or mid-channel support)
Take Profit: 3,444 (TP1), 3,500 (TP2)
Stop Loss: Below 3,325
❌ Short Setup (only on confirmed rejection):
Entry: On clear rejection at 3,444 (e.g. bearish engulfing or head & shoulders pattern)
Take Profit: 3,361
Stop Loss: Above 3,444
⏰ Optimal Trading Times
Monitor market open (Sunday, 26th May) for confirmation of a potential bullish gap
Best liquidity during London and New York sessions
📝 Summary:
Gold is well-positioned for a bullish move amid escalating trade tensions and USD weakness.
Watch closely for a breakout above 3,444 or a retracement to 3,361 as a strategic buy zone.
Stay updated on US inflation data and trade policy developments to adjust accordingly.

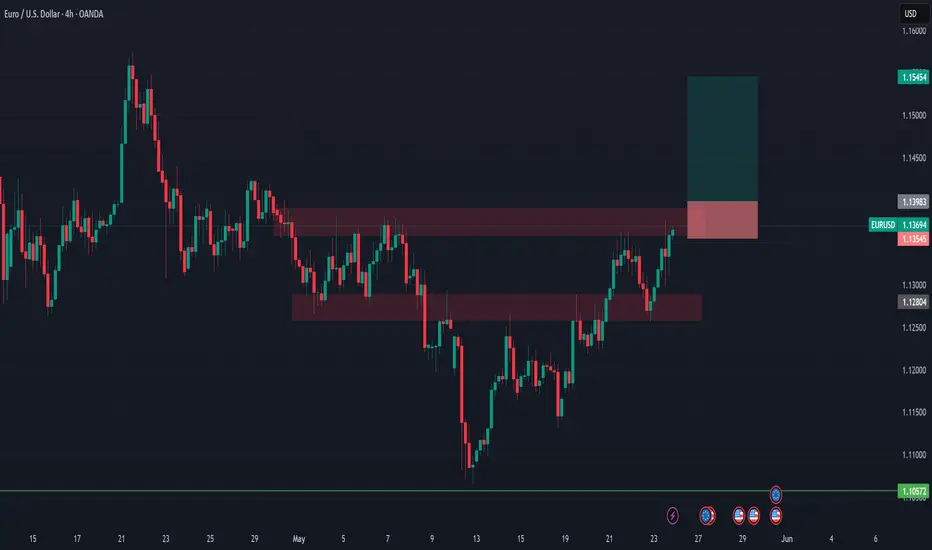
EURUSD Long Setup – Bullish Breakout PlayBias: ✅ Strong Buy
Timeframe: 4H
Pair: EURUSD
Week: 26–30 May 2025
🔍 Technical Analysis:
EURUSD has broken through a prior resistance and is currently testing a second resistance zone at 1.13983. I’m looking for a confirmed breakout above this level to enter long.
Entry: Break and 4H close above 1.13983
Stop Loss: Below support zone at 1.13545
Take Profit: Targeting resistance zone near 1.15454
Risk-Reward Ratio: ~3.36R
Structure: Higher highs forming, potential breakout continuation
🧠 Macro Confluence:
📉 USD Weakness: Dovish Fed + poor fundamentals (Investogenie Score 1.8 ↓, Conditional Score 3 ↓)
📈 EUR Strength: Improving Eurozone outlook, strong COT positioning, ECB easing bias
📊 Seasonal Bias: EURUSD bullish for this period
⚠️ Risk Management:
Watch for FOMC and GDP releases (USD) mid-week
Avoid premature entries without clear break and 4H confirmation
Optional: Wait for break & retest for higher probability
Drop your thoughts or setups below 👇
USD/JPY - H1 - Channel Breakout (17.05.2025) The Pair on the H1 timeframe presents a Potential Selling Opportunity due to a recent Formation of a Channel Breakout Pattern. This suggests a shift in momentum towards the downside in the coming hours.
Possible Short Trade:
Entry: Consider Entering A Short Position around Trendline Of The Pattern.
Target Levels:
1st Support – 142.40
2nd Support – 140.17
🎁 Please hit the like button and
🎁 Leave a comment to support for My Post !
Your likes and comments are incredibly motivating and will encourage me to share more analysis with you.
Best Regards, KABHI_TA_TRADING
Thank you.
Disclosure: I am part of Trade Nation's Influencer program and receive a monthly fee for using their TradingView charts in my analysis.

GBP/AUD - Bullish Channel (22.05.2025)The GBP/AUD pair on the M30 timeframe presents a Potential Buying Opportunity due to a recent Formation of a Channel Pattern. This suggests a shift in momentum towards the upside and a higher likelihood of further advances in the coming hours.
Possible Long Trade:
Entry: Consider Entering A Long Position around Trendline Of The Pattern.
Target Levels:
1st Resistance – 2.0961
2nd Resistance – 2.1047
🎁 Please hit the like button and
🎁 Leave a comment to support for My Post !
Your likes and comments are incredibly motivating and will encourage me to share more analysis with you.
Best Regards, KABHI_TA_TRADING
Thank you.
Disclosure: I am part of Trade Nation's Influencer program and receive a monthly fee for using their TradingView charts in my analysis.
