On the look out for a break above 1.14829 to confirm BullishHi Friends - Here is my own bias. Not a financial advise.
1. Buying intent spotted after the break of structure on the 1h time frame at 1.14381 BOS
2. Price retraced back to the liquidity that drove price back up on July 10th at 1.14005
3. We are looking out for price to close above 1.14805 and seek liquidity to move to the up side.
4. Possible consolidation between 1.14024 and 1.14858
Violation of the setup above will lead to a movement to the downside.
See you on the profitable end.
The Surge!
Fundamental Analysis

GBPUSD BEARISH POTENTIAL The daily time frame for GBPUSD is showing me that price has formed a head & shoulders pattern, breaking through the former support now resistance level. Price is currently sinking to my 1.31000 mid level, once the level is reached it will either breakthrough or bounce off of it to retrace and continue to build bearish structure.

AVGO ( Broadcom.Inc ) NASDAQ:AVGO - Continuation of movement within the ascending channel + potential for a breakout to new historical highs. 🔍 Rationale:
• After a strong correction in the first quarter of 2025, the price formed a reversal and has been moving in a clear ascending channel since the beginning of May.
• The channel support and resistance are clearly being worked out, the price is steadily bouncing off the lower border.
• Bollinger Bands show a narrowing - momentum is possible.
• Trading volume is stable, there are no signs of a strong sell-off.

JPM + $500B Capital Forecast + Banks to Profit from Tar NYSE:JPM , 4H chart
ALVO13 Insight: A strong mix of technical structure and positive fundamentals.Technical Setup (Elliott Waves):
The chart suggests a potential start of wave (5) after a completed correction (4).
Stochastic is in the oversold zone, and $280 support is holding — a key signal for a possible reversal.
Key Levels:
• Support: $280.00–280.47
• Resistance: $295.73–298.02
• Target (Wave 5): $315.67
Fundamental Factors:
JPMorgan forecasts up to $500B in new equity inflows from retail and institutional investors during H2 2025. This could lift the market, especially financials.
Banks are likely to benefit from upcoming trade tariffs — via increased demand for hedging, transaction fees, and advisory services.
PM remains one of the most solid U.S. banks, with strong dividend policies and excellent return on equity (ROE).
ALVO13 Trade Idea:
• Entry: $282–286 (confirmation-based)
• Stop-loss: below $280
• Take-profit: $315+
• Risk/Reward: 3:1
Break below $280 invalidates the bullish wave 5 scenario.

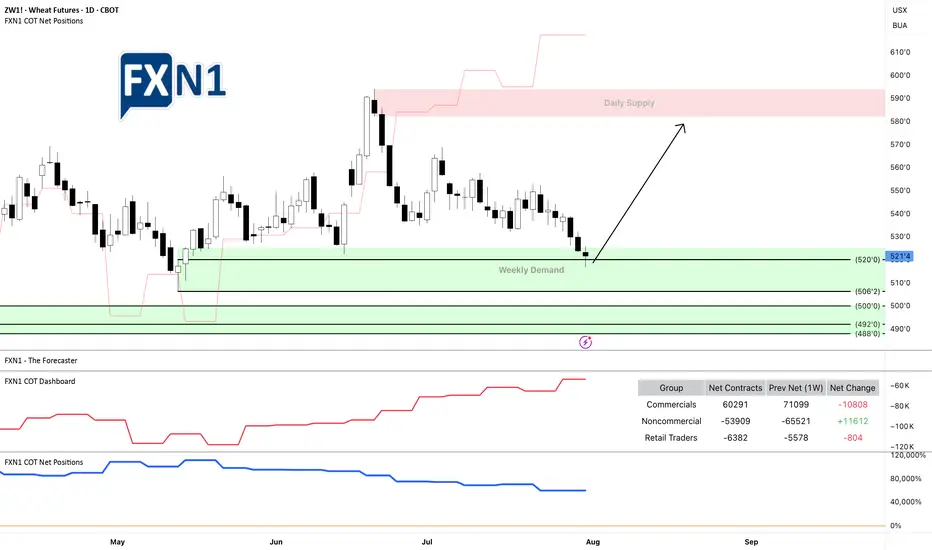
Is Wheat ZW1 Ready for a Long Trade? Key Demand Area InsightsThe futures of Wheat ZW1! are reaching a weekly demand zone, where we observe non-commercials going long and retail traders holding short positions. This could present a potential setup for a long trade. Note: There is another demand area below, but the positions of commercials are less clear compared to non-commercials and retail traders.
Always manage your risk carefully if you agree with my analysis, and be sure to develop your own trading plan.
✅ Please share your thoughts about ZW1! in the comments section below and HIT LIKE if you appreciate my analysis. Don't forget to FOLLOW ME; you will help us a lot with this small contribution.
USDJPY HEADING UPThe daily time frame is showing potential bullish movement, seemingly forming structure after daily consolidation. Price bounced off of support and formed a higher low, a third retest of the bullish trend line will further validate this.

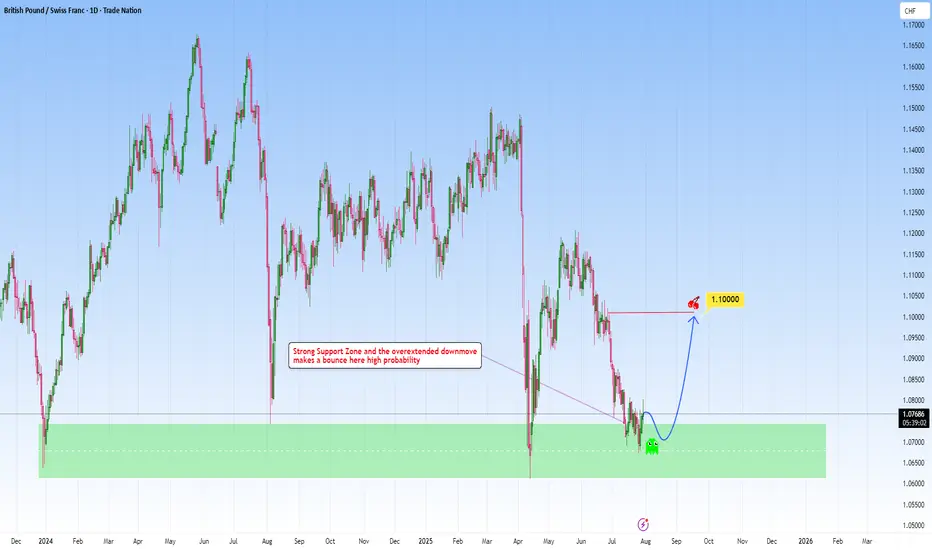
GBPCHF meets strong support: A reversal here is high probabilityLooking at GBPCHF and how it fits within my approach to structure-based trading, this one is really speaking my language.
Price has come down into a key higher-timeframe support zone: a zone that’s proven itself multiple times in the past. Now, price has shown some initial rejection there, making my long position towards 1.1000 a clear, rational target.
What makes this setup different could be the patience behind it. As we let the market complete its downward leg, waited for price to revisit a reliable zone, and now anticipating a bounce back. It’s a move that I’ve captured across my previous charts again and again.
Let me know in the comments what you think
Disclosure: I am part of Trade Nation's Influencer program and receive a monthly fee for using their TradingView charts in my analysis.
XAUUSD
XAUUSD Updated in 15M :
The gold signal is marked on the chart based on the latest price changes and the supply and demand in the market. These points include the entry point, stop loss, and take profit.

MORE DOWNSIDE AHEAD Looking at the GBPUSD pair, we can see that the trend has reversed to the downside.
The pair broke a rising trendline to the downside in the past and also formed a head and shoulder pattern.
Also in the past,price broke a resistance which is indicated with blue rectangle and a support which is indicated with a red rectangle to the downside.
I'm seeing price retracing to retest the previously broken structure or support which is indicated with a red rectangle and turning it to resistance, and thereby continuing the downtrend

Gold Struggles at Resistance – Indicates Lower Lows AheadGold has been in a clear downtrend after facing a strong rejection around the 3,438 level (main resistance zone). Price is currently moving within a descending channel, confirming the formation of lower highs and lower lows – a classic bearish market structure.
Currently, Gold is trading near 3,306, facing resistance at 3,339 (marked as a possible lower high). If price fails to break above this level and sustain, there is a strong probability of continuation towards 3,249 and even 3,216.
Key Technical Highlights
- Immediate Resistance: 3,339 – 3,353
- Support Levels: 3,301 (short-term), 3,249, and 3,216
A rejection near 3,339 can lead to another leg down targeting 3,249 and 3,216. However, a strong breakout above 3,339–3,353 could temporarily shift momentum towards 3,394.
Note
Please risk management in trading is a Key so use your money accordingly. If you like the idea then please like and boost. Thank you and Good Luck!

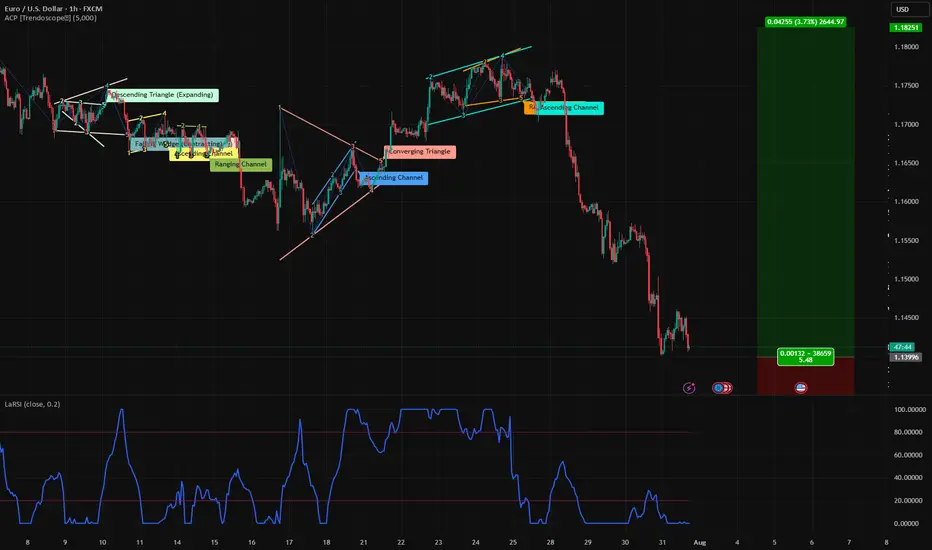
Trade Bias: I’m looking to buy EURUSD, but only on confirmationFading Fear, Not Chasing Highs 💡💶
This isn’t about momentum. It’s about patience. EURUSD has been under pressure, but I’m not selling panic — I’m watching for a buy signal to fade the current selloff. With dollar fundamentals shifting, this pullback could be setting up opportunity — not continuation.
📈 Trade Bias: I’m looking to buy EURUSD, but only on confirmation the sell pressure is cooling.
Here’s the fundamental picture:
✅ US growth is slowing; Q1 GDP contracted slightly
📉 Dollar bears are at a 4-year high, signaling sentiment exhaustion
🔁 ECB paused cuts, holding steady at 2.15% — EUR fundamentals are stabilizing
💬 US tariffs could push inflation up, but squeeze household demand
⚠️ I’m not expecting new highs — just a relief move once the selling slows
The dollar is caught in a tug-of-war: economic data remains decent, but traders don’t buy it. Sentiment is skewed — hedge funds are heavily short USD, not because the economy is collapsing, but due to fiscal worries, policy confusion, and long-term structural cracks. This creates space for countertrend moves.
The euro isn’t roaring either — but it's no longer cutting rates, and confidence is picking up. A recent uptrend has cooled, and the pair is now consolidating. If we see signs of selling exhaustion, I’ll be watching for an entry.
I’m not buying blindly. I’m waiting for the fear to burn out. Would you fade this dip too — or are you staying out? 👇
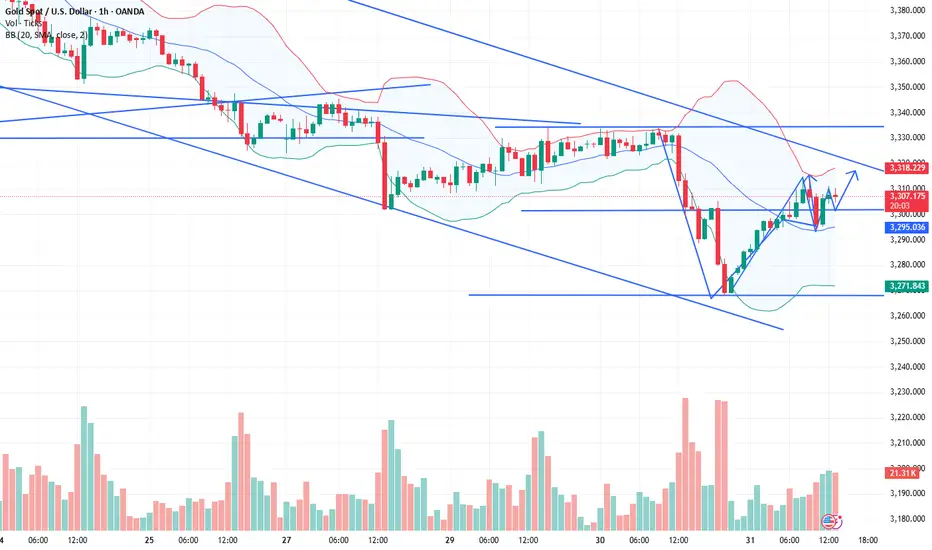
Gold Market Eyes Daily Demand Zones at 3270–3315Gold market aligns with daily candle formation, seeking to mitigate substantial demand zones between 3270 and 3315. This area may provide the necessary liquidity for a potential bullish reaction, pending confirmation. follow for more insights , comment and boost idea

BUY AFTER THE PULLBACK Analyzing the daily time frame of silver, we can see that silver is in a bullish uptrend.
The price of silver is respecting a rising trend line which is acting as support in the past, only for some few times in the past did it exhibit a fake breakout which is indicated with an arrow.
I see the price of silver from its current price actions selling to our required point of interest and looking for buy liquidity to buy at our confluence which is both previous resistance which was broken to the upside which I indicated with a blue rectangle and a rising trend line.
Please look for buys at the previous broken resistance which is indicated with a blue rectangle in confluence with a rising trendline.
.............,...........................................
Please kindly share your thoughts on silver

My opinion on the euro to dollarI think the trend is bearish in the medium term, although we may have an upward correction first, so you can wait to enter when shorting.

DXY USDOLLAR CRASH Incoming!Long-term fundamentals are bearish
Long-term sentiment = bearish
Long-term technicals = bearish
Trump wants a weaker dollar + FED injecting endless amounts of cash into the markets
driving stocks/ gold up, and the dollar down, losing purchasing power.
My plan is to look for shorts on the 1hr-4hr timeframe with lower timeframe confirmation.
Once price starts turning over, day-traders can join in.
Agree or disagree?

Gold bottomed out and rebounded, and gold is still rising!The latest news indicates that Trump has announced a 50% tariff on Brazilian products and a 25% tariff on Indian products, and has firmly stated that the tariffs will take effect on August 1st, with no further grace period. These positive factors will also support a rebound in gold.
As for tomorrow's big non-farm payrolls, considering that both the previous two times were negative and contrary to the ADP, it is very likely to be bullish for gold, which may help boost a steady rebound in gold, so there is no need to worry if you are stuck with gold.
Nothing rises forever, and nothing falls forever. Last week, the market rose in the first half, then fell in the second half. With the first half of this week's decline, the daily chart has already fallen to near the 100-day moving average. Be wary of a rebound in the second half. Gold is bearish today, but don't chase shorts. Focus on the 3300 resistance level. If it breaks above and stabilizes, expect a continued rebound to 3330-3345!
A real-time strategy is like a beacon guiding your investment journey. The market will never disappoint those who persevere and explore wisely. FX:XAUUSD VELOCITY:GOLD FXOPEN:XAUUSD ACTIVTRADES:GOLD PYTH:XAUUSD
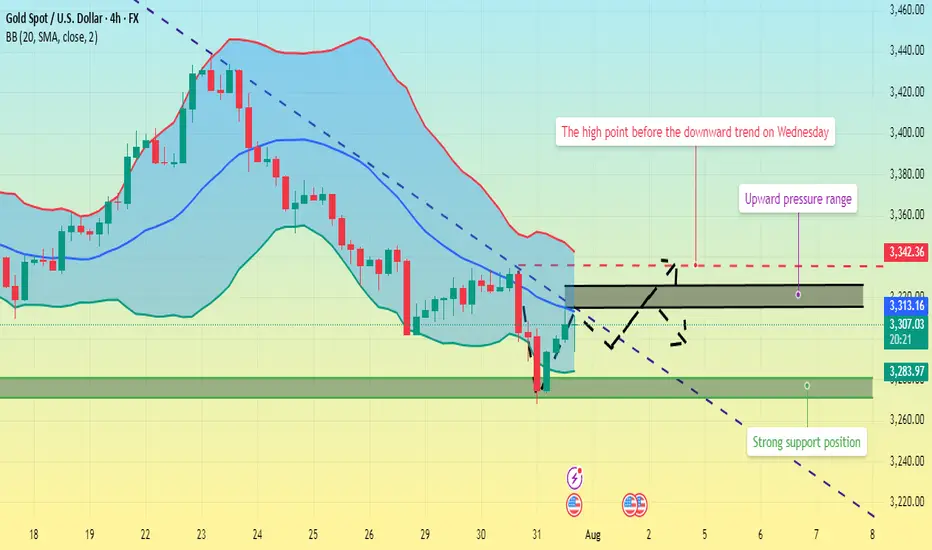
Gold fluctuates. Is the decline halted?Information Summary:
Despite diminished market expectations for a September US rate cut, gold rebounded from a one-month low hit the previous session on Thursday, boosting its safe-haven appeal as newly announced US tariffs sparked new trade uncertainty.
So far, gold has risen 1.15%, hovering around $3,310, a gain of nearly $40 today. On Wednesday, gold prices hit their lowest point since June 30th: $3,267.79.
Market Analysis:
On the 4-hour chart, prices remain below the middle Bollinger Band, with a descending trendline defining the current bearish momentum. Prices rebounded after hitting this month's low on Wednesday. In the short term, watch for price rejection signals near the trendline. Upward pressure currently lies between $3,315 and $3,325, while support lies between $3,280 and $3,270.
Currently, prices are fluctuating upward. Quaid believes the bullish trend may continue. If the current resistance level is broken, it could reach the 3335 high before Wednesday's decline.
Trading strategy:
Go long near 3300, stop loss at 3290, profit range 3320-3330.
Bitcoin Intraday Analysis 31-Jul-25Quick analysis on bitcoin, the main area of interest i will be monitoring are 110,500, 115k, 120K. Keeping in mind that we still have important economic data tomorrow (US Employment Data).
Disclaimer: easyMarkets Account on TradingView allows you to combine easyMarkets industry leading conditions, regulated trading and tight fixed spreads with TradingView's powerful social network for traders, advanced charting and analytics. Access no slippage on limit orders, tight fixed spreads, negative balance protection, no hidden fees or commission, and seamless integration.
Any opinions, news, research, analyses, prices, other information, or links to third-party sites contained on this website are provided on an "as-is" basis, are intended only to be informative, is not an advice nor a recommendation, nor research, or a record of our trading prices, or an offer of, or solicitation for a transaction in any financial instrument and thus should not be treated as such. The information provided does not involve any specific investment objectives, financial situation and needs of any specific person who may receive it. Please be aware, that past performance is not a reliable indicator of future performance and/or results. Past Performance or Forward-looking scenarios based upon the reasonable beliefs of the third-party provider are not a guarantee of future performance. Actual results may differ materially from those anticipated in forward-looking or past performance statements. easyMarkets makes no representation or warranty and assumes no liability as to the accuracy or completeness of the information provided, nor any loss arising from any investment based on a recommendation, forecast or any information supplied by any third-party.

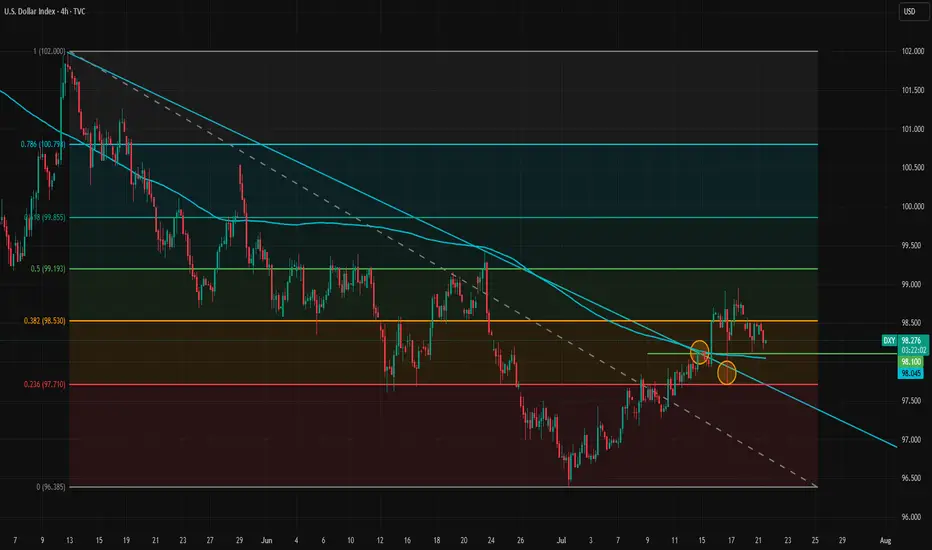
Fundamentals Support Dollar’s Potential Trend ReversalThe dollar appears to be reversing its direction on the 4-hour timeframe. The trendline has been broken and retested twice, but the dollar has held above it, signaling a potential shift in momentum.
Despite intense pressure from the White House on the Federal Reserve, the data is likely to prevent the Fed from cutting rates at the upcoming meeting and possibly at the one after that. A potential rate cut in September will largely depend on incoming inflation and labor market data.
The inflation impact of tariffs became more visible in the latest CPI report, but the effect is still relatively modest. This aligns with our theory that tariff-driven inflation will build gradually and persist over a longer period, rather than cause an immediate spike.
Meanwhile, the labor market has not shown clear signs of rapid weakening, so there is no strong case for a rate cut from that side either. The Financial Conditions Index also indicates that monetary policy remains on the accommodative side. Bloomberg financial conditions index is at highest level since March.
As markets increasingly recognize that no rate cuts are likely in the near term, and with the August 1 tariff deadline approaching amid potential rising risks of trade tensions between the U.S. and the EU, the dollar may gain further support. The U.S.–EU bond market spread also does not favor a stronger euro at the moment, adding to the dollar's upside potential.
In the short term, 98.10 and 98.53 are immediate support and resistance levels. If the dollar breaks above 98.53 again, upward momentum may strengthen and open the path toward the 100 level.
Gold is faking a bullish trapWe are gonna go down to the 3294 level before we see a bounce up. The 3294 level is gonna show up as a strong support to push trough the 3345 area.

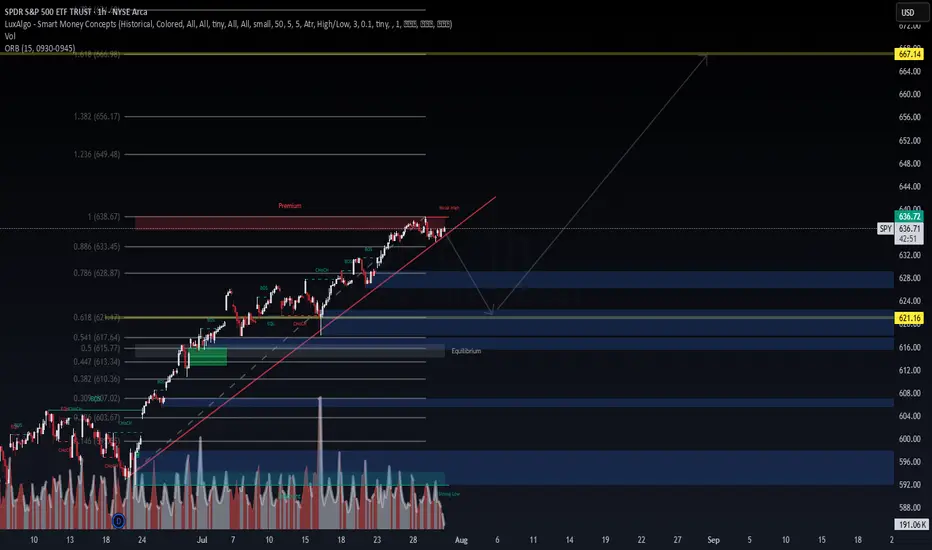
$SPY – FOMC Risk Window: AI Predicts Downside Drift📅 Forecast Window: July 30 – August 30, 2025
📡 Powered by VolanX Protocol v3.0 | WaverVanir DSS
🏛️ MACRO SETUP – JULY 31 FOMC:
🏦 Fed Funds Rate: 5.50% (expected hold)
🧊 Inflation: Cooling but sticky (CPI ~3.2%, PCE ~2.6%)
💼 Labor Market: Slowing but not collapsing
📈 CME FedWatch: 91% odds of no hike, but tone may be hawkish
🧠 Key Risk: Liquidity compression or prolonged pause = risk-off conditions
🧠 VOLANX PROTOCOL FORECAST (30-Day):
🔸 Current Price: $636.29
🔹 AI Target: $627.46 (−1.4%)
🟠 Signal: HOLD
🧮 Direction Accuracy: 85.5%
⚠️ Model Confidence: −2.049 (bearish drift)
📊 Volatility Forecast: Low (~1.36%) = slow bleed conditions
📉 WAVERVANIR DSS SIGNAL:
🔸 Sentiment Score: 78
🔻 15D Forecast: $630.49 (−0.8%)
🔻 30D Forecast: $616.68 (−2.9%)
📉 Bias: Mild Bearish
🛑 Signal: Hedge exposure, reduce risk, do not chase longs
🔥 OPTIONS FLOW SNAPSHOT:
🚨 $1.53M Call Sweep (645C, Aug 8) = Speculative breakout bet
📉 Multiple Put Sweeps (633–634P, Aug 4) = Institutional hedging
🟢 Mid-dated 638C/645C flows (Aug 15–22) show straddle-the-news positioning
📐 TECHNICAL ZONES TO WATCH:
📉 Support Levels:
$627 = Fib + VolanX AI Target
$616 = DSS Forecast + liquidity pivot
📈 Resistance Levels:
$639 → Gap close
$645 → Major breakout trigger (options magnet)
🕯️ Structure: Distribution bias → No clear momentum unless Fed surprises dovish
🎯 STRATEGIC OUTLOOK:
Scenario Probability SPY Reaction
🟡 Hawkish Hold 65% Pullback toward $627
⚪ Neutral Hold 25% Choppy → $639 max
🟢 Dovish Surprise 10% Spike to $645+
📌 VolanX Protocol Guidance:
"This is a defense window. AI models and options flow both suggest uncertainty, not conviction. Trim longs, hedge risk, and wait for post-FOMC confirmation."
#SPY #VolanX #WaverVanir #FOMC #MacroForecast #OptionsFlow #DSS #SMC #LiquidityTraps #SmartMoney #TradingSignals #AITrading #FederalReserve #TechEarnings #RiskWindow #HawkishFed #FedHold #MacroAI
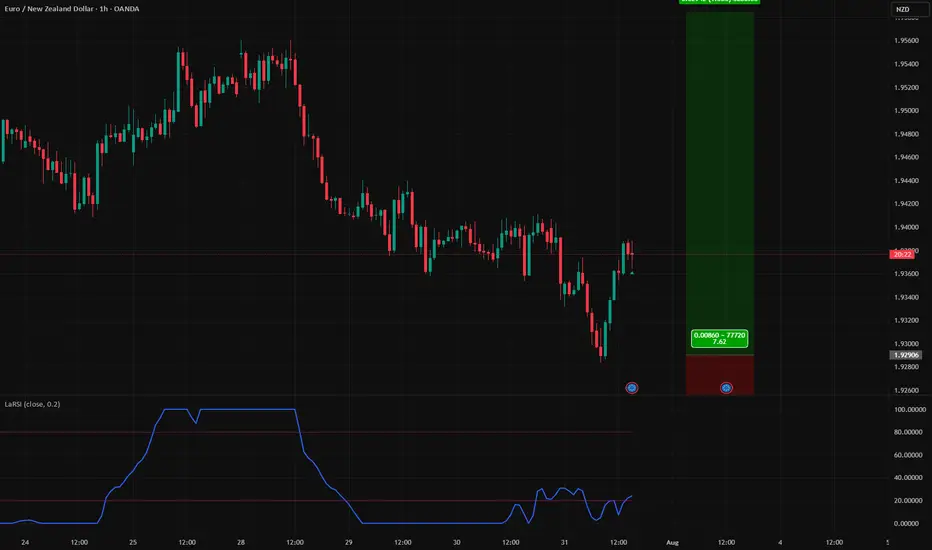
Trade Idea: I’m bullish on EURNZD.Euro Finds a Tailwind, Kiwi Faces a Crosswind 🌬️💶🐑
The euro just got a major boost — not from within, but across the Atlantic. With the US-EU tariff deal now secured, one weight has been lifted off Europe’s shoulders. Meanwhile, New Zealand’s momentum is slowing under the weight of rate cut expectations. This divergence could be tradable.
📈 Trade Idea: I’m bullish on EURNZD.
Why I’m backing euro strength over the kiwi right now:
✅ The US-EU tariff deal is done, removing a major external risk for Europe
🧊 ECB is holding steady after eight cuts — signaling policy stability
📉 RBNZ is expected to resume rate cuts, with a 2.75% target by year-end
🔁 Business confidence in NZ is high, but consumer sentiment remains soft
💬 Speculators are net long EUR, and net short NZD
The Eurozone isn’t booming — but it’s stabilizing. Industrial production is up, inflation is cooling, and a fresh wave of investor optimism is lifting sentiment. With tariffs no longer hanging over the ECB’s head, the pressure to cut further eases. That’s a fundamental tailwind.
On the other hand, New Zealand is in limbo. Domestic confidence is improving, but the RBNZ is stuck in a global game — and that game still favors more easing. Markets are already positioning for it, with speculative bets on the kiwi flipping negative.
EURNZD is one of the cleanest expressions of central bank divergence and shifting macro sentiment right now.
Are you with the fortress or the flock? Let me know your view. 🧱🐑👇
Gold Crashing After Hot U.S. Data – More Pain Ahead?Minutes ago, important indices were released from the US , which catalyzed the continuation of gold's downward trend .
Key U.S. Economic Data Just Dropped!
ADP Employment: 104K
GDP q/q: 3.0%
Both came in stronger than expected , signaling that the U.S. economy is holding up better than many thought!
Strong job growth
Solid economic expansion
The result? A stronger U.S. dollar ( TVC:DXY ) and potential downward pressure on Gold .
All eyes are now on FOMC meeting .
Will the Fed still hint at future rate cuts despite the solid data? Or is the easing cycle officially on hold? What is your idea!?
----------------------
Gold ( OANDA:XAUUSD ) has already managed to break the Support zone($3,350-$3,326) , Monthly Pivot Point , 50_EMA(Daily) , Support lines , and the lower line of the ascending channel . Also, Gold trading below $3,333 plays an important role for me, which can increase the possibility of a continuation of the downtrend .
I expect Gold to drop to at least the Potential Reversal Zone(PRZ) before the FOMO meeting and if the Support zone($3,307-$3,272) is broken, we can expect further declines to $3,253(Second Target) .
--------------------------------
Information we need to know:
How should the Federal Funds Rate be announced to cause a deeper drop in Gold ?
The Fed needs to take a hawkish stance — meaning:
They keep rates unchanged, but make it clear they intend to keep them elevated for a prolonged period.
They emphasize strong economic data like today's solid ADP and GDP numbers .
They express concern that inflationary risks remain, and cutting rates isn’t on the table anytime soon.
In this case, markets get disappointed, rate cut hopes fade, and gold drops as real yields( TVC:US10Y ) rise and the U.S. dollar strengthens.
--------------------------------
Note: Stop Loss (SL) = $3,340
Gold Analyze (XAUUSD), 4-hour time frame.
Be sure to follow the updated ideas.
Do not forget to put a Stop loss for your positions (For every position you want to open).
Please follow your strategy; this is just my idea, and I will gladly see your ideas in this post.
Please do not forget the ✅ ' like ' ✅ button 🙏😊 & Share it with your friends; thanks, and Trade safe.
