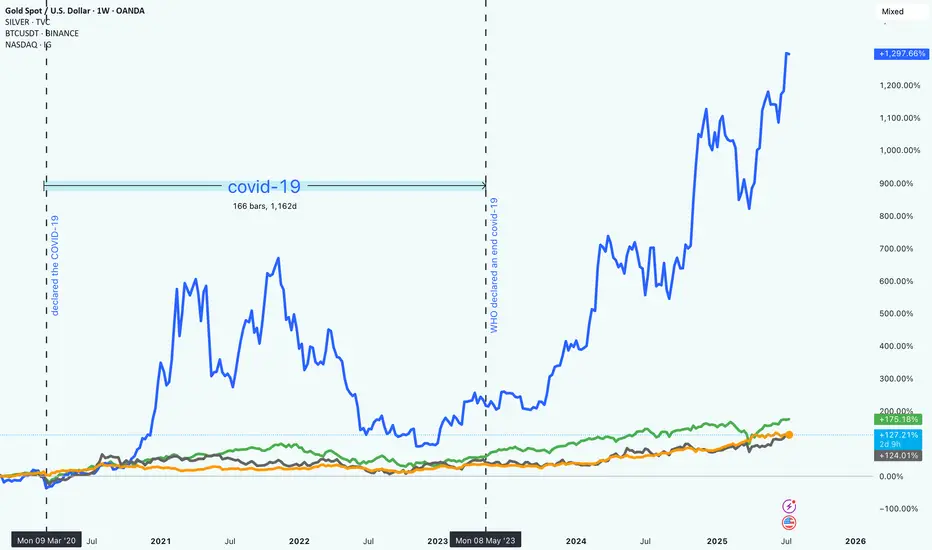
Market Trends from 2020 to 2025How Bitcoin, NASDAQ, Gold, and Silver Really Performed Since 2020
It’s been a wild few years in the markets. From early 2020 to mid-2025, investors have had to navigate uncertainty, changing interest rates, tech booms, and the rise of digital assets. Looking back, it’s clear that some assets took off while others just quietly held their ground.
So, what happened if you had invested in Bitcoin, the NASDAQ, gold, or silver five years ago?
Bitcoin (BTC): +1,297.87%
No surprise here. Bitcoin absolutely stole the show. Despite all the ups and downs (and there were plenty), BTC ended up with nearly 1,300% gains. It had a huge surge in late 2020 and 2021, crashed hard, and then climbed even higher starting in 2023.
This kind of return doesn’t come without risk. Bitcoin was by far the most volatile of the group. But for those who held on, the reward was massive. It also marked a big shift in how people think about money and investing.
"Crypto is no longer just a fringe idea."
NASDAQ: +175.26%
Tech stocks had a strong run, too. The NASDAQ gained around 175%, driven by innovation, digital expansion, and eventually, the AI boom. While there were some bumps along the way (especially when interest rates went up), the general trend was up and to the right.
Unlike Bitcoin, the NASDAQ was more predictable, less explosive.
Gold: +127.39%
Gold did what gold usually does. It held its value and slowly moved higher. Over five years, it returned about 127%, which is pretty solid for a “safe haven” asset. It didn’t grab headlines like crypto or tech stocks, but it stayed reliable through the chaos.
Silver: +124.50%
Silver had a similar story to gold, but with a bit more fluctuation. It benefited from both investor demand and industrial use, and it ended up with just over 124% in gains. Not bad for a metal that often gets overshadowed by its shinier cousin ;).
What It All Means
If you were in Bitcoin, you saw huge gains, but also had to stomach major volatility. Tech investors did well too, especially those who stayed in through the dips. Meanwhile, gold and silver offered steadier, more defensive returns.
One big takeaway: the investment landscape is changing. Traditional assets still matter, but new ones like crypto are reshaping what portfolios can look like.
In the end, it’s about balancing risk and reward!
and figuring out what kind of investor you are.
Fundamental Analysis
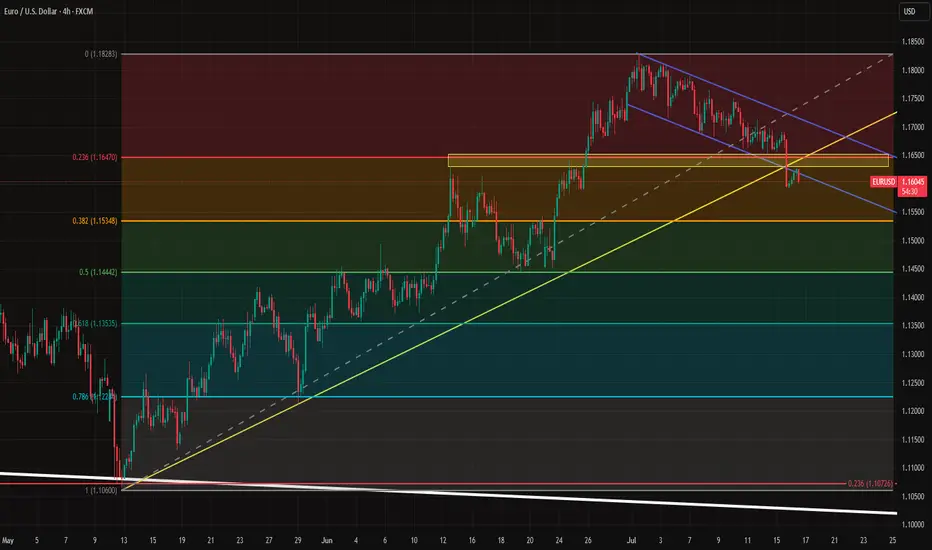
EUR/USD - Daily Chart (Wedge Breakout) (16.07.2025) The EUR/USD Pair on the D1 timeframe presents a Potential Selling Opportunity due to a recent Formation of a Wedge Pattern. This suggests a shift in momentum towards the downside in the coming Days.
Possible Short Trade:
Entry: Consider Entering A Short Position around Trendline Of The Pattern.
Target Levels:
1st Support – 1.0956
2nd Support – 1.0625
💡 Fundamental & Sentiment Context
Euro under pressure amid renewed concerns over EU‑US trade friction .
The USD is strengthening, supported by safe‑haven flows amid tariff uncertainties.
🎁 Please hit the like button and
🎁 Leave a comment to support for My Post !
Your likes and comments are incredibly motivating and will encourage me to share more analysis with you.
Best Regards, KABHI_TA_TRADING
Thank you.
Disclosure: I am part of Trade Nation's Influencer program and receive a monthly fee for using their TradingView charts in my analysis.

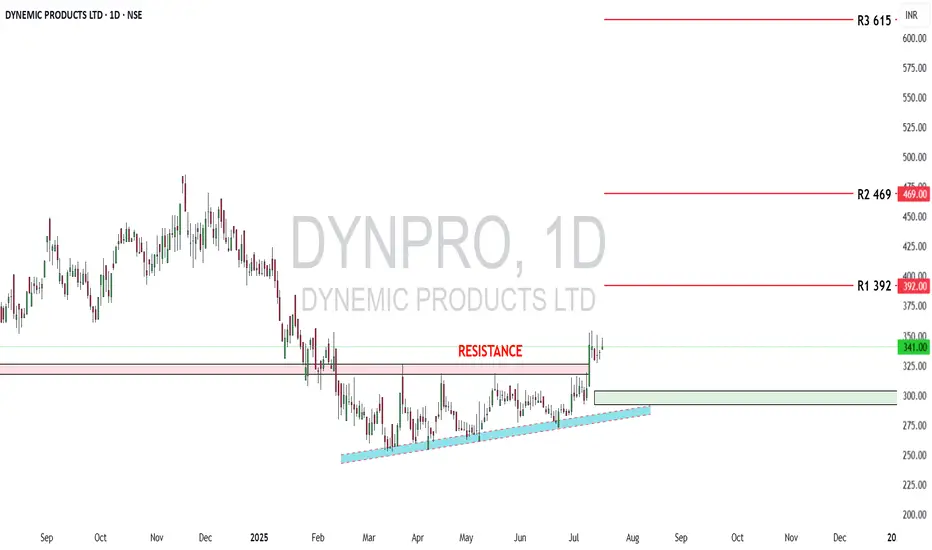
Dynemic Ltd: Bullish Setup UnfoldingDynemic Products Ltd (NSE: DYNPRO) is a well-established exporter and manufacturer of synthetic food-grade dyes, lake colors, and D&C colors, catering to global markets. As of July 16, 2025, the stock trades at ₹341 and has recently broken out of a prolonged consolidation zone, indicating renewed investor interest.
From a fundamental perspective, the company’s financials show notable improvements:
🔸 Revenue (FY25): ₹214 crore, up 29% YoY
🔸 Net Profit (FY25): ₹15 crore, up 269% YoY
🔸 EPS (TTM): ₹3.65
🔸 P/E Ratio: ~23× – moderately valued
🔸 P/B Ratio: ~1.56× – near fair book value
🔸 ROE: ~7%, showing improving return to shareholders
🔸 ROCE: ~12.7%, indicating decent operational efficiency
🔸 Debt-to-Equity: ~0.43× – financially stable
🔸 Current Ratio: ~0.95× – slightly below ideal liquidity levels
🔸 Operating Cash Flow: ₹28 crore – healthy cash generation
While the company has a stable balance sheet and growing profitability, investors should note that liquidity remains slightly tight, requiring careful monitoring of working capital and short-term obligations. Nonetheless, the financial turnaround and earnings consistency signal strength.
On the technical front, the stock has shown strong bullish action after breaking above a multi-month resistance:
🔹 Breakout Zone Cleared: ₹325–₹330 (previous resistance)
🔹 Current Price: ₹341
🔹 Reversal Zone (Strong Support): ₹292 to ₹304
🔹 R1: ₹392 – short-term resistance
🔹 R2: ₹469 – medium-term target
🔹 R3: ₹615 – long-term upside if momentum sustains
The breakout is confirmed with increased volume and a clear higher-high, higher-low structure, validating bullish sentiment. The price now rides above a rising trendline, suggesting trend continuation unless a breakdown occurs below ₹292.
In summary, Dynemic Products Ltd currently offers a compelling techno-fundamental setup. The financials have improved significantly, valuations remain reasonable, and the technical breakout suggests potential for further upside. Investors can consider accumulating on dips above ₹304, while swing traders may target ₹392 and ₹469 in the short-to-medium term. A close watch on liquidity and cash flows is advised, but the stock presents a strong growth case in the specialty chemicals space.
Disclaimer: lnkd.in
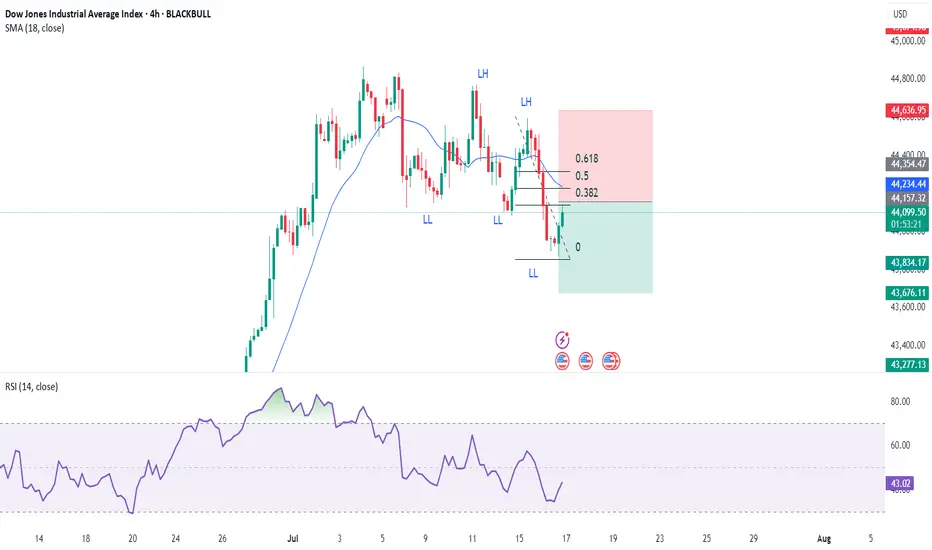
Dow Short IdeaDow jones has started making LL's so it is effectively in a downward trend on 4Hr chart so shorting on pullback to key Fib Retracement levels would be a good idea.
EURUSD Under Pressure as Macro Divergence WidensEURUSD is facing renewed downward pressure after rallying from 1.02 to 1.18 in a strong multi-month move. However, diverging inflation expectations between the EU and the U.S. are now weighing heavily on the pair.
One major signal comes from real yields. The Germany–U.S. 10-year real yield spread currently sits at -1.1182, the same level seen during the 2024 top near 1.11 and the 2023 top near 1.10. By that measure, EURUSD appears expensive. Over the past five years, 69% of EURUSD’s moves can be statistically explained by this real yield spread, making it a key macro indicator.
Inflation expectations are also diverging. The U.S. 5y5y inflation swap is trending upward, while the EU’s equivalent has remained flat. This suggests the Fed may keep rates elevated for longer than initially expected.
Beyond bond market dynamics, the August 1 tariff deadline is approaching with no deal in sight. In fact, tensions are rising, as the EU prepares possible countermeasures targeting $84 billion worth of U.S. goods. Adding to the pressure, political risk in France is building due to ongoing budget negotiations.
Technically, the recent break of both the uptrend (yellow) and the downtrend channel was significant. Euro bulls now need to reclaim and hold above 1.1660 to avoid deeper losses. If they fail, 1.1445 could become the next key support level, with further downside possible depending on how the news develops.
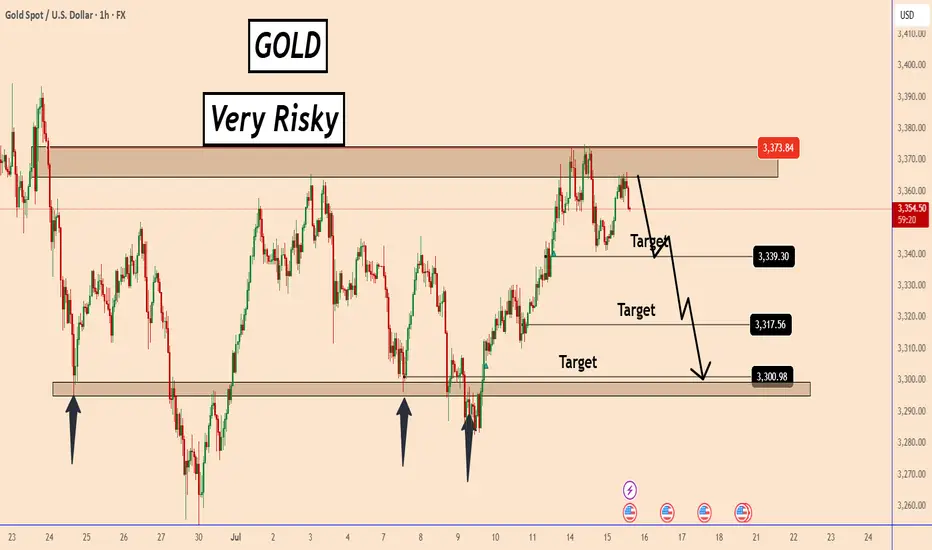
GOLD: A Short-Term Trading Setup - High RiskGOLD: A Short-Term Trading Setup - High Risk
Since July 9, GOLD has been in an uptrend, rising to 3375 as its current high.
The market focus is solely on the Fed’s interest rate cut and when it might happen. Today we have the US CPI data in about 30 minutes. The market expects the CPI to be 2.7% vs. 2.4%.
The market is expecting a bullish data, which increases the odds that the Fed will not cut rates anytime soon and should reduce the odds of an interest rate cut at the July meeting.
From a technical perspective, the price is already facing a strong zone and the chances of a decline are high. However, this trade carries a higher than normal risk, as we can never know how the market may interpret inflation data and its impact on future interest rate cuts.
You may find more details in the chart!
Thank you and Good Luck!
PS: Please support with a like or comment if you find this analysis useful for your trading day
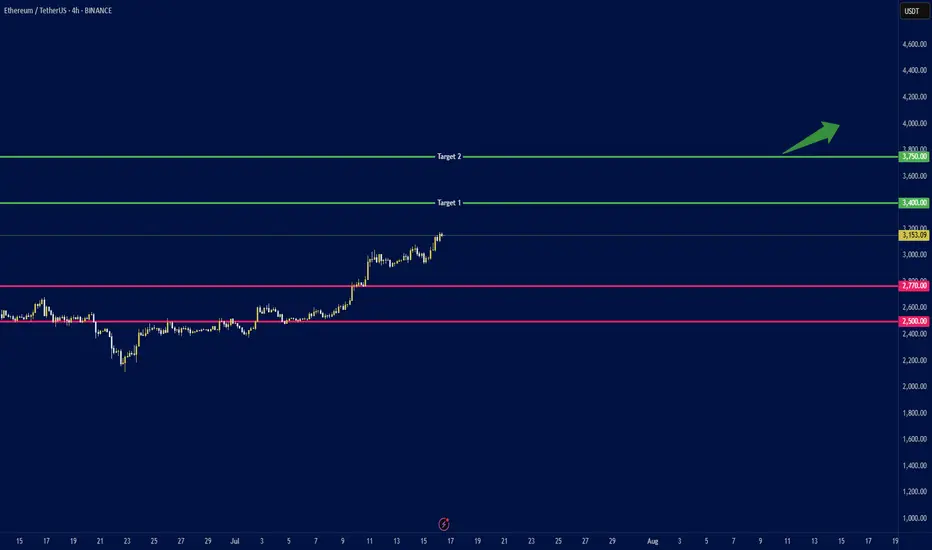
ETH to $4K ? Whales Accumulate as ETFs Break Records🕞 Timeframe: 4H
.
🟢 Bias: Bullish
1. 🧭 Fundamental Overview:
📈 Massive Institutional Inflows:
Ethereum ETFs have recorded over $1.2 billion in net inflows this July, with $908M just in the week ending July 11. This strong demand from institutional players (notably through ETHA and Bitwise) has pushed ETF AUM above $13.5 billion.
🏢 Corporate Accumulation:
Companies such as SharpLink Gaming have begun adding ETH to their balance sheets. SharpLink's 10,000 ETH (~$49M) purchase highlights growing corporate adoption of Ethereum as a store of value and strategic reserve.
🛠️ Ecosystem Resilience:
Ethereum continues to lead in network upgrades (e.g., Dencun), institutional DeFi, and tokenized assets—strengthening the long-term fundamentals of the chain.
2. 🧠 Sentiment & On‑Chain Metrics
🏦 Institutional Sentiment:
Ethereum ETFs have seen 12 straight weeks of inflows, outperforming Bitcoin in institutional allocation growth (ETH: 1.6%, BTC: 0.8%).
🐋 Whale Activity & Exchange Flows:
Declining ETH balances on exchanges suggest accumulation and reduced sell pressure. Whales and smart money are taking positions.
📊 Public Sentiment:
Bullish expectations remain strong amid price consolidation above key levels and positive ETF momentum.
3. 🔼 Key Levels:
Support: $2,770 and $2,500 (major trendline and psychological level).
4.🎯 Price Targets:
Short‑term (2–4 weeks):
If ETH breaks above $3,150: next targets at $3,400 and $3,750.
Medium‑term (by end of Q3 2025):
ETH could reach $3,500 with potential upside to $4,000.
.
.
.
⚠️ Disclaimer: This analysis is for educational purposes and not financial advice. Please do your own research and risk management.
.
✅ If you like this analysis, don't forget to like 👍, follow 🧠, and share your thoughts below 💬!
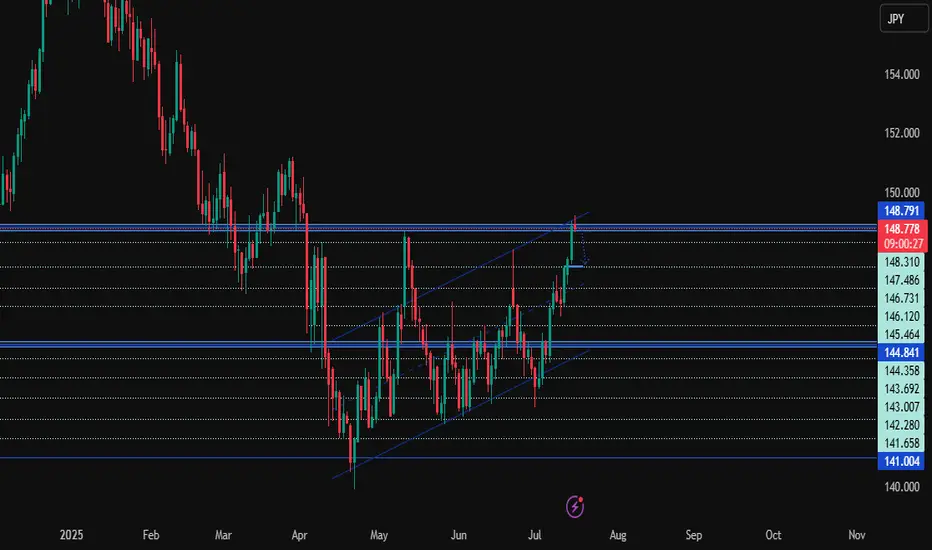
USDJPY Hits Rising Channel Ceiling: Will Bears Take Control?Hey Traders,
USDJPY has just tapped the top of its ascending channel around the 148.70 resistance- an area that has historically triggered bearish reactions. With signs of rejection and waning bullish momentum, we’re now at a potential inflection point for short-term downside retracement.
Current Market Conditions:
Price has reached and slightly wicked above the upper boundary of a rising channel.
Strong resistance zone between 148.70 – 148.79 aligns with prior swing highs.
Early signs of bearish rejection can be seen on the latest candle close.
Short-term structure suggests the potential for a pullback toward 147.48 or lower if sellers gain traction.
Fundamental Analysis/Outlook:
Recent USD strength has been driven by sticky U.S. inflation and hawkish Fed commentary, but JPY fundamentals are catching attention. BoJ is under pressure to shift policy due to rising wage growth and inflation spillover effects. If upcoming Japanese data supports tightening or USD weakens on risk-off sentiment, we could see a meaningful retracement in USDJPY.
Targets:
TP1: 147.486
TP2: 146.120
TP3: 144.841
Risk Management:
Stop-loss: Above 148.80 (channel breakout confirmation)
Maintain a minimum 1:2 R:R.
Trail stops if structure breaks lower (e.g., loss of 147.48 support).
Technical Outlook:
USDJPY has respected the channel boundaries since May. Unless price breaks and closes above 148.79 with strong volume and momentum, the more likely scenario is a pullback. Watch for a bearish engulfing or lower-timeframe double top confirmation to trigger entries.
Conclusion:
We’re seeing a potential top at a well-respected channel ceiling. Unless bulls break and hold above 148.79, USDJPY could be set for a healthy retracement. Keep an eye on U.S. dollar strength and BoJ policy chatter in the coming days.
Sign-off:
“In markets, clarity often lies just beyond the fear. Trade the levels, not the noise.”
💬 Drop your thoughts in the comments, give this idea a boost, and follow for more actionable setups. Stay sharp out there!
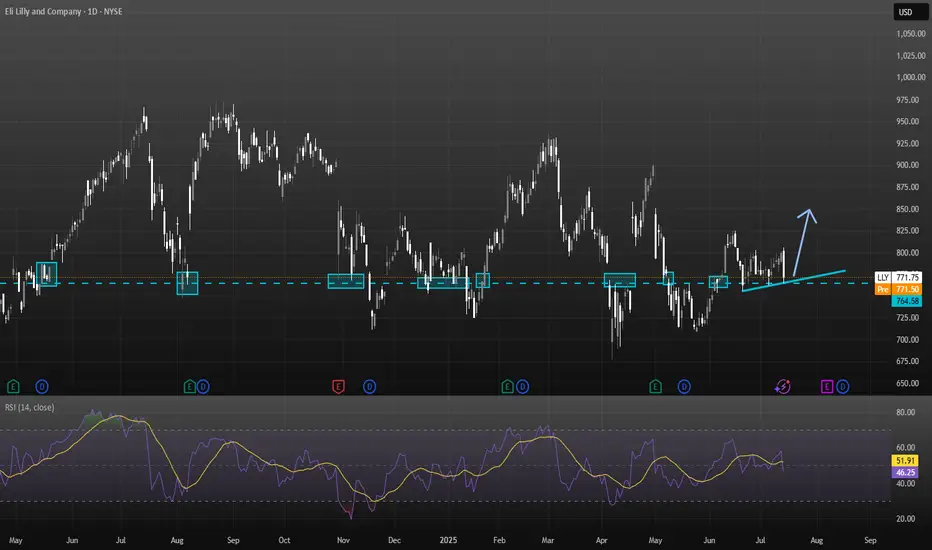
Eli Lilly (LLY) – Full Technical + Fundamental Analysis (July 20
I wanted to take a deeper dive into LLY and analyze more than just trendlines—looking into both the technical structure and the broader fundamentals of the stock.
Sources: i have a list of sources at the end of my report
Technical Breakdown:
Current Price: ~$771.75
Resistance Zone: $950–970 prior rejection levels
Support Zone:
Strong: $760–765 (multiple historical rejections and rebounds).
Secondary: $717 (previous bounce area).
Trendline: Steadily rising higher-lows, supporting price above $760.
RSI: Recently cooled from 79 (overbought) to ~51 (neutral), suggesting balanced conditions. No immediate overbought or oversold signals.
Chart Pattern Summary:
Price respects a higher-low ascending trendline.
Buyers defend $760, but $800+ remains heavy resistance.
Breakdown below $760 risks a drop to ~$717.
Breakout above $800 opens upside toward $950–970.
Growth Catalysts:
1. Zepbound & Mounjaro dominate the obesity/diabetes sector.
2. Retatrutide & Orforglipron (next-gen obesity treatments) could further expand market share by 2026.
3. Revenue growth: ~45% YoY in Q4 2024.
4. Analysts forecast ~15% annual revenue growth and 20%+ EPS CAGR through 2027.
Risks:
1. Q1 2025 saw adjusted EPS guidance trimmed to ~$20.78–22.28 from previous ~$22.50–24, causing ~7% drop in stock .
2. Valuation rich: forward P/E ~35 vs peers like Novo at ~14
3. 025 EPS estimates have slightly fallen (from $22.20 to $21.94) while 2026 expectations rose.
4. New rival Hengrui/Kailera shows ~18–19% weight loss, close to Zepbound’s ~21%, though still pre-approval
5. Regulatory volatility: Trump has floated heavy pharma tariffs (up to 200%) and repatriation incentives; Lilly has U.S. capacity but details remain uncertain
Analyst Sentiment:
Consensus target: $1,000+ within 12–24 months.
MarketBeat & StockAnalysis rate LLY as Strong Buy.
Institutional ownership remains high.
What to Monitor Next
1. FDA approvals for orforglipron or retatrutide (expected late 2025).
2. Next earnings—watch for forward guidance recovery.
3. Policy shifts (potential tariffs on pharma imports).
4. Obesity drug competition (Novo Nordisk, Chinese biosimilars).
Final Position: Modest Long Bias
Eli Lilly is technically holding trendline support while fundamentally leading in a booming therapeutic sector. Together, this makes LLY a long-term buy, though caution near $760 is warranted.
I tried to summaries as short as possible as i didn't want to make this post into an essay
Please note this is not financial advice
Sources Used for Analysis:
1. Eli Lilly Company Filings & Reports
2. Latest Earnings Reports (Q1 2025, prior Q4 2024)
3. Pipeline Updates and FDA Submission News
4. MarketBeat (Analyst ratings & price targets)
5. Yahoo Finance (EPS estimates, revenue growth forecasts)
6. StockAnalysis.com (Valuation ratios, dividend data)
7. Bloomberg and CNBC (News on guidance revisions)
8. Federal Reserve statements and forecasts
9. Bureau of Labor Statistics (BLS) – healthcare inflation data
10. WSJ and Financial Times – reporting on pharma tariffs and global healthcare policy shifts
11. Industry and Sector Insights
12. Novo Nordisk Investor Updates – competitor tracking
13. Statista – Obesity/diabetes global prevalence reports
14. World Health Organization (WHO) reports
15. Standard RSI and trendline patterns (based on TradingView style)
16. Support/resistance zones derived from historical price action Market Sentiment Tools
17. CNN Fear & Greed Index
18. S&P 500 Health Care Sector ETF (XLV) trends
Treat intraday fluctuations as long first and short later!Gold started to rebound near 3322 at the opening. Our long positions near 3324 are also in floating profit. We first focus on the short-term suppression of 3340-3345 on the upper side. The support below is at 3325-3320. We operate in this range. Technically, it needs to rebound and repair the demand when it falls back to 3320, so we can find opportunities to go long to grasp the profit space of the rebound.
4-hour cycle analysis: The strong dividing line of long positions below is at the 3320 first-line mark, and the short-term support focuses on the 3325-3320 range. The overall bullish rhythm of pulling back to lows and going long is maintained. Short-term pressure focuses on around 3340-3345. The overall main tone of participating in the high-altitude and low-multiple cycles remains unchanged relying on this range.
Gold operation strategy: Go long on gold when it falls back to around 3325-3320, target 3335-3340, and continue to hold if it breaks through.

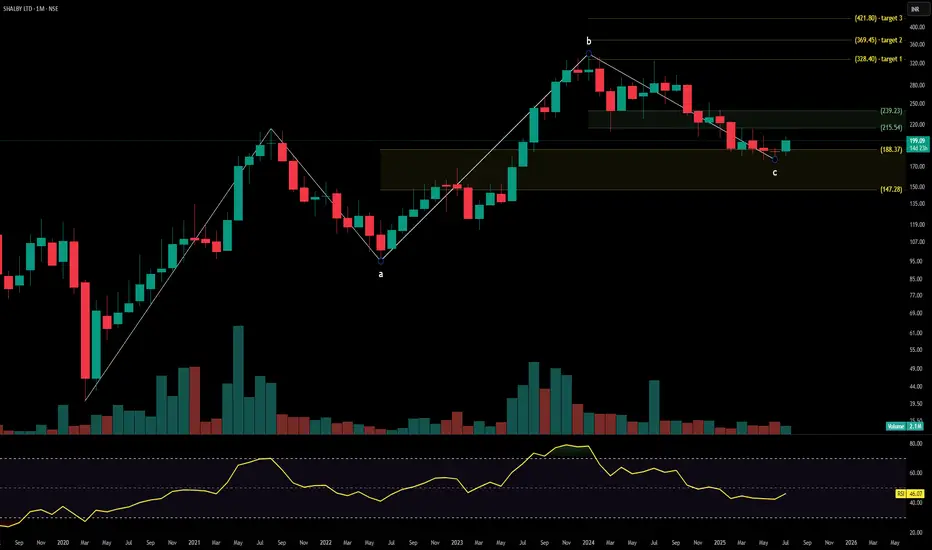
SHALBY HOSPITALSShalby Ltd. is a multi-specialty hospital chain with a strong presence across orthopedics, joint replacement, cardiology, oncology, and critical care services. With operations spanning India and growing international outreach through medical tourism, the company continues to expand its healthcare network via asset-light and franchise models. The stock is currently trading at ₹247.90 and is forming a base on the monthly timeframe after a broad correction. Fibonacci breakout targets are mapped toward ₹328.40, ₹369.45, and ₹421.80.
Shalby Ltd. – FY22–FY25 Snapshot
Sales – ₹607 Cr → ₹682 Cr → ₹748 Cr → ₹816 Cr – Expansion driven by new centers and service diversification
Net Profit – ₹46.3 Cr → ₹52.5 Cr → ₹61.8 Cr → ₹70.2 Cr – Improving earnings with cost optimization
Company Order Book – Moderate → Moderate → Strong → Strong – Increased traction in Tier-2 urban centers and surgical specialties
Dividend Yield (%) – 0.48% → 0.51% → 0.55% → 0.58% – Steady payouts with retained earnings
Operating Performance – Moderate → Moderate → Strong → Strong – Margin uplift from blended specialty mix
Equity Capital – ₹10.87 Cr (constant) – Efficient capital structure
Total Debt – ₹158 Cr → ₹148 Cr → ₹137 Cr → ₹125 Cr – Gradual deleveraging
Total Liabilities – ₹450 Cr → ₹464 Cr → ₹478 Cr → ₹494 Cr – Scaling with clinical expansion
Fixed Assets – ₹185 Cr → ₹192 Cr → ₹201 Cr → ₹210 Cr – Conservative capex, focused on infra and surgical equipment
Latest Highlights FY25 net profit rose 13.5% YoY to ₹70.2 Cr; revenue increased 9.1% to ₹816 Cr EPS: ₹6.46 | EBITDA Margin: 21.8% | Net Margin: 8.60% Return on Equity: 15.94% | Return on Assets: 9.37% Promoter holding: 71.63% | Dividend Yield: 0.58% Expansion into Udaipur, Surat, and Indore driving specialty-led patient volume Medical tourism and robotic surgery verticals gaining revenue traction
Institutional Interest & Ownership Trends Promoter holding remains strong at 71.63% with no dilution or pledging. Mutual fund positions have remained steady, while HNI accumulation is visible via delivery volumes in Q1 FY26. FII participation remains minimal, with domestic interest driving stability in ownership structure.
Business Growth Verdict Yes, Shalby is growing steadily with diversified service lines Margins and return metrics are trending upward Debt reduction is consistent and manageable Asset-light model enhances scalability without aggressive capex
Company Guidance Management expects FY26 revenue to cross ₹900 Cr+ with mid-teen margin targets. Growth will be led by expansion in cardiac care, ortho surgeries, and increased occupancy across existing units.
Final Investment Verdict Shalby Ltd. offers a disciplined healthcare growth story with consistent profitability, high promoter confidence, and expanding patient base. The asset-light hospital expansion and focus on surgical verticals provide margin support. Technical structure indicates breakout potential above ₹239–₹247 zone with medium-term targets mapped at ₹328.40, ₹369.45, and ₹421.80, making the stock attractive for staggered accumulation by investors seeking healthcare exposure in the mid-cap space.
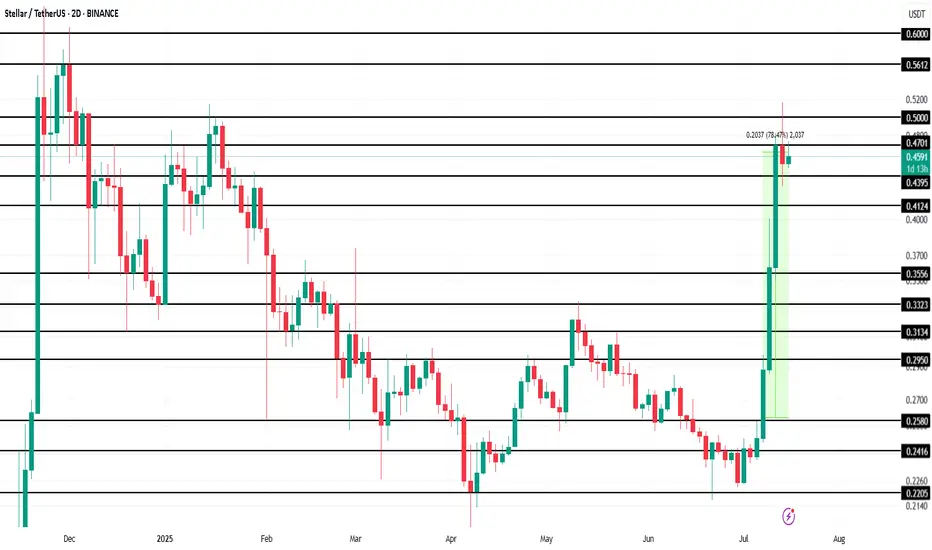
Stellar (XLM) Makes History Amid 78% Price Surge This WeekBINANCE:XLMUSDT is currently trading at $0.46, up 78.5% over the past week . However, the altcoin faces resistance at $0.47, a level it has struggled to breach in recent days. The ability to break this resistance is crucial for continued growth, as it will determine whether XLM can push higher.
BINANCE:XLMUSDT futures market activity has also surged, with Futures Open Interest hitting an all-time high of $520 million in the last 24 hours. This indicates that traders are increasingly interested in the asset's derivatives, which are capitalizing on its rise.
Given the strong sentiment from futures traders and the technical indicators, it is likely that BINANCE:XLMUSDT will push past the $0.47 resistance and target $0.50 in the coming days . A successful breakthrough could lead XLM toward its next target at $0.56, marking an eight-month high. This would signify continued strength for the asset.
However, if the broader market sentiment shifts or investors begin to sell their holdings, BINANCE:XLMUSDT could face a significant pullback. If the price falls below the key support levels of $0.43 and $0.41 , it could slide further to $0.35, which would invalidate the current bullish outlook.
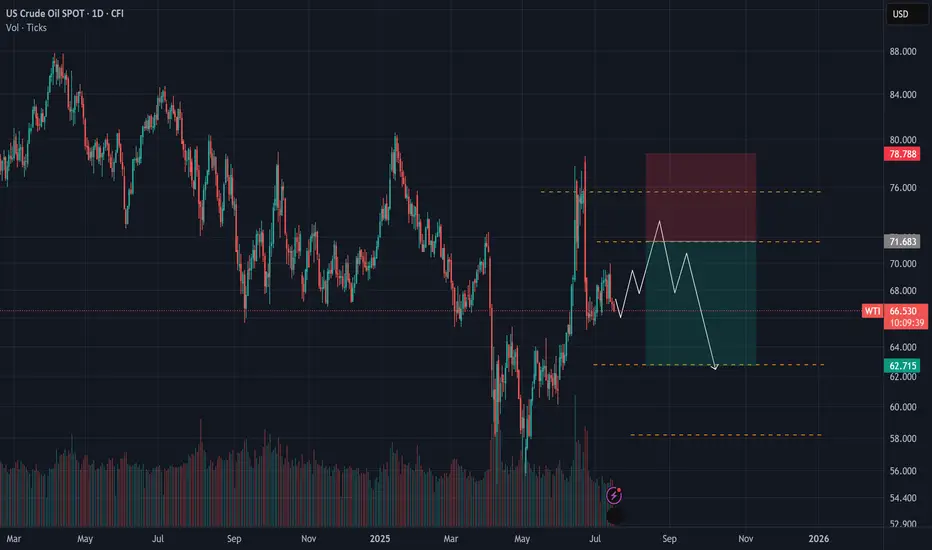
WTI Crude Oil Analysis – July 15, 2025Following recent Middle East tensions, WTI crude oil briefly surged to around $77.
However, the price quickly retraced back to its previous range and seems to have resumed its prior downward trajectory — characterized by a gradual bearish slope.
🔍 It’s important to remember that before the geopolitical events, analysts were eyeing the $52 level as a potential target.
Now, with liquidity being absorbed around the $70 area, that bearish scenario remains valid.
📉 Unless oil decisively breaks above key resistance levels, the outlook continues to favor a slow, downward trend.
Hindustan Petroleum Corporation LtdHindustan Petroleum Corporation Ltd is mainly engaged in the business of refining of crude oil and marketing of petroleum products, production of hydrocarbons as well as providing services for management of E&P Blocks
Current Price
₹ 446
High / Low
₹ 457 / 288
Stock P/E
14.1
Book Value
₹ 240
Dividend Yield
2.34 %
ROCE
10.5 %
ROE
13.7 %
Face Value
₹ 10.0
Price to book value
1.80
Intrinsic Value
₹ 289
PEG Ratio
0.97
Price to Sales
0.22
Debt
₹ 70,558 Cr.
Debt to equity
1.38
Int Coverage
3.67

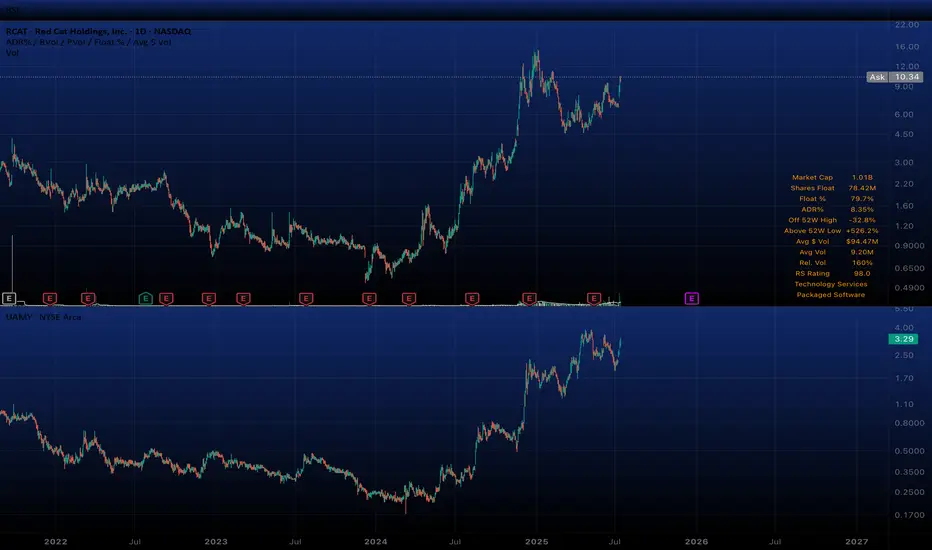
$RCAT $UAMY LONGNASDAQ:RCAT AMEX:UAMY
“If you’re good at something, never do it for free.”
AND one of the hardest you should learn things to judge is what level of risk is safe.
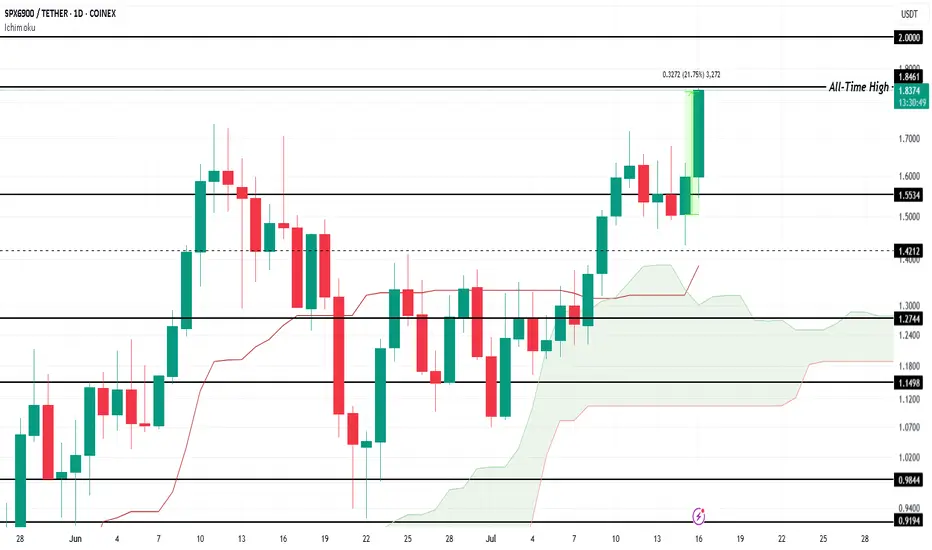
SPX Forms New All-Time High, Price Nears $2.00COINEX:SPXUSDT price has surged by 21.75% over the last 24 hours , reaching a new all-time high (ATH) of $1.84 . At the time of writing, SPX is trading at $1.83, showing promising signs of further upward movement. The altcoin's strong performance reflects growing investor interest and market optimism.
The Ichimoku Cloud, which lies beneath the candlesticks, signals that bullish momentum is currently prevailing for $COINEX:SPXUSDT. This technical indicator suggests that the altcoin could continue its ascent, potentially breaching the $2.00 level in the near future . If the trend persists, SPX could set new price milestones.
However, if COINEX:SPXUSDT experiences significant selling pressure from investors, the altcoin could face a correction. A drop below $1.55 would indicate a shift in momentum and potentially erase some of the recent gains. A failure to maintain key support levels could lead to further downside risks.
Gold (XAU/USD) Analysis – July 15, 2025As outlined in our previous analyses, we anticipated a potential reversal before gold could reach the $3400 zone.
We also noted that any upward movement followed by a solid rejection could offer a valid short (sell) opportunity.
📉 Yesterday’s market reaction to the CPI release, with a drop of nearly 500 pips, has now confirmed this bearish setup.
📌 Based on current price structure, the $3350–$3360 area appears ideal for seeking short entries.
🎯 All target levels previously mentioned remain valid and in play.

The Case for Solar Tracker Infrastructure (NXT) NASDAQ:NXT
THE CONCEPT
Superficially, the solar infrastructure sector appears to be just another subset of the cyclical renewable energy market, heavily influenced by commodity pricing, subsidies, and Chinese overcapacity. This view, while partially accurate, overlooks a deeper dynamic now unfolding in the utility-scale solar ecosystem: the emergence of solar trackers, specifically Nextracker (NXT), as a default layer of infrastructure that enhances energy yield, drives project economics, and becomes essential to capturing IRR in large-scale solar development.
The true attraction of companies like NXT lies not in their participation in the solar value chain but in their ability to compound earnings by becoming the default standard in project infrastructure. As utility developers increasingly seek higher ROI and shorter time-to-completion, tracker systems with proven yield enhancements and robust reliability are becoming indispensable. What began as a technological upgrade is now evolving into an infrastructure platform with software-defined margins, long product lifecycles, and embedded switching costs.
If this dynamic is recognized by investors, NXT may undergo a valuation re-rating, as happened with other asset-light infrastructure providers in the past. The process is potentially self-reinforcing: tracker adoption increases → project IRRs improve → developers standardize on proven providers → NXT backlog and margins grow → investor recognition expands → valuation multiple rises → NXT scales further, increasing its data advantage and competitive moat.
ANALYTICAL APPROACH
The conventional method of evaluating solar-linked equities—projecting demand growth for solar installations and then applying a valuation multiple based on cyclical earnings—is insufficient in this case. NXT’s trajectory is not merely a function of solar penetration; it depends critically on its ability to convert adoption into infrastructure entrenchment. The valuation multiple itself reflects investor understanding of this transition.
Instead of isolating earnings and then applying an arbitrary multiple, we analyze the self-reinforcing process of tracker adoption, profitability, and recognition. We identify three interlocking drivers:
The effective return on solar projects equipped with tracker systems
The penetration rate of trackers in utility-scale solar globally
Investor recognition of NXT as a long-term infrastructure platform rather than a cyclical solar component supplier
THE SCENARIO
Act One: The Emergence of the Infra Layer (2023–2025)
At present, the effective return on utility-scale solar projects is entering a new phase. While panel prices continue to decline due to Chinese oversupply (falling below $0.16/W in the U.S.), project economics are improving due to two compounding forces: rising electricity demand (particularly from AI, EVs, and data centers) and software-enhanced yield optimization from tracker platforms.
NXT's tracker systems, enhanced by machine-learning algorithms like TrueCapture, are capable of increasing energy yield by 15–25%, a material change in IRR for developers. Meanwhile, the total cost of tracker systems has declined enough to reach mass adoption thresholds, especially in markets like the U.S., where NXT holds a 57% share. Tracker usage in new U.S. projects now exceeds 95%, while global adoption is climbing from 40–45%.
Investor recognition is still partial; NXT trades at ~15x earnings despite 30% EPS growth and a $4.5B backlog. The process has just begun, but the initial indicators of self-reinforcing dynamics are visible.
Act Two: Recognition and Rerating (2025–2027)
As demand for electricity continues to grow and renewable installations scale with it, tracker systems become default components in new builds. Developers now see tracker-equipped plants as the norm, not an upgrade. Projects from 2025 onward increasingly retroactively upgrade from fixed-mount systems.
Investors begin to grasp the role of NXT as a high-margin infrastructure provider. The shift in narrative—from cyclical solar to embedded utility infrastructure—leads to a re-rating. Price-to-earnings multiples begin to reflect platform-like characteristics: recurring software revenue, long product cycles, data network effects, and entrenched customer relationships. The company’s moat, built on both hardware reliability (30-year durability) and proprietary software trained on years of operational solar data, becomes widely recognized.
Investor multiples compress slightly to reflect maturity but remain above historical solar averages due to sticky revenue, data leverage, and infrastructure resilience.
EVALUATION
The shakeout is still years away. Until then, NXT is positioned to benefit from a global shift in energy infrastructure. The real risk at present is not from saturation but from investor miscategorization. If NXT continues to be treated as a cyclical solar stock, it may remain undervalued despite strong fundamentals and compelling growth.
The key vulnerability lies in the macro environment. Should global renewable demand stall due to policy reversals (e.g., rollback of IRA credits), or should Chinese entrants successfully replicate NXT’s software and reliability at scale, the thesis may weaken. However, even in such cases, the cost structure of tracker-enhanced solar remains globally competitive, and NXT’s backlog and historical performance offer downside protection.
Yet, it must be acknowledged that current market sentiment favors nuclear-related equities, driven by political narratives of energy security and bipartisan support for nuclear expansion. Nuclear stocks are being re-rated on the expectation of long-term baseload reliability, even though their LCOE remains higher and their construction timelines are far longer than utility-scale solar. This sentiment bias may delay investor recognition of NXT’s strategic role as an infrastructure platform.
If the self-reinforcing process plays out as expected, NXT could deliver the compound benefits of scale, margin expansion, and multiple re-rating. The capital appreciation potential mirrors the early phases of other infrastructure transitions—cable, fiber, datacenter REITs—where early recognition translated into multiyear equity outperformance.
USD/CHF on the rise!The recent rebound of the US dollar has led to a decline in the Swiss franc against it, similar to other major currencies. The US dollar is also expected to show further strength in the coming period, supported by recent positive economic data, most notably, and the annual Consumer Price Index (CPI) - which came in at 2.7%, the highest reading in the last four releases.
This last CPI reading holds particular significance, as the Federal Reserve (Fed) is closely watching it, especially with expectations that the impact of tariffs may start to appear from this and the next reading.
Positive inflation data and a stable labor market give the Fed the flexibility to maintain steady interest rates in the near term, which could support further USD strength. The impact of all this economic data is expected to diminish as we approach August 1, the date when tariffs are set to resume, according to US President Donald Trump.
The world is closely watching how the tariff issue will unfold and whether trade agreements will be reached before that date. All of this directly affects global markets and the US dollar. For these reasons, traders should closely monitor the news, as developments are rapidly changing and appear daily, especially statements from the US President regarding tariffs.
Technical outlook
From a technical perspective, the USD/CHF pair is trading in an uptrend on the 4-hour chart. Its recent pullback to the 0.79419 level is considered corrective, with the uptrend likely to resume and target the 0.79997 level.
However, if the price drops below the 0.79193 level and forms a lower low on the 4-hour chart, this would signal a trend reversal from bullish to bearish, invalidating the bullish scenario mentioned above.

GBPJPYSell. Market Execution. trade 1:2. risk 0.50%
Enter in Sell because Market retest Seller's Zone.


CHZ (Chiliz) Analysis – July 15, 2025 Since breaking above the $0.03 level back in 2021,
CHZ surged to nearly $0.80, recording an impressive 3,500% gain.
🧠 This move indicates that major investors entered at lower levels,
while short-term holders who bought higher have been taking profits on every price rally,
effectively capping further upside momentum in the past.
Now, after 4 years, the price has returned to the $0.03 zone — a historically significant area that marked the start of the previous bull run.
🎯 A minimum 100% upside from this level is quite reasonable,
targeting around $0.08 in the short to medium term.
✅ For more impatient investors seeking faster exits,
$0.05 can be considered an optimal short-term take-profit level.

Sei Analysis – July 15, 2025
Sei appears to be forming a clear classic corrective pattern.
After rallying from $0.09 to $1.10,
it seems to have completed its correction through two downward legs.
🔁 The recent price action shows a bullish reaction near the previous low,
suggesting that Sei might now be in a strong accumulation zone.
📌 For a more conservative entry, waiting for price to approach $0.25 could provide a better risk/reward setup.
🎯 With a confirmed rebound, a move toward the $1.12 level — roughly a 300% gain — becomes a realistic target.
