Is the $BULL Ready to Run? A perfect storm of good news here.
June 30 was the last day to redeem $BULLZ warrants. The overhang of insiders dumping shares to arbitrage warrants is gone.
This happened just in time to catch the sector tailwinds from the NASDAQ:HOOD announcement of tokenized public and private assets rolling out in Europe.
WeBull has integrated the NASDAQ:COIN CaaS offering for crypto trading, augmenting its crypto exposure and pairing nicely with Kalshi's integrated hourly crypto contracts. With favorable crypto legislation coming out of the current administration, WeBull is perfectly primed to take advantage of the trend, coupling stock and crypto trading into one neat platform.
Today, July 1, we saw massive volume on call contracts - a 44% increase to average daily volume.
17% YoY growth of user base since Q1 of '24 and a 66% YoY increase in AUM. With revenues on the rise, I would fully expect positive margins this year.
Should be a fun one as we start to catch momentum.
Fundamental Analysis

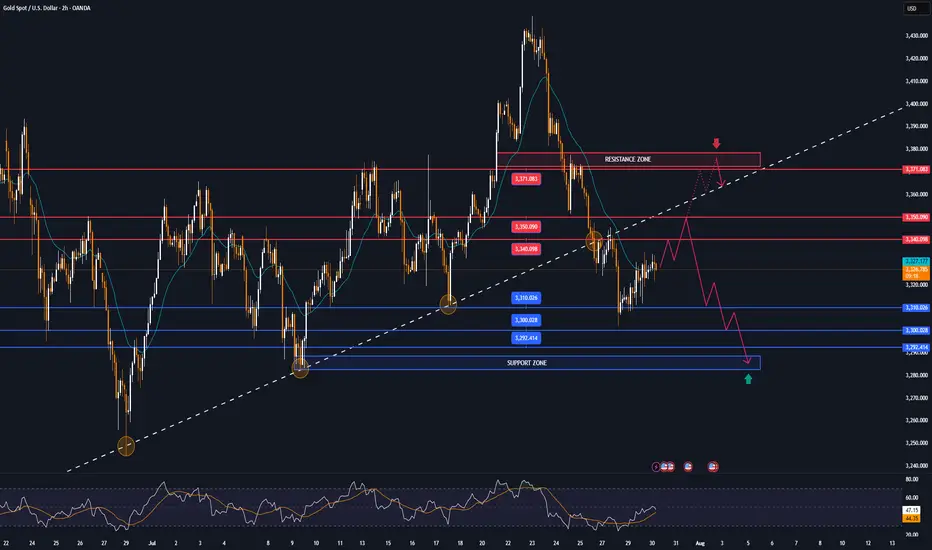
GOLD recovers after many days of declineOANDA:XAUUSD has recovered after several days of declines. Investors will focus on the Federal Reserve's interest rate decision on Wednesday, which is expected to cause significant market volatility.
Gold hit a three-week low of $3,301 an ounce on Monday, before recovering somewhat on Tuesday after falling for a fourth straight day as the dollar erased some of its earlier gains, boosting demand for the precious metal.
Falling US Treasury yields and a weak US jobs report also prompted investors to buy gold.
Data released by the U.S. Labor Department on Tuesday showed the number of jobs added fell in June after two straight months of gains.
The number of jobs added in June fell to 7.44 million from a revised 7.71 million in May. The median forecast of economists in a survey was 7.5 million.
Focus on the Federal Reserve's decision
The Federal Reserve will announce its interest rate decision at 01:00 IST on Thursday; Federal Reserve Chairman Powell will hold a press conference on monetary policy at 01:30 IST on the same day.
The market generally expects the Federal Reserve to keep interest rates unchanged, with the focus on whether Fed Chairman Powell's speech will provide any clues about the timing or pace of future rate cuts.
The market sees a very low chance of a rate cut in July and a roughly 40% chance of another rate cut in September, up from about 10% last month, according to the Chicago Mercantile Exchange's FedWatch tool. Investors will be closely watching the statement and Fed Chairman Powell's remarks at his post-meeting press conference for fresh clues on the timing of the next rate cut.
- If Powell opens the door to a rate cut in September, citing the recent trade deal as a reason to ease uncertainty, US Treasury yields could fall immediately, paving the way for gold prices to rise.
- On the other hand, if Powell avoids committing to a rate cut at this meeting, citing recent rising inflation data, gold prices could fall.
Gold typically performs well in low-interest-rate environments because it does not pay interest and its appeal increases when returns from other assets decline.
Technical Outlook Analysis OANDA:XAUUSD
Gold has recovered from the key $3,300 price point and is holding above $3,310, which is also the nearest support. However, the current recovery is not technically enough to create a short-term uptrend, or conditions for a sustained price increase. In terms of position, gold is under pressure with the 21-day EMA as the nearest resistance at around $3,340 – $3,350. If gold falls below the 0.382% Fibonacci retracement level, it will be eligible to open a new downtrend with a target of around $3,246 in the short term, more than the 0.50% Fibonacci retracement level.
On the other hand, RSI is below 50, and the current 50 level acts as momentum resistance in the short term. If RSI slopes down, it will signal bearish momentum with more downside ahead. For gold to qualify for bullish expectations, it needs to at least push price action above EMA21, then retrace back to the price channels and finally break above the 0.236% Fibonacci retracement level to confirm bullish conditions. The upside target could be towards $3,400 in the short term, more like $3,430 – $3,450.
For the day, the technical outlook for gold prices tends to lean more towards the downside, with the following notable points listed.
Support: 3,310 – 3,300 – 3,292 USD
Resistance: 3,340 – 3,350 – 3,371 USD
SELL XAUUSD PRICE 3376 - 3374⚡️
↠↠ Stop Loss 3380
→Take Profit 1 3368
↨
→Take Profit 2 3362
BUY XAUUSD PRICE 3280 - 3282⚡️
↠↠ Stop Loss 3276
→Take Profit 1 3288
↨
→Take Profit 2 3294
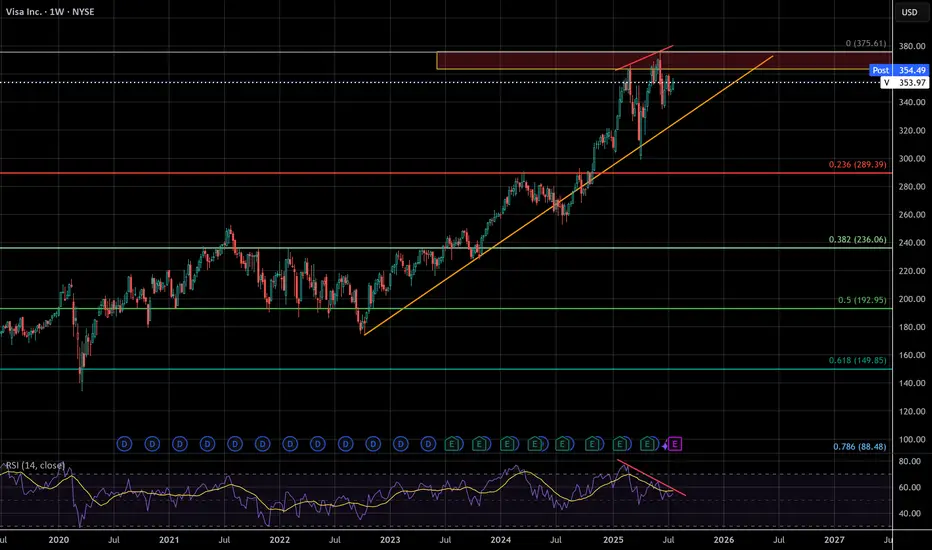
VISA - The missing puzzle piece - Suffering from successI've seen a lot of negative sentiment online lately about the impending bubble, but even with social media, crude AI, and the US dollar being the peak of that negativity this whale has been dying slowly and few have taken notice.
VISA has begun to censor what can be bought, overcharge merchants, and short change banks on interchange fees. These are acts of desperation as growth reaches diminishing returns, the beginning decline of a massive company. Think about it, who isn't using visa already? They have to wait for new users to be born. There will only ever be more competition, competition that has superior speed, accuracy, efficiency, and cost.
VISA may not lead this crash, but it's days look to be numbered unless they make radical changes . According to google results, antitrust violations can carry 3 times the monetary penalty gained from illegal activity. I don't think this will happen, but it's a TON of leverage for a massive settlement. The cracks are just beginning, but this company is made of glass
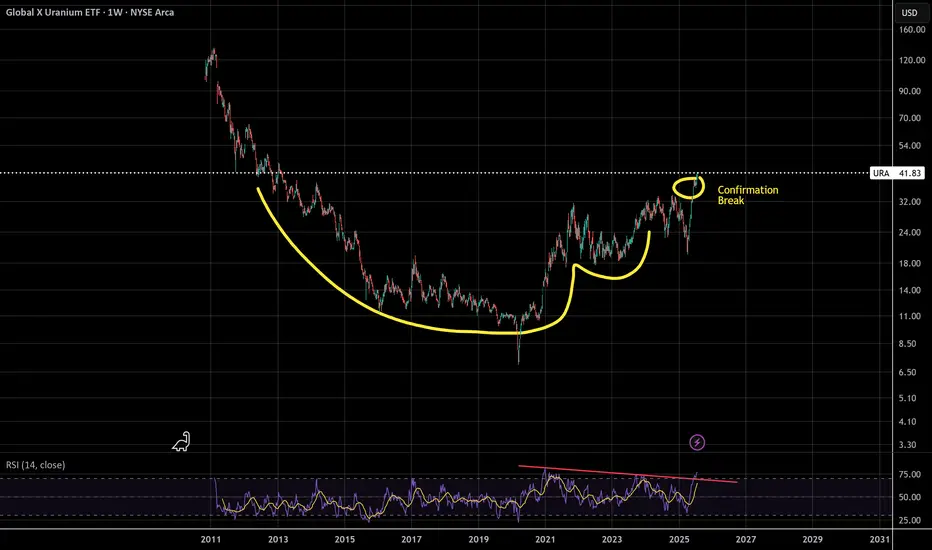
Messy Cup and HandleURA continues to pump as nuclear energy speculation goes wild but be careful, if tech goes down it may just take down nuclear with it. Tariffs can also cause a massive price swing, my guess is that if Canada is tariffed the cost of URA will go through the roof
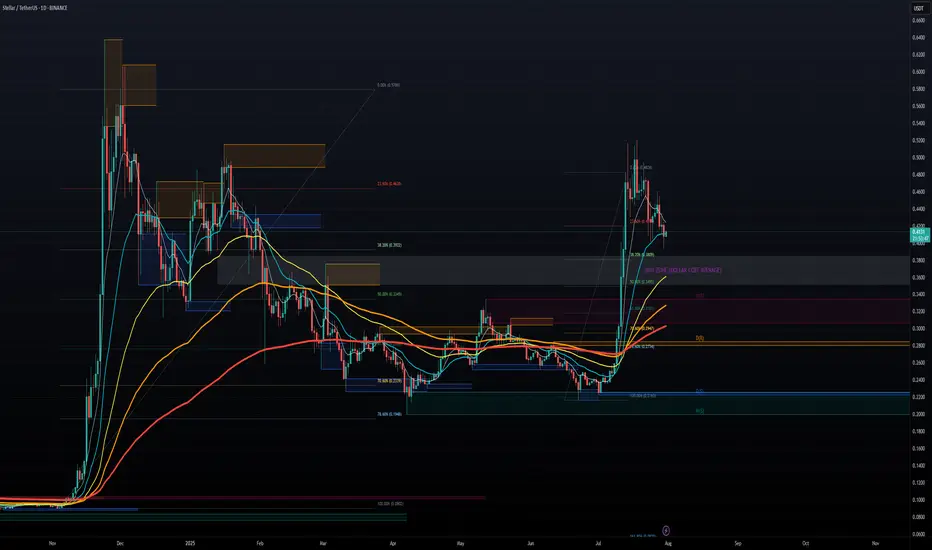
STELLAR LUMENS - DOLLAR COST AVERAGE FOR LONG TERM GAINSSTELLAR LUMENS (XLM) has taken off late 2024 from under .10 cents and now trading at .40 cents for a 400% Gain in 6 months so far, and there is much more upside to come potentially. It hit all time highs around .50 cents and now the token seems to want to test those highs in the near term 2025, we can easily see XLM approach $1.00 towards 2026 for a 100% gain and even higher longer term. Overall, XLM moves with XRP and we all know XRP is a blue chip project, it has all the funds and institutional backing, and so does XLM.
Both projects share a common creator in Jed McCaleb, however they have different focuses. Ripple, and its native token XRP, was initially designed to facilitate cross-border payments for financial institutions. Stellar, on the other hand, focuses on financial inclusion and aims to provide accessible financial services for individuals, including remittances and access to banking services.
CAN WE SAY BULLISH?! TO THE MOON!!!
GBPUSD Approaching Channel Support — Rebound Ahead?GBPUSD is nearing the bottom of a well-defined bearish channel while Stoch RSI begins to curl upward.
📌 Bearish channel structure intact
📌 Possible bounce off ~$1.322 zone
⏱️ Timeframe: 1H
#gbpusd #forex #tradingstrategy #channeltrading #technicalanalysis #quanttradingpro #tradingview

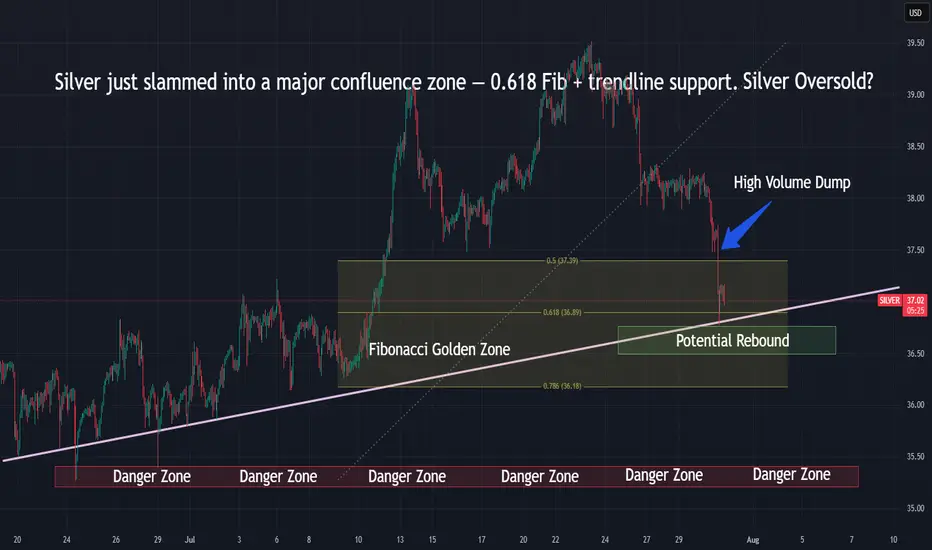
Silver Hits Fibonacci Support — Rebound or Dump?Silver just slammed into the 0.618 Fib — a key reversal zone.
📌 Eyes on bounce or breakdown toward the danger zone below $36
⏱️ Timeframe: 1H
#silver #xagusd #fibonacci #commodities #tradingstrategy #tradingview #quanttradingpro
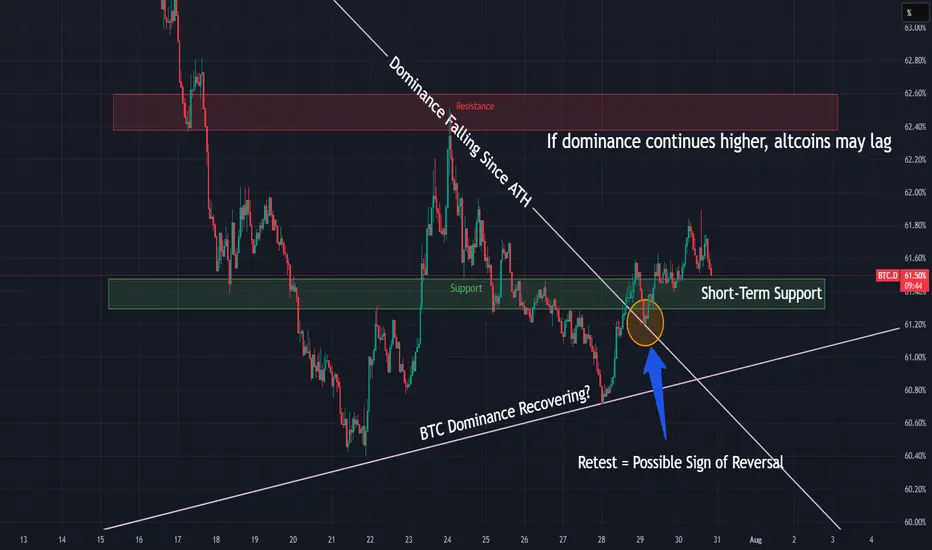
BTC Dominance Breaking Out — Rotation Incoming?BTC Dominance just broke a major downtrend and is holding above the breakout level — a possible shift in market control.
📌 If dominance continues higher, altcoins may lag
📌 Resistance zone at 62.5% could cap the move
⏱️ Timeframe: 1H
#btcd #bitcoin #altseason #dominance #marketcycle #quanttradingpro #tradingview
Sell at 3280 to 3240 buy at 3240 to 3400Gold is in a strong sell-off due to the volumes offered so that the strongest party, China, can buy from the maximum can bring them profits, which is the maximum point at June 30.

$BTCUSD, rally into rate cuts?BITSTAMP:BTCUSD has been coiling for some time now in a right angled descending broadening wedge.
A measured move of this cone so far would place BTC at right around ~$100k.
This aligns well with historical performance of BTC heading into a cutting cycle. If we rally into September and have a selloff following the cuts (sell the news), I wouldn't be shocked. This is a pattern that has happened in multiple years of the previous QE/QT Cycle (2016/2017, 2019/2020).
The real fireworks will be in 2025 if things go according to the FED's schedule

Daily Analysis- XAUUSD (Thursday, 31st July 2025)Bias: Bearish
USD News(Red Folder):
-Average Hourly Earnings m/m
-Non-Farm Employment Change
-Unemployment Rate
-ISM Manufacturing PMI
Notes:
- No rate cut imposed, no decision made on September rate cut
- Looking for continuation to the downside
- Potential SELL if there's
confirmation on lower timeframe
- Pivot point: 3310
Disclaimer:
This analysis is from a personal point of view, always conduct on your own research before making any trading decisions as the analysis do not guarantee complete accuracy.

XAUUSD long day trade idea hello
day trading idea long up to 3372-3383 price zone
fibonaci levels , maybe 3390

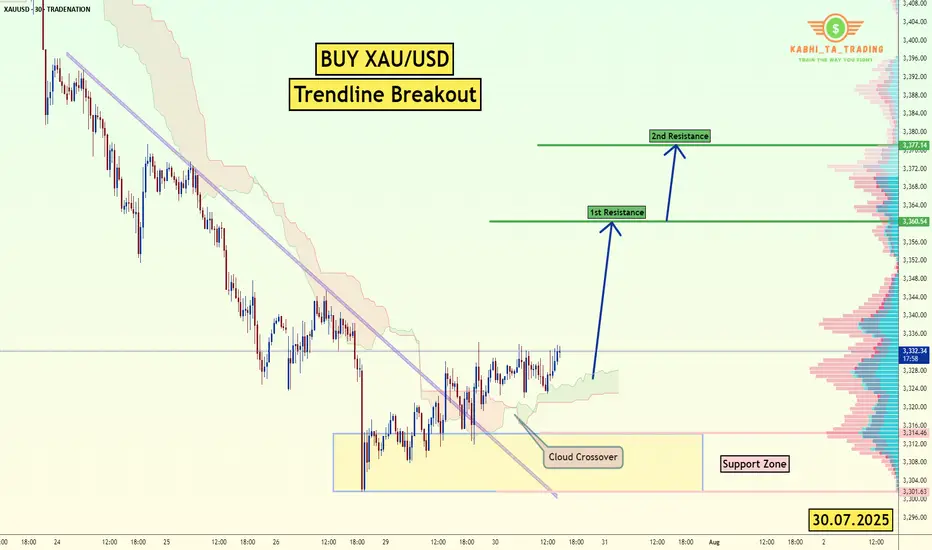
XAU/USD Trendline Breakout (30.07.2025)The XAU/USD pair on the M30 timeframe presents a Potential Buying Opportunity due to a recent Formation of a Trendline Breakout Pattern. This suggests a shift in momentum towards the upside and a higher likelihood of further advances in the coming hours.
Possible Long Trade:
Entry: Consider Entering A Long Position around Trendline Of The Pattern.
Target Levels:
1st Resistance – 3360
2nd Resistance – 3377
🎁 Please hit the like button and
🎁 Leave a comment to support for My Post !
Your likes and comments are incredibly motivating and will encourage me to share more analysis with you.
Best Regards, KABHI_TA_TRADING
Thank you.
Disclosure: I am part of Trade Nation's Influencer program and receive a monthly fee for using their TradingView charts in my analysis.
MARA: Mining Bitcoin, Diluting ShareholdersMarathon's Q2 results were great. Revenue up 64% to $238M, adjusted EBITDA exploding 1,093% to $1.2 billion, and swinging from a $200M loss to an $808M profit year-over-year. Those are eye-popping numbers that deserve scrutiny. The massive EBITDA jump and profit turnaround are largely driven by Bitcoin's mark-to-market gains, not operational improvements.
What continues to concern me is the dilution story. That $940.5 million raise they just completed might provide "strategic dry powder," but it's coming at the expense of existing shareholders. The company has been aggressively issuing equity, and while the recent numbers look impressive, a significant portion of that value creation is paper gains tied to crypto appreciation.
They're making progress on vertical integration, but a meaningful chunk of their hashrate still relies on third-party hosting arrangements. The all-in mining costs remain a key metric to watch—strong Bitcoin prices can mask underlying operational inefficiencies.
The timing of these results is also worth noting. MARA, like other miners, benefited enormously from Bitcoin's run to new highs and the broader institutional adoption wave we've seen with ETFs and corporate treasury strategies. But as CEO Fred Thiel himself has warned, there are signs of frothiness in the market reminiscent of previous crypto bubbles.
The AI and HPC initiatives still read like a work in progress. While the company talks a good game about diversification beyond pure Bitcoin mining, material revenue contributions from these ventures remain elusive.
Here's my take: MARA's Q2 numbers reflect the perfect storm of operational scale meeting a Bitcoin bull market. The company has undoubtedly grown its mining capacity and BTC holdings significantly. But the headline-grabbing profitability is heavily dependent on crypto valuations staying elevated.
For investors considering MARA at current levels, the key question isn't whether they can deliver strong numbers in a Bitcoin bull market—they've proven they can. It's whether the business model is resilient enough to generate attractive returns if Bitcoin faces a meaningful correction. Given the company's ongoing dilution, operational leverage to BTC prices, and rich valuation multiples, I'd argue there's limited margin of safety built into the current stock price.

NAS - LET'S MAKE MILLIONS Team, last night NAS I was expect the FALL BACK as I predicted rate un-change will get NASTY on both DOW AND NAS.
So I have a set up entry LONG, i didnt expect the NAS flying to the moon.
both target hit so fast in 15 minutes
However, today is another opportunity to SHORT NAS on the current market at 23613-23625
STOP LOSS AT 23720
Once the NAS pull back toward 23580-65 - BRING STOP LOSS TO BE
TARGET 1: at 23540-20
TARGET 2: at 23480-65
LETS GO

BTC.D FIB Lvl RejectionI'm liking the recent pullback in Bitcoin dominance - we're finally getting a taste of those altcoin gains we last saw around December. Each time dominance hits a key level on the Fibonacci retracement, we tend to see a pullback, and this recent rejection near the 0.786 level is no exception. It's a recurring pattern worth keeping an eye on.
That said, I still believe there’s a chance for one final rally in Bitcoin dominance - a potential shakeout before the real altseason begins. Historically, when Bitcoin breaks out of consolidation and pushes to new all-time highs with strong displacement, dominance tends to dip shortly after. So if BTCUSD continues to range at these current levels, I wouldn’t be surprised to see dominance spike again before we get the real altcoin momentum everyone’s waiting for.
This can also relate to what I've been reviewing in my previous charts published on my page

SMC ✅ Strengths:
• Previous mitigation of institutional interest zones (1H FVG).
• BOS (Break of Structure) indicating bullish intent.
• Entry located at the 5M OB, which coincides with support and fake out (consistent with liquidity re-entry).
• TP is aligned with the previous resistance and distribution zone, which provides a good RR (2.23).
Good luck Traders

Potentially more volatilityThe daily chart in the S&P 500 implies the possibility of additional volatility as more fundamental news is revealed on Thursday and Friday. The bias currently is for continuation to the upside.

XAUUSD
XAUUSD Updated in 30M :
After the big drop in gold, two scenarios can be predicted for this precious metal.

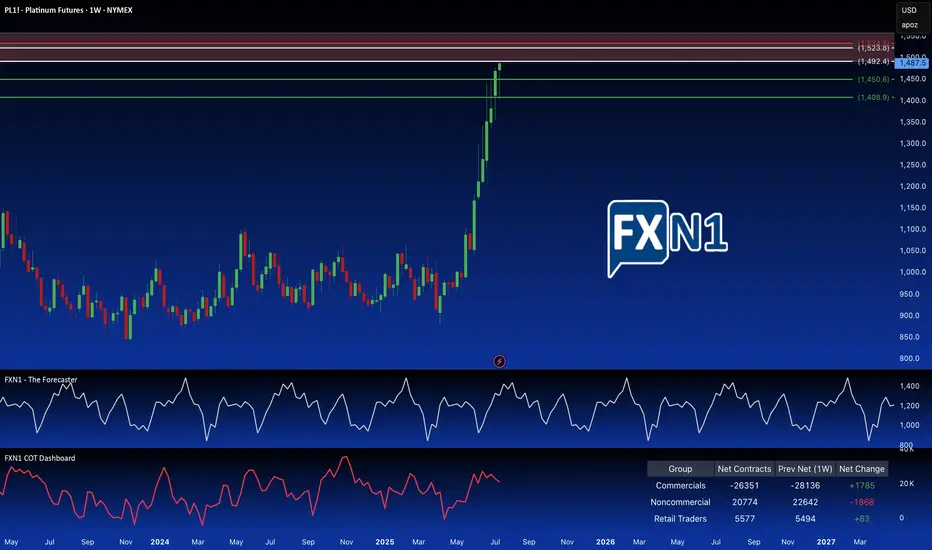
Platinum: Breaking the Supply Barrier?I'm adding a second Platinum position. Price has hit a strong weekly supply area, also a significant monthly supply zone. I'm anticipating a reversal here, as non-commercial holdings are decreasing, and seasonal patterns suggest a potential trend change. To further capitalize on potential upside, I've placed a pending order above the primary supply zone, at a slightly higher, but still relevant. These are older, established and fresh supply zones.
(Note: Reducing the chart size may help to better visualize the long-term significance of these overlapping areas.)
✅ Please share your thoughts about PL1! in the comments section below and HIT LIKE if you appreciate my analysis. Don't forget to FOLLOW ME; you will help us a lot with this small contribution.
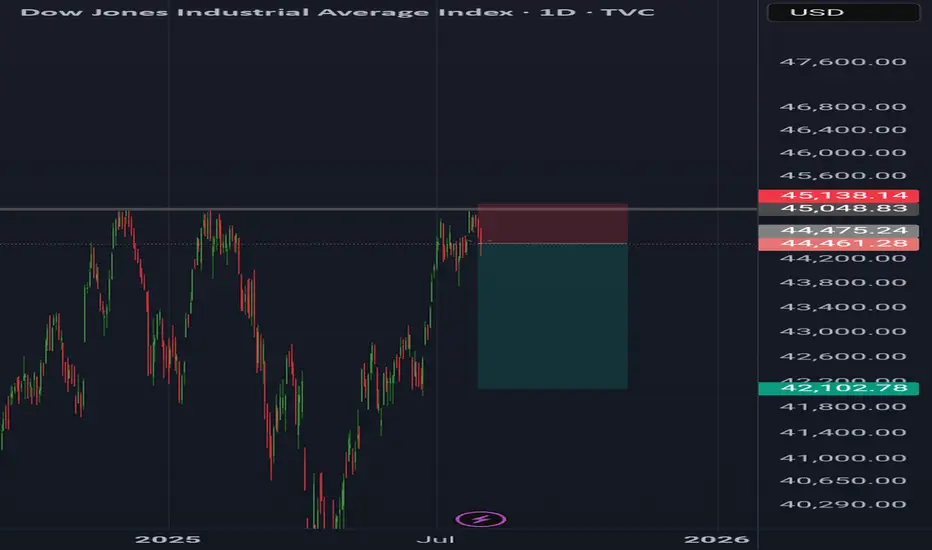
Dow jonesDow Jones daily analysis
Time frame daily
Risk rewards ratio >3.5
Short position
Because price couldn't break the 45.048 again and earthquake in 5he east of Russia and Japan makes the markets drop down
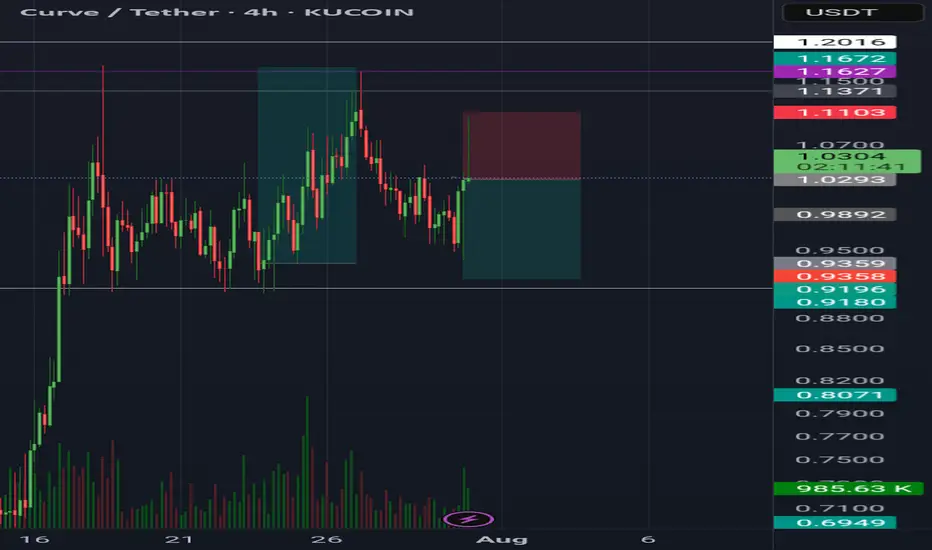
CurveCrv usdt daily analysis
Time frame 4 hours
Risk rewards ratio >1.3
Target 0.92$
Short position because of earthquake in the Russia
USDJPY (daily + Monthly analysis)hi everyone happy trading as always hope this video finds you some value.
