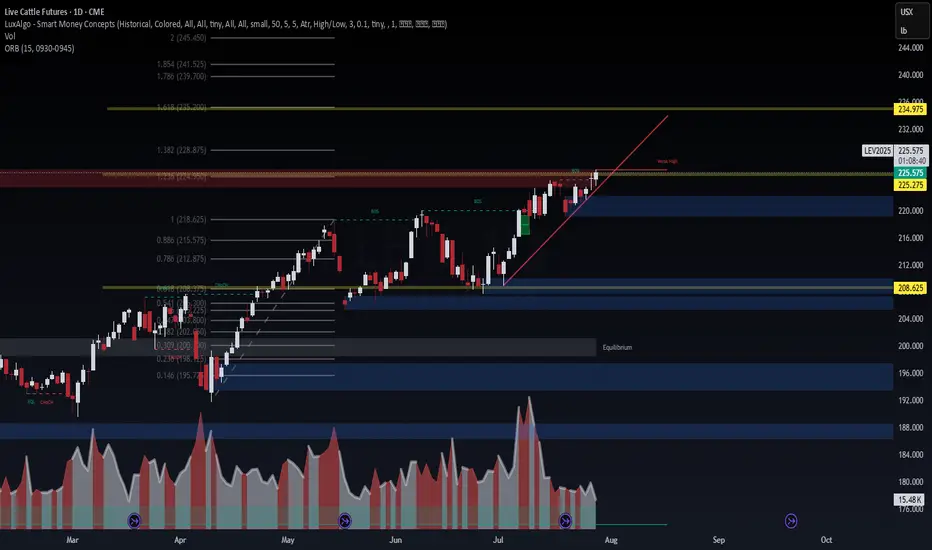
Live Cattle Futures (LEV2025) – Approaching Breakout Zone🐄 Live Cattle Futures (LEV2025) – Approaching Breakout Zone
WaverVanir DSS models show LEV2025 pushing into a key resistance band near 225.65–228.87 — the "weak high" zone where institutional sellers previously stepped in. Price remains in a clear bullish structure with clean BOS and rising demand.
🔍 Chart Structure Highlights:
📈 Trendline support holding since early June
🟨 Price sitting just below 1.382 Fib (228.87) – strong resistance
🟩 If broken, next fib extensions align at:
TP1: 234.97
TP2: 239.70
TP3: 245.45
🟦 Key downside structure support = 208.62 (CHoCH zone)
🧠 Options Flow (Aug–Dec 2025)
🟢 Call Buying: 224C, 225C, 226C, 242C – strong bullish pressure
🔴 Put Selling: 224P, 222P, 210P – income strategies defending downside
💡 Flow favors continuation higher, but many traders capping profits → suggests grind higher, not a parabolic run yet
📈 Strategy Insight
VolanX DSS bias: Bullish with caution
Break above 228.87 confirms squeeze toward 234–240 range
Failure to break = short-term fade back to 218–212 support band
🎯 Watch Levels
Breakout Confirm: Close above 229.00
Invalidation: Daily close below 218.62
Next Target Zone: 234.97 – 239.70 (1.618–1.786 extension)
#LEV2025 #LiveCattle #SMC #VolanXProtocol #CommodityFutures #OptionsFlow #FibStrategy #WaverVanir #DSS #Agriculture #MacroTrading #CMEFutures
Fundamental Analysis
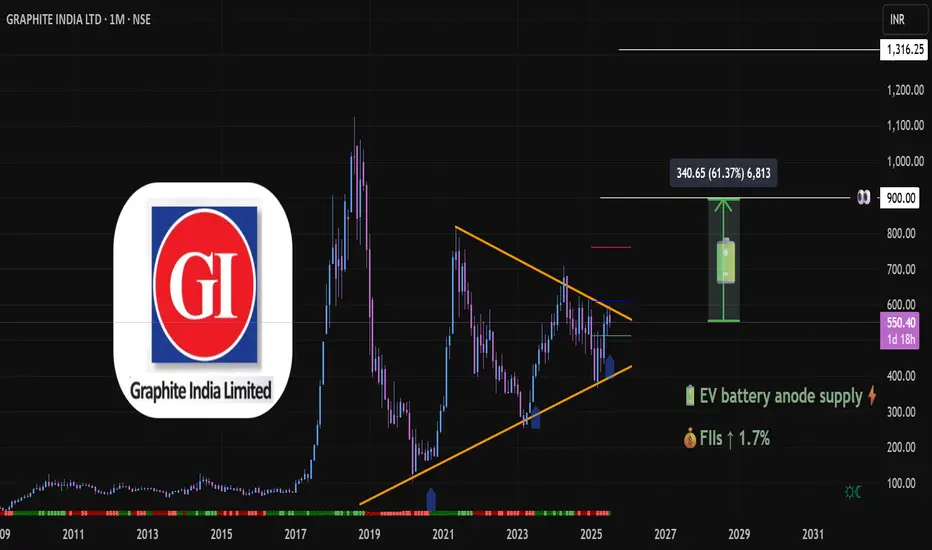
Graphite India (1M TF) - Big Technical Base ►NSE:GRAPHITE
⚙️ Materials: Commodity Cycle Turnaround
(Green energy metals, China recovery)
Sector context: India’s rising graphite demand (e.g. electrode expansion for steel, battery material on horizon) aligns well with Graphite India’s positioning.
►Graphite India is the largest producer of graphite electrodes in the country and one of the largest in the world.
At the time of charting NSE:GRAPHITE PA was at 550
PA in 1D TF has bounced from Support
Trend 1M TF: Long-term Symmetrical 📐triangle formation since 2018 highs — price now testing upper trendline
Monthly shows range‑bound to mild consolidation since topping near ₹623 and bouncing around ₹540‑560.
Multi-year consolidation forming a textbook volatility squeeze, often a precursor to explosive directional moves. Volume compression inside the triangle suggests strong hands accumulating.
Candlestick structure: Bullish engulfing-type recovery candle forming off the trendline support. Breakout Energy above 586 = potential energy. A monthly close👀 above the downtrend line may unlock significant upside ⇗ momentum.
Daily MACD turning positive, weekly and monthly crossovers 🟢suggest building momentum.
Monthly Resistance line 762🔴 Pivot line 🔵611 Support🟢512
₹575–586 is the breakout threshold. Above the pivot and away ⇗
Post-break, next projection target : ₹900 (≈+60%), followed by ₹1,300. (Text Book)
📊 Fundamental Alignment
🔋 EV Battery Anode Narrative: Global lithium/graphite demand surging → Graphite India well-positioned as key electrode supplier.
🌍 China Supply Risks = India graphite players gain global relevance.
💼 FIIs Inflow: Recent uptick (+1.7%) hints at sectoral re-rating in anticipation of capex cycles and commodity upturn.
📉 Valuation Context: After steep de-rating post-2018, current price offers favorable risk-reward compared to earnings expectations and sector re-alignment.
► Graphite electrodes are the main heating element used in an electric arc furnace
extremely high levels of heat generated in EAF.
Graphite electrodes are divided into 4 Types: RP Graphite electrodes, HP Graphite electrodes, SHP Graphite electrodes, UHP Graphite electrodes.
► Needle coke👀 is a key ingredient in the production of graphite electrodes for electric arc furnaces (EAFs) in the steel industry.
🧰 Strategic Outlook
►we'll follow this trade closely and within incoming week we'll up a close up view of 4h TF
Bias: Strongly Bullish on breakout; Neutral if it stalls below ₹550.
Targets: ₹900 (swing), ₹1,300 (positional)
ideal for swing/long-term portfolio adds
Alternate Case: Breakdown below🔻₹480 negates pattern; re-evaluate around ₹400 for demand re-entry.
Always DYOR
See you on the other side
💡 Reflective Close:
“What if true breakouts don’t come from hype — but from time, patience, and the quiet work of smart money preparing long before headlines catch up? Are you watching the price, or are you watching the behavior behind the price?”
Why Are Markets Rising Despite the Tariffs?Because of the
1) Set timeline on finalizing the tariff rates and
2) The ongoing negotiations,
They aimed at striking a balanced deal between the U.S. and its trading partners.
The Liberation Day tariffs were announced on 2nd April, and markets initially crashed in response. However, just seven days later, on 9th April, the U.S. postponed the higher tariff increases for most countries by 90 days. Since then, markets have rebounded and even broken above their all-time highs set in December last year.
Now that the dust is settling with the expiration of timeline and ongoing negotiations, the big question is:
Where will the markets head next?
Mirco Nasdaq Futures and Options
Ticker: MNQ
Minimum fluctuation:
0.25 index points = $0.50
Disclaimer:
• What presented here is not a recommendation, please consult your licensed broker.
• Our mission is to create lateral thinking skills for every investor and trader, knowing when to take a calculated risk with market uncertainty and a bolder risk when opportunity arises.
CME Real-time Market Data help identify trading set-ups in real-time and express my market views. If you have futures in your trading portfolio, you can check out on CME Group data plans available that suit your trading needs www.tradingview.com

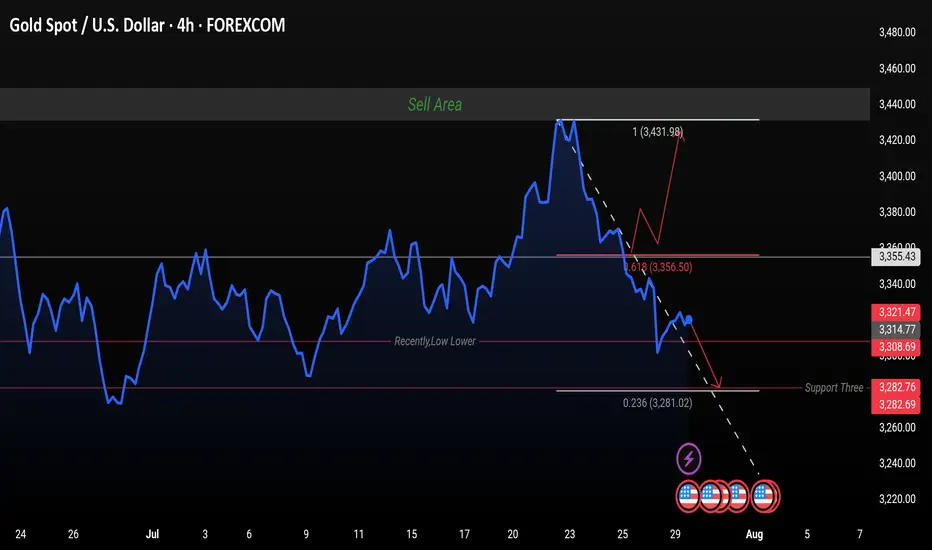
H4 Analysis. It's sell or buy let's see?
Gold is currently trading near 3323 after a recent sharp drop from the 3431 high. The price is respecting the downtrend line and has tested the 0.236 Fibonacci retracement at 3281 as support.
📉 Bearish Outlook:
If the price fails to break above 3314–3325, we could see a continuation toward the 3282 and possibly 3281 support zone.
📈 Bullish Scenario:
A break and close above 3355 (Fib 0.618) could push the market toward the 3431 resistance zone (Sell Area).
Key Levels to Watch:
Resistance: 3355 / 3431
Support: 3314 / 3308 / 3282
#XAGUSD: A Strong Bullish Move, Possible Target at $45?Silver is currently experiencing a correction, but the overall price remains bullish. Analysing the data, we can see a potential price reversal in our area of interest. Following the recent higher high, price is poised to create another record high. We should closely monitor volume and price behaviour. A strong volume signal would indicate a potential bullish move in the future.
Good luck and trade safely.
Like and comment for more!
Team Setupsfx_

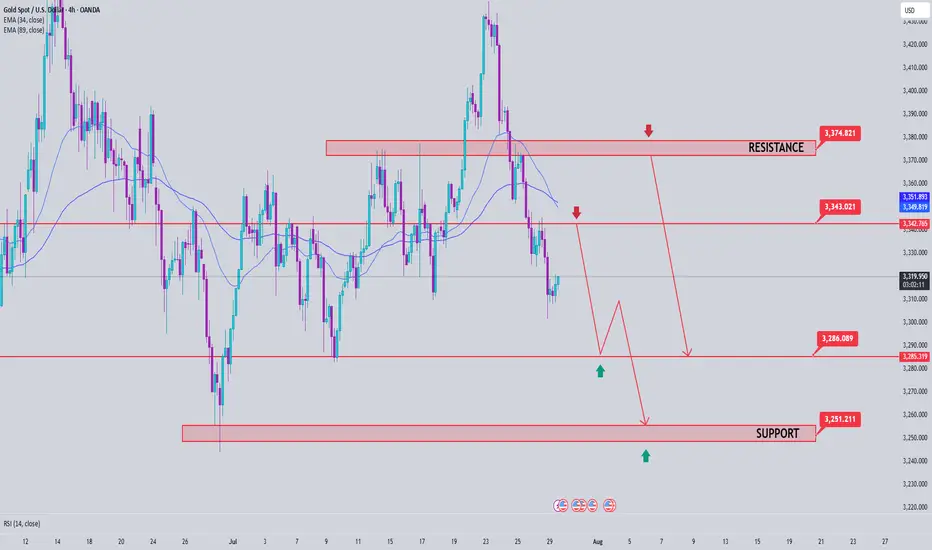
Gold Price Analysis July 29📉 XAUUSD ANALYSIS – IS THE CORRECTION OFFICIALLY STARTING?
Gold has officially broken out of the bullish wave structure and left the rising price channel – an important technical signal that the bearish correction trend has been activated. This development opens up the possibility of retests of the broken trendline, and if that happens in today's session, this could be a good opportunity to look for SELL entry points in the new trend.
📌 Short-term trading strategy:
Potential selling zone: 3343 – 3345
Downside target: 3283 first, followed by the strong liquidity zone around 3250
Confirmation of bearish force: Price continues to maintain below the 3375 area – which will act as an important resistance level. Only when the daily candle closes back above this zone will the uptrend be re-established.
✅ Reverse buying strategy if there is a strong support signal:
Buy trigger zone: Observe the price reaction around the 3285 area - there needs to be a clear bearish rejection signal (pin bar/bullish engulfing candle...)
Deeper buying zone: 3251 - where liquidity is concentrated and there is a possibility of bottom-fishing demand appearing.
Olin Corporation | OLIN | Long at $21.81Olin Corp NYSE:OLN is currently trading within my "crash" simple moving average area (green lines on the chart). Historically, the price trades within this area for the company, consolidates, and then moves up. After today's earnings, which were relatively positive, the stock may gain some traction and move up. However, I am cautious a media-heightened economic downturn could send NYSE:OLN (a global manufacturer of chemical products and ammunition) to $13 to close the existing price gaps on the daily chart. Regardless, it's a strong company that has been trading on the US stock exchange since the mid-1970s - it's seen rough times before. While 2025 is likely to be a tough year, future earnings projections predict robust earnings growth. Time will tell...
Thus, at $21.81, NYSE:OLN is in a personal buy-zone with noted caution if there is an economic downturn down to $13 a share. The price gap around $19 may also be closed in the near-term.
Targets into 2028:
$28.00 (+28.4%)
$31.50 (+44.4%)

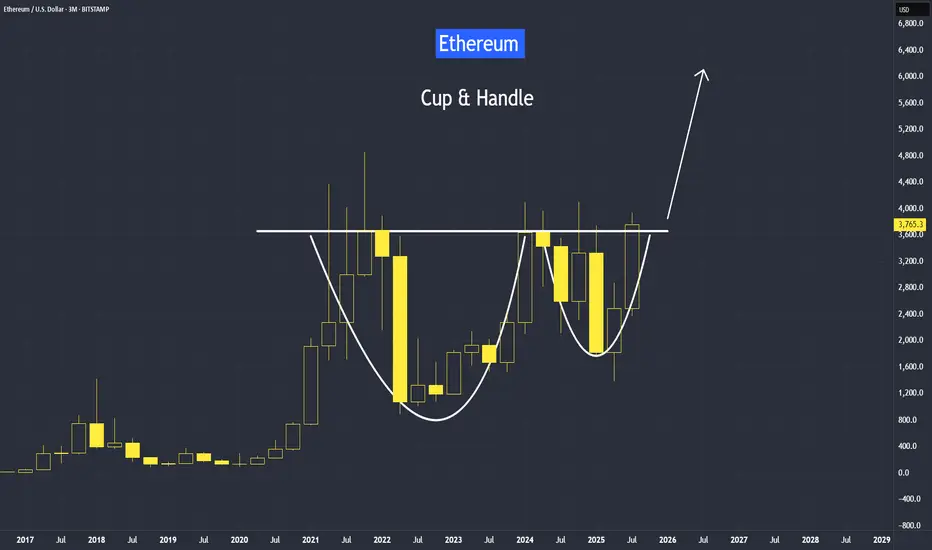
Cup and Handle Setup in Ethereum Since April trough, Ethereum has risen by 179%, delivering a higher rate of return than Bitcoin at 66%.
But most of our attention is on Bitcoin, breaking above the 120,000 level.
Why is Ethereum quietly gaining ground —and what does the future hold for Ethereum?
It's video version on its trading strategies:
Mirco Bitcoin Futures and Options
Ticker: MET
Minimum fluctuation:
$0.50 per ether = $0.05 per contract
Disclaimer:
• What presented here is not a recommendation, please consult your licensed broker.
• Our mission is to create lateral thinking skills for every investor and trader, knowing when to take a calculated risk with market uncertainty and a bolder risk when opportunity arises.
CME Real-time Market Data help identify trading set-ups in real-time and express my market views. If you have futures in your trading portfolio, you can check out on CME Group data plans available that suit your trading needs www.tradingview.com

7/29/25 - $sbet - What r u guys doing...?7/29/25 :: VROCKSTAR :: NASDAQ:SBET
What r u guys doing...?
- feels like i'm always in early, out early
- but here we are, buying AMEX:BMNR in the 30s post market, halving that in the run this AM... adding it back
- you all realize that NASDAQ:SBET 's mnav is pretty close to 1 right?
- i just don't get it, perhaps it's all these call options, negative gamma
- "yes" eth is expensive, could pullback got it
- but as a treasury vehicle, esp of this size, you'll likely see 2...3...4x mnav at end of cycle as borrow are in MSD rates and yield here ("ROE") in bank terms based on underlying CAGR is minimally DDs... but realistically in the 20s...30s...40s... e.g. justifying this 2+ x mnav
- so you do you
- but i'm back and buying all the way back to $15 and below where in my estimation you'd be buying eth at a discount? lol
V

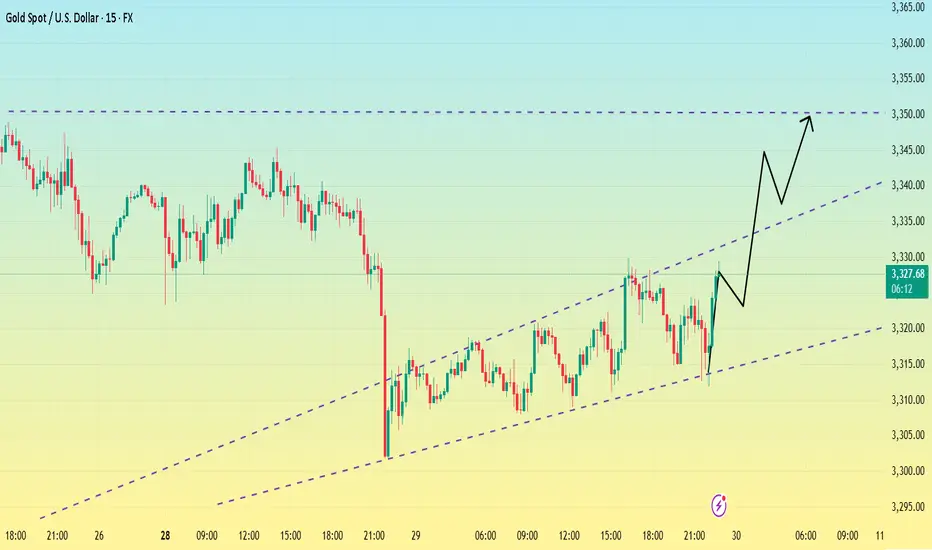
Bottoming out? Be wary of the market.After a sharp drop to around 3300 on Monday, gold rebounded, reaching a high of around 3330 so far.
From the 1-hour chart,Gold has now broken out and stabilized within the hourly chart's downward trend channel. The key upward level is currently around 3330. If it breaks above 3330 again, caution is advised; it may test 3345-3350. Conversely, if it fails to break above 3330, gold may consolidate between 3300-3330 before the non-farm payrolls release.
From a short-term 15-minute perspective, the current 15-minute range has been broken out and stabilized. The current situation is unfavorable for bears. Based on the trend, a breakout above the 15-minute range would indicate a rebound. However, until 3330 holds, the 3320-3330 range is the only option. However, the current trend favors a bullish pullback, so I'm not too keen on shorting. Therefore, focus on support at 3320.
If it fails to break below 3320, enter a long position near 3320. The upper target is the top of the 3345-3350 range.
Bitcoin Weekly Recap & Gameplan | 27.07.2025📈 Market Context:
Bitcoin maintained its bullish momentum, driven by continued institutional demand and a supportive U.S. policy backdrop.
Last week’s gameplan played out well — solid profits were captured (see linked chart below).
🧾 Weekly Recap:
• Price made a bullish retracement into the Weekly FVG (purple line) exactly as projected in last week's post.
• From here, I expect continuation toward new all-time highs.
📌 Technical Outlook:
→ First, I expect a short retracement and a 4H swing liquidity grab at 117,828$.
→ Then, a strong continuation move toward ATH targets.
🎯 Setup Trigger:
Watch for:
✅ 4H liquidity sweep
✅ 15M–30M bullish break of structure (BOS)
This is the confirmation zone for potential long setups.
📋 Trade Management:
• Stoploss: Below confirmation swing low
• Targets:
– 120,938$
– 123,400$
💬 Like, follow, and drop a comment if this outlook helped — and stay tuned for more setups each week!

07-29-2025 BUY PCG PCG earnings in 2 days before the market open. Analysts expect EPS of $0.32
BUY $14.01
SELL $14.33
ASK $0.32
2%

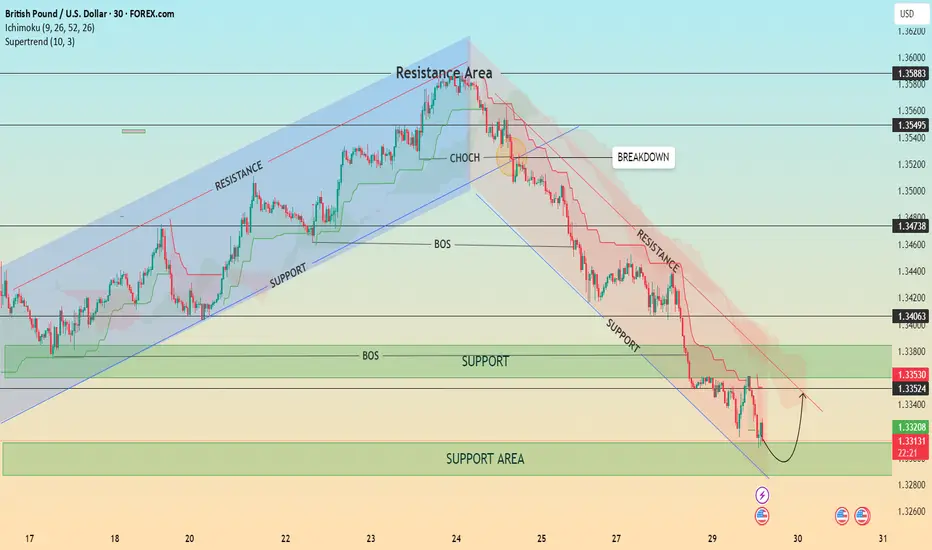
GBP/USD – Bearish Structure with Possible Short-Term Pullback📊 GBP/USD – Bearish Structure with Possible Short-Term Pullback
Timeframe: 30-Minute | Date: July 29, 2025
Price action recently broke down from a well-respected ascending channel, confirming a shift in market structure with a Change of Character (CHOCH) followed by a Break of Structure (BOS). Since then, GBP/USD has been respecting a descending trend channel, forming consistent lower highs and lower lows.
🔍 Current Setup:
Price is testing a major support area around 1.3300–1.3320.
A minor pullback is expected as indicated by the bullish wick rejections.
However, the overall bias remains bearish unless we break and hold above the 1.3353–1.3406 resistance zone and the descending trendline.
The Ichimoku Cloud and Supertrend both show bearish momentum.
📈 Potential Scenario:
Price may bounce from the support area and retest the upper boundary of the descending channel before resuming the bearish trend.
⚠️ Key Levels to Watch:
Resistance: 1.33530 / 1.34063 / 1.34738
Support: 1.33200 / 1.33000
💡 Structure Notes:
CHOCH = Trend Reversal Signal
BOS = Confirmation of Downtrend
Cloud = Dynamic Resistance
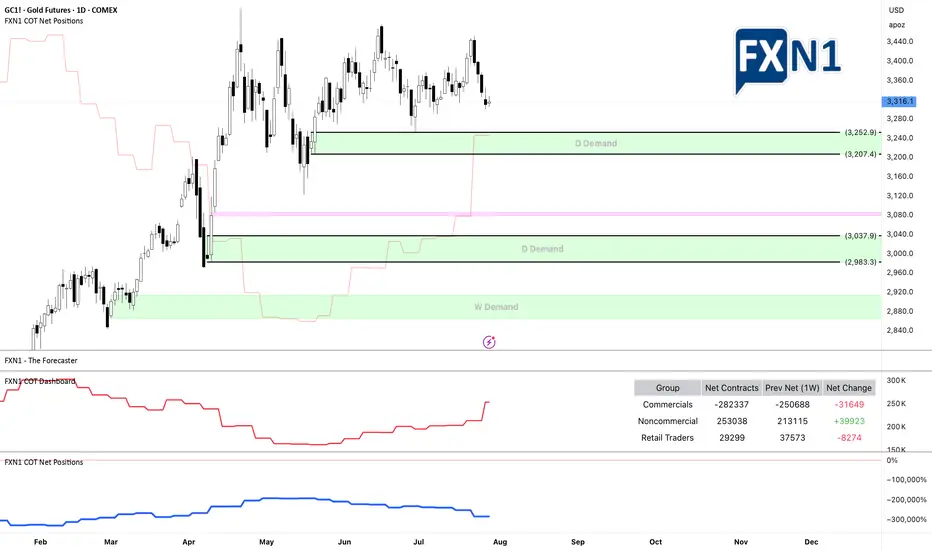
Gold Price Analysis (GC1! or XAU/USD): Challenges and OutlookSince reaching a historic high of $3,509 on April 22, 2025, gold has struggled to maintain its upward momentum. On the daily timeframe, the price experienced a sharp rejection spike after touching that peak, prompting a sideways range as the market seeks a clearer direction.
From a technical perspective, a stronger US dollar typically puts downward pressure on gold, making it a more expensive investment for holders. However, examining the chart of GC1! * alongside the DXY shows that even during periods of a robust dollar, gold has continued to rise. Additionally, recent years have seen seasonality effects on gold largely ignored, with the yellow metal persistently climbing. The underlying reasons are multifaceted, but a key factor is gold’s status as a safe-haven asset—investors prefer to hold gold during times of uncertainty and economic turmoil.
* GOLD and DXY correlation
Looking ahead, investors are awaiting the Federal Reserve’s upcoming monetary policy announcement scheduled for Wednesday. According to the CME FedWatch tool, the consensus is that the Fed will keep interest rates steady at 4.25%-4.50%, marking the fifth consecutive meeting with unchanged rates.
From both fundamental and technical viewpoints, recent data suggest a cautious outlook. Notably, non-commercial traders added nearly 40,000 long contracts last week, indicating bullish sentiment. Conversely, retail traders have reduced their positions, which could signal a potential shift in market dynamics.
The key question remains: where might be a strategic entry point if gold resumes its upward trend?
In the chart, I’ve highlighted two daily demand zones and a strong weekly demand area. There’s a possibility that the price may not revisit the weekly demand zone to accommodate new longs, instead triggering entry signals from one of the daily demand zones. I recommend adding these zones to your watchlist as potential entry points.
What are your thoughts? I look forward to your insights!
✅ Please share your thoughts about GC1! in the comments section below and HIT LIKE if you appreciate my analysis. Don't forget to FOLLOW ME; you will help us a lot with this small contribution.
Sells for the week
***Confluences-(Waiting for the restest)***
Head and Shoulders Broken at Higher Time Frame
Weekly, Daily, 4Hr all bearish
Broke a Key Weekly Level at 1.43000

USDJPY long position 29/07/2025English : According to our analysis, we anticipate a bearish scenario.
Morocan Darija : kanchofo d'apres l'analyse dyalna antsanaw hboot
ATENTION : I only share my ideas, not signals
if TP1 hit i will move SL to BE

ETH: Will Price Continue Upwards Movement! ETH has been steadily bullish in recent times, as the crypto market experienced a significant increased a safer option to invest around the global investment community. DXY and other major currencies currently experiencing a major drawdown in prices which indirectly helping the crypto market to remain bullish. While looking at how eth has performed in recent past, we can see it creating a record high in coming weeks.
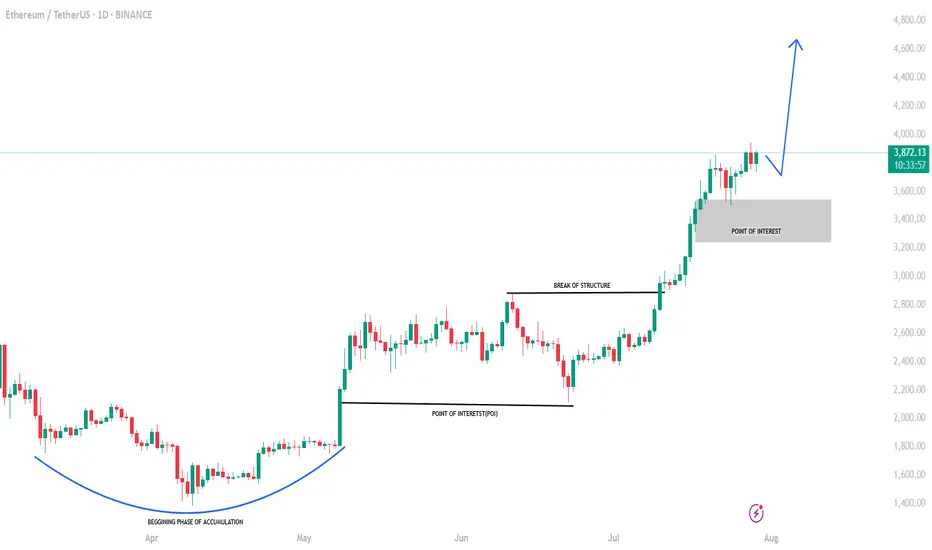
Ethereum Price to Reach $4,000, but Market Top Suggests DelayBINANCE:ETHUSDT current price stands at $3,872, holding above its local support level of $3,742. While ETH is approaching the $4,000 mark , it has not yet managed to breach it. This resistance could continue to hold, limiting Ethereum's immediate potential for further gains.
Currently, 96% of BINANCE:ETHUSDT total supply is in profit. Historically, when the profitable supply surpasses 95%, it signals a market top . This has been followed by price corrections as investors begin to secure profits.
If the market top triggers a reversal, BINANCE:ETHUSDT price could drop to $3,530 or lower . A sharp decline to $3,131 is also a possibility, erasing much of the recent gains made in the past month.
On the other hand, if the influx of new addresses continues and strengthens, BINANCE:ETHUSDT may finally break through the $4,000 resistance. Should this happen, ETH could rise towards $4,425, with a renewed surge in price. This would invalidate the bearish thesis and push Ethereum into a new bullish phase.

Tuesday 29 July: Forex Market thoughts The EUR has begun the week under pressure following the US / EUR trade deal.
EUR weakness could be out down to what they call 'sell the fact', meaning buy last week's deal rumours / sell (take profit) on the announcement. Or, more likely, it could be because it appears the US has the better side of the deal. Either way, all of lat week's EUR positivity has dissipated.
I didn't get involved in a EUR short trade yesterday, but there is a case to say it was viable.
The USD and JPY begin the week on the front foot. Possibly benefitting from 'EUR liquidity', or possibly due to 'positioning' ahead of this week's FOMC and BOJ meetings.
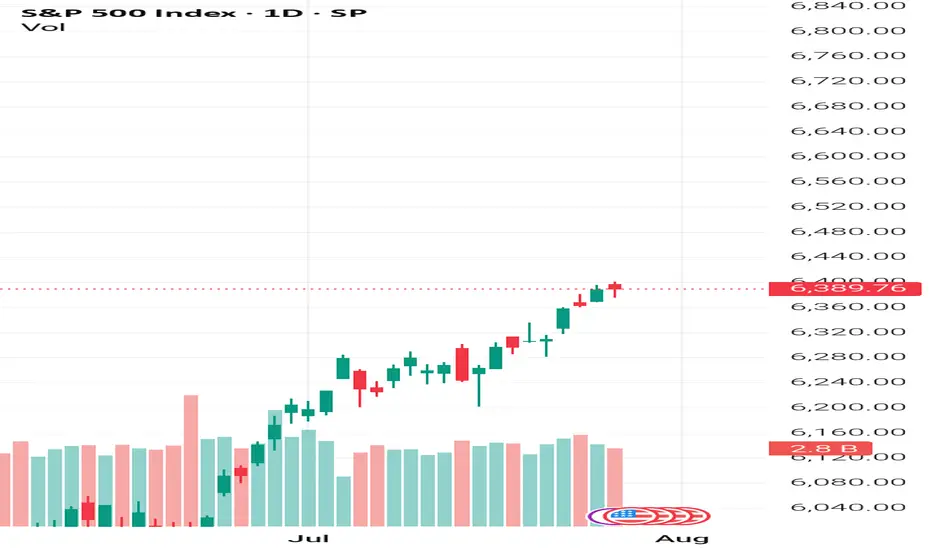
As things stand, with the VIX below 15 and the S&P still riding high, I maintain my view that according to market fundamentals, 'risk on' trades 'should' be viable. Which means staying patient and waiting for a turnaround, particularly on the JPY charts.
If that turnaround doesn't come, I could be forced to change my view.
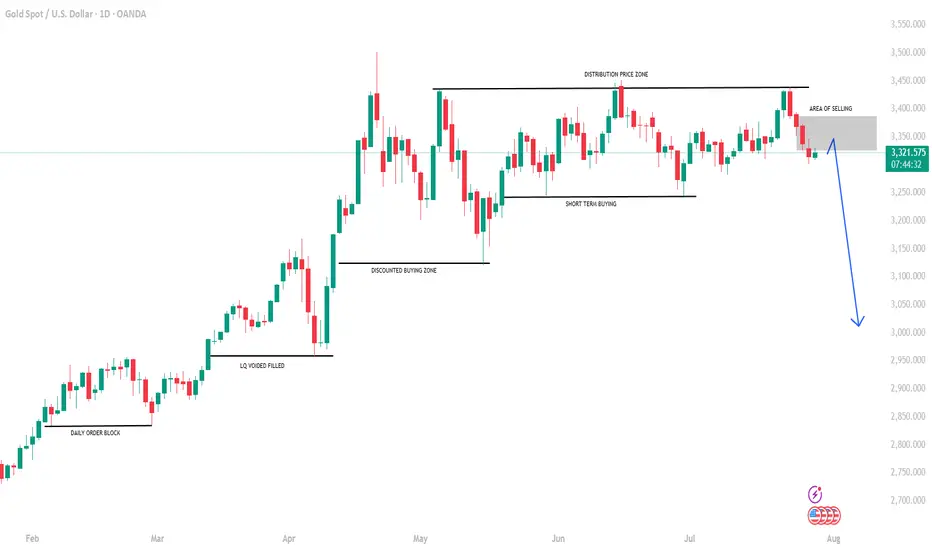
GOLD: Time for massive drop? +3000 pips move! Gold has failed to breakthrough the previous resistance indicating a strong sellers hold around $3440 region. Now since the price has stared dropping we can see it dropping around $2800 in long term. In order for this to happen we need strong confirmation, which will help us understand the possible volume.
Agree with our idea?
Like and comment!
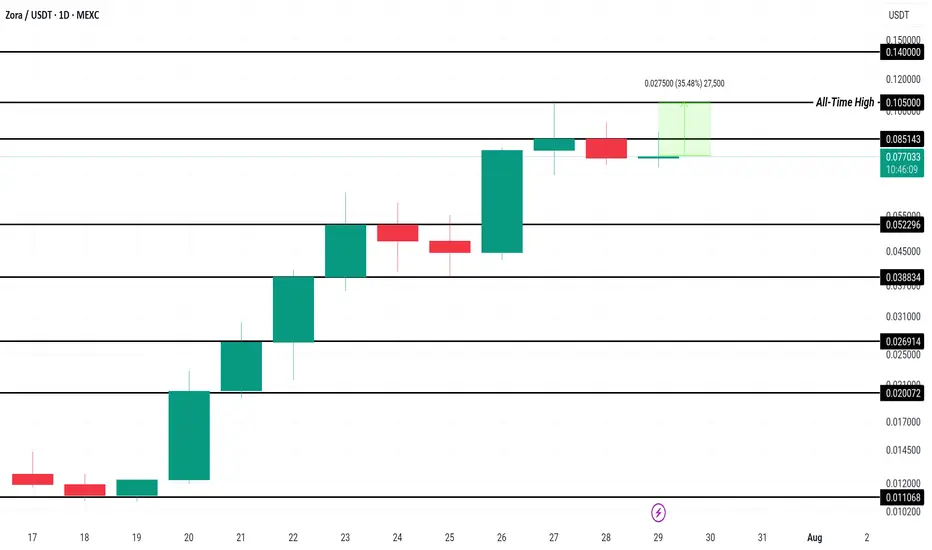
Zora Price Stands 35% From ATH; Can It Make It This Week?MEXC:ZORAUSDT has been rallying for the past ten days, recently reaching a new all-time high (ATH) of $0.105. Currently, Zora is trading at $0.775 , just below the resistance of $0.085. This recent rally has sparked optimism among investors, positioning Zora for potential further gains.
Given the altcoin’s 7% increase today, there’s a high probability that $ MEXC:ZORAUSDT will surpass its ATH of $0.105 , potentially reaching new highs beyond $0.140 this week . The strong momentum indicates that the bullish trend could continue if the current market conditions hold.
However, if investor sentiment shifts and selling pressure intensifies, MEXC:ZORAUSDT price could dip below $0.052 . A significant drop through this support level would invalidate the current bullish outlook and could signal a longer-term decline in the coin’s value.
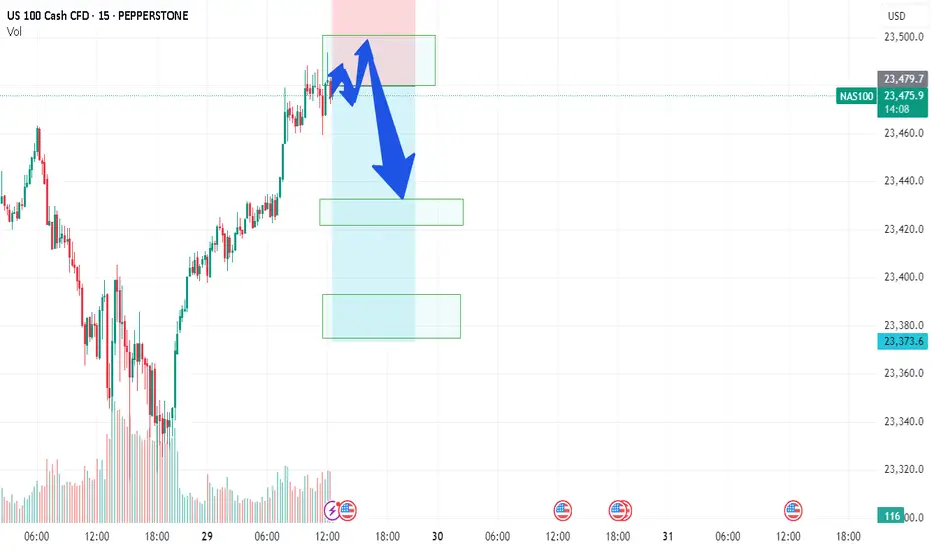
NAS/TEC100 - LETS GET NASTY ON NAS100Team, NAS currently sitting at 23480, before the US market open
however during the market open, please be aware of the volatility that may hit your stop loss
You have 2 options to trade on this NAS- NASTY
Option 1: wait for market open, if it hits 23500-23515 - then short with stop loss at 23580
Option 2: Short at the current market with small volume - and if the market open with volatile, you can take another advantage of shorting more volume as per option 1 instructed.
OK, pick your strategy! do NOT be shy.
I am going to have small short position and will consider adding more during US market opening after 5-10 minutes, much easier to see the direction of the market - we do LIVE trading everyday. Please note: if NAS fall below 23450-40 bring stop loss to BE (Break even)
1st TARGET range: 23435-23416 - make sure take 70% volume
2nd target at 23390 to 23376
Why do I short on NAS when tomorrow rate decision, i think this quarter report, market will not be the same as last quarter, even rate cut!