BTCUSD trading signal. False break of bottom line✏️ CRYPTO:BTCUSD just False Break the lower band and is establishing a bullish wave structure in the H4 time frame. 119700 will be the top of wave 1 if the current bullish wave exceeds the top it will form a bullish DOW pattern heading towards a new ATH.
📉 Key Levels
BUY Now BTCUSD: Confirmation of candle when retesting Fibonacci 0.5
Target 127000
Leave your comments on the idea. I am happy to read your views.
Fundamental Analysis

GOLD Analysis : XAUUSD Major Bullish Demand Zone🧠 Market Structure Context (MMC Framework)
Gold has recently shown a clean structural decline from its local highs within a well-defined ascending channel. This analysis highlights a reaction zone-based playbook, focusing on high-probability reversal scenarios guided by institutional footprints, volume reaction points, and MMC logic.
We’re currently trading near a previous reversal zone, where history tells us the market tends to shift behavior. Let’s dissect the key components.
📊 Key Technical Components
🔸 1. Ascending Channel Breakdown
The entire uptrend was respecting a well-established bullish channel until the recent drop violated the midline structure. This breakdown confirms a temporary bearish phase, with price breaking cleanly below a QFL base (Quick Flip Level)—a level where price reversed sharply before, which now acts as a major supply zone.
Psychological Insight: Channels give clues about momentum. Breaking below the lower band shows the market is preparing for a retest or a deeper liquidity hunt.
QFL Breakdown: Once broken, previous buyer confidence is shaken—inviting sellers to test demand zones.
🔸 2. Previous Reversal Zone (PRZ) Reaction
Currently, price is hovering inside the blue shaded Previous Reversal Zone, where bullish pressure previously kicked in. It’s a minor demand zone, but critical due to historical reaction. The projected structure shows a bounce from this area before deciding next direction.
MMC Insight: The first test of PRZ often leads to an initial reaction. But deeper liquidity lies just below in the major green demand zone.
🔸 3. Major Demand Zone + Volume Burst Area (The Real Magnet)
Below the PRZ lies the major reversal block—highlighted in green. This zone is significant because:
It aligns with a high-volume burst in the past, confirming institutional orders.
It's a cleaner structure level for smart money re-entry.
It also provides room for the “liquidity sweep” (stop hunt), collecting sell stops before a proper reversal.
💡 Expected Play: Price may fake out below PRZ, enter the major demand, and then initiate a multiple-leg bullish rally. Patience is key here.
🛠️ Trade Structure Outlook
✅ Scenario 1 – Aggressive Buyers (Marked "1"):
Buy from the current PRZ zone around $3,305–$3,315
Target: $3,340 (Minor Resistance)
Risk: Slippage into deeper demand zone
Stop-loss: Below $3,295
✅ Scenario 2 – Safer Entry from Major Demand (Marked "2"):
Let price dip into $3,270–$3,280 zone (green box)
Look for reversal candles or liquidity sweeps on lower timeframes
TP1: $3,330
TP2: $3,365 (Major Resistance)
📈 Resistance Levels to Watch:
Minor Resistance: $3,340 – Expect short-term pullbacks or hesitation.
Major Resistance: $3,365 – Key target for swing traders and potential reversal zone.
🔍 MMC Concepts in Action
✅ Channel Logic: Breakdown implies momentum shift—watch for retests.
✅ QFL: Previous bounce zone broken = supply now overhead.
✅ Volume Burst Zone: Strong historical reaction = institutional interest.
✅ Zone-to-Zone Trading: Instead of random entries, focus on logical zone interactions.
🧭 Conclusion – Path of Probability
Gold is currently in a transitional phase—shifting from bearish correction to potential bullish revival. Patience will reward those who wait for PRZ rejections or deeper liquidity taps. The MMC framework helps frame this market not as chaos, but a map of strategic reaction points.

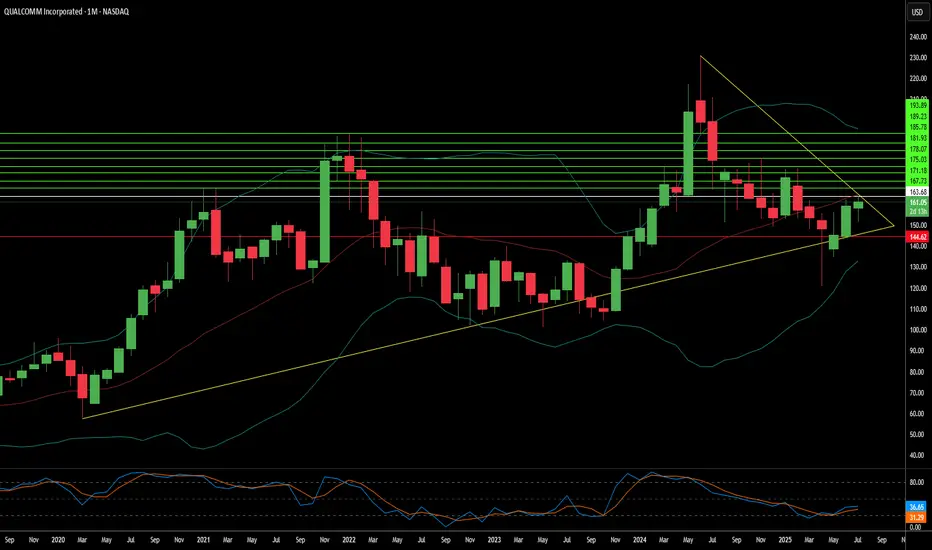
Qualcomm: Beyond the Smartphone Storm?Qualcomm (NASDAQ:QCOM) navigates a dynamic landscape, demonstrating resilience despite smartphone market headwinds and geopolitical complexities. Bernstein SocGen Group recently reaffirmed its "Outperform" rating, setting a \$185.00 price target. This confidence stems from Qualcomm's robust financials, including a 16% revenue growth over the last year and strong liquidity. While concerns persist regarding potential Section 232 tariffs and Apple's diminishing contribution, the company's strategic diversification into high-growth "adjacency" markets like automotive and IoT promises significant value. Qualcomm currently trades at a substantial discount compared to the S&P 500 and the Philadelphia Semiconductor Index (SOX), signaling an attractive entry point for discerning investors.
Qualcomm's technological prowess underpins its long-term growth narrative, extending far beyond its core wireless chipmaking. The company aggressively pushes **on-device AI**, leveraging its Qualcomm AI Engine to enable power-efficient, private, and low-latency AI applications across various devices. Its Snapdragon platforms power advanced features in smartphones, PCs, and the burgeoning **automotive sector** with the Snapdragon Digital Chassis. Further expanding its reach, Qualcomm's recent acquisition of Alphawave IP Group PLC targets the data center market, enhancing its AI capabilities and high-speed connectivity solutions. These strategic moves position Qualcomm at the forefront of the **high-tech revolution**, capitalizing on the pervasive demand for intelligent and connected experiences.
The company's extensive **patent portfolio**, encompassing over 160,000 patents, forms a critical competitive moat. Qualcomm's lucrative Standard Essential Patent (SEP) licensing program generates substantial revenue and solidifies its influence across global wireless standards, from 3G to 5G and beyond. This intellectual property leadership, combined with a calculated pivot away from its historical reliance on a single major customer like Apple, empowers Qualcomm to pursue new revenue streams. By aiming for a 50/50 split between mobile and non-mobile revenues by 2029, Qualcomm strategically mitigates market risks and secures its position as a diversified technology powerhouse. This assertive expansion, alongside its commitment to dividends, underscores a confident long-term outlook for the semiconductor giant.
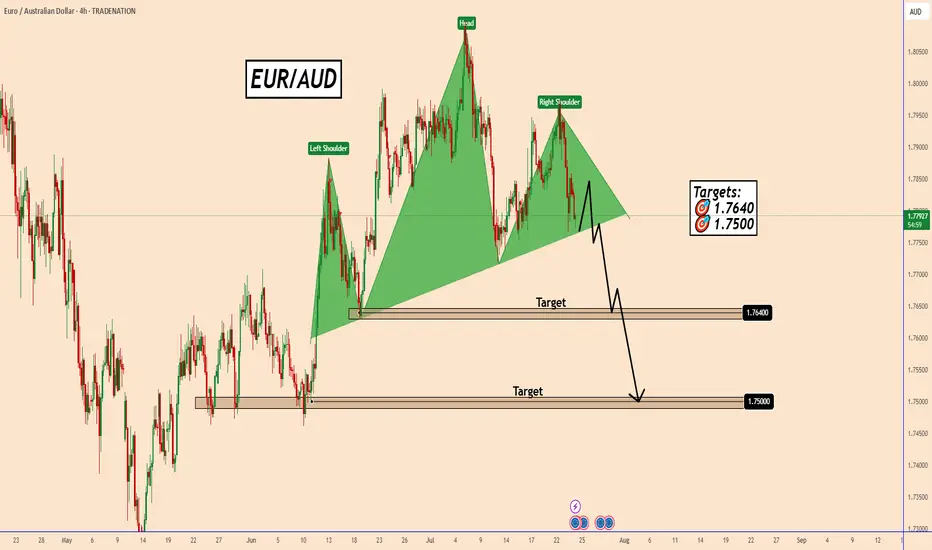
EURAUD is poised to confirm a bearish Head & Shoulders pattern.EURAUD is poised to confirm a bearish Head & Shoulders pattern.
The price could move higher today on hopes that the ECB can share some positive news on the economy and interest rates.
The European Central Bank is expected to keep interest rates unchanged, ending a seven-year streak of cuts.
If the price manages to break below the neckline of the pattern, it will open the door for further declines.
The first support zone will be found near 1.7640 and the second near 1.7500.
You may find more details in the chart!
Thank you and Good Luck!
PS: Please support with a like or comment if you find this analysis useful for your trading day
Disclosure: I am part of Trade Nation's Influencer program and receive a monthly fee for using their TradingView charts in my analysis.
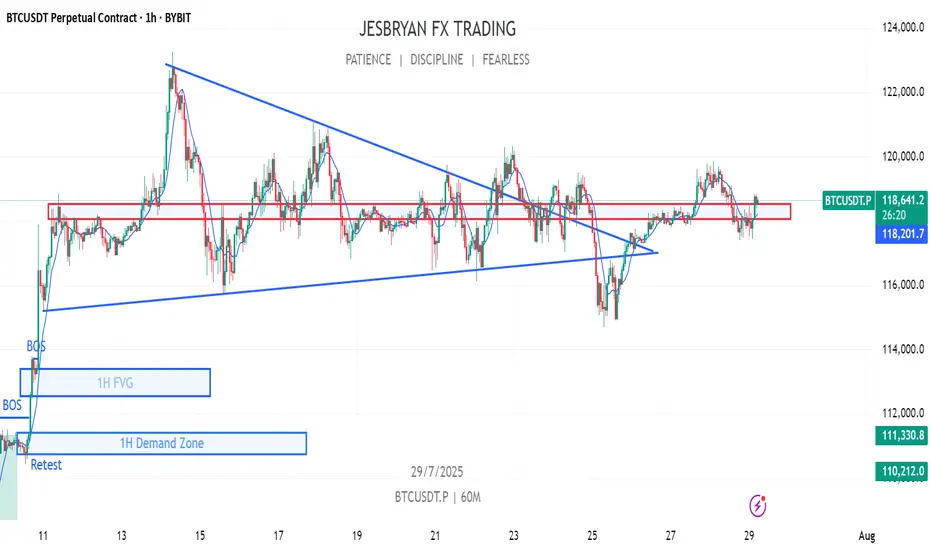
BTCUSD Analysis (MMC) – Breakout Confirmed + Target Next Zone⚙️ Chart Context (4H BTC/USD)
As part of our Mirror Market Concepts (MMC) strategy, today's BTCUSD 4H chart is a textbook representation of market structure shift, SR interchange, demand reaction, and target projection. After consolidating within a compressed range under a key descending structure, Bitcoin has successfully broken out of bearish control, signaling a fresh phase of bullish momentum.
🧩 Breakdown of Technical Structure
🔹 1. Demand Zone Reaction (July 13–14)
The initial impulse move originated from a well-defined demand zone, marked by a strong accumulation and breakout. This zone—highlighted on the chart—acted as the institutional demand base, where buyers stepped in with volume and aggression. Price respected this zone precisely, confirming it as a valid MMC "Power Base."
Why this matters: Demand zones like these reflect institutional footprints. Once price reacts from such zones, they often become foundational for future bullish legs.
🔹 2. SR Interchange Zone – Structure Flip Confirmed
The descending green channel acted as dynamic resistance for several sessions. Every touch along this zone resulted in a lower high, confirming bearish order flow. However, BTC has now closed decisively above this structure, transforming this zone from supply to support—this is our classic SR Interchange concept in MMC.
Interpretation: This structure flip implies a strong change in sentiment. What was once a zone of rejection now becomes a potential support for continuation.
Expect retests of this zone before price resumes to higher reversal levels.
🔹 3. Minor and Major Resistance Zones
Above current price, two critical zones have been mapped:
Minor Resistance (~$120,000):
Acts as the first liquidity grab area. This is where early sellers may place stops or where short-term traders could book profits. MMC logic expects minor resistance to either cause a pause or a fakeout to lure in shorts.
Major Resistance / Central Reversal Zone (CRZ):
Spanning roughly $121,000 to $121,800, this is a key zone where price will likely meet decision-making. This CRZ is derived from previous structure congestion, imbalance fills, and projected Fibonacci confluence.
Next Reversal Zone (Final Target Area):
Located near $123,000, this is the outer reversal box where the bullish wave may either end, consolidate, or reverse entirely. This is the final target for swing traders or MMC practitioners looking for exhaustion.
🧭 Price Forecast Structure – Predictive Pathway
The forecast path shown on the chart illustrates a stair-step rally, with bullish impulses followed by shallow pullbacks:
First, price may pull back slightly to retest the breakout zone (green SR area).
Then a leg upward to minor resistance (~$120K).
A healthy rejection or small correction before breaking into the CRZ (~$121.2K).
Final move toward the outer reversal zone at ~$123K.
This fractal progression is a common MMC pattern seen during structure shifts—not impulsive straight-line rallies, but controlled, zone-to-zone movements.
🔍 Strategic Insights & Trade Plan
📌 Conservative Entry:
Wait for a retest of the breakout zone (SR Interchange) around $118,200–$118,500.
Look for bullish rejection candles or order flow confirmation on LTF (lower timeframes).
📌 Aggressive Entry:
Break and close above $120,000, confirming liquidity clearance and path toward CRZ.
🎯 Target Zones:
TP1: $121,200 – Central Reversal Zone
TP2: $123,000 – Outer Reversal Zone
❌ Stop-Loss Ideas:
Below $117,000 (structure invalidation)
Below recent bullish impulse candle low
🧠 MMC Concepts in Action:
SR Flip: Strong indication of market shift
Demand Rejection: Institutional footprint detected
Zone Mapping: Controlled zone-to-zone movement
Liquidity Logic: Price moves where orders rest – CRZ = likely reaction
Reversal Framing: Structure analysis ahead of time, not after the move
📊 Conclusion:
This BTCUSD 4H analysis showcases a strong MMC-style breakout scenario. The reaction from demand, shift in SR structure, and projected reversal zones give us a clean roadmap. As long as the structure remains valid and price respects the new SR zone, this bullish move remains high-probability.
Trade with structure. Trust the zones. Mirror the Market.

Risk Management in Options TradingTrading options can be exciting and rewarding—but it's also full of risks. Without proper risk management, even the best strategies can lead to heavy losses. In this comprehensive guide, we'll dive deep into how to manage risk in options trading, covering everything from the basics to advanced techniques.
1. Understanding Risk in Options Trading
Before we dive into managing risk, it’s crucial to understand where risk comes from in options trading. Options are complex instruments that behave differently than stocks. The key sources of risk include:
A. Price Movement (Delta Risk)
When the price of the underlying stock moves up or down, the value of the option changes. This is known as Delta risk. A call option gains value when the stock goes up, and a put gains value when it goes down.
B. Time Decay (Theta Risk)
Options lose value over time. Even if the stock price doesn’t move, the option could still lose value as the expiration date approaches. This is known as Theta decay or time decay.
C. Volatility (Vega Risk)
Volatility reflects how much a stock moves. High volatility increases an option's premium. But if implied volatility falls, the value of your option might drop—even if your price prediction is correct.
D. Interest Rates and Dividends (Rho and Dividend Risk)
Although less impactful, interest rates and dividend changes can also influence option prices. These are more important for longer-dated options.
2. Why Is Risk Management Critical in Options?
Options give traders leverage—a small investment can control a large position. While this magnifies profits, it also increases losses. Many beginners fall into the trap of chasing big gains, only to blow up their accounts when trades go wrong.
Good risk management doesn’t eliminate risk—it helps you survive bad trades and stay in the game long enough for your edge to work.
3. Core Principles of Options Risk Management
Here are the foundational principles every options trader should follow:
A. Never Risk More Than You Can Afford to Lose
It sounds obvious, but many traders ignore this. Only use disposable capital, not money meant for rent, bills, or emergencies.
B. Position Sizing
This is one of the most powerful tools in risk management. Don’t bet your entire capital on a single trade. A common rule is to risk 1-2% of your capital on any trade. That way, even a string of losing trades won’t wipe you out.
C. Diversify Your Trades
Avoid putting all your trades on the same stock or sector. Diversification can reduce risk from unexpected news events or market shocks.
D. Know Your Maximum Loss
Before entering any trade, calculate your maximum potential loss. With long calls and puts, your loss is limited to the premium paid. But with short options or complex strategies like spreads, losses can be higher or even unlimited.
4. Practical Risk Management Techniques
A. Use Stop-Loss Orders (Where Applicable)
While options don’t always behave like stocks, you can still set a mental or physical stop-loss based on:
Percentage loss (e.g., exit if the option loses 50%)
Underlying price level (e.g., exit if stock breaks below a key level)
Time decay (e.g., exit 5 days before expiration to avoid Theta crush)
❗ Note: Stop-losses can be tricky with options because of wide bid-ask spreads. It’s important to use limit orders or mental stops to avoid slippage.
B. Avoid Naked Options (Especially Selling)
Selling naked calls or puts can expose you to unlimited risk. Unless you have a large account and full understanding, stick to defined-risk strategies like:
Spreads (credit/debit)
Iron condors
Butterflies
Covered calls
Protective puts
C. Hedge Your Positions
Hedging is like buying insurance. You can reduce risk by combining options in a way that limits losses.
Example:
If you sell a naked put, you can turn it into a bull put spread by buying a lower strike put. This limits your downside if the stock crashes.
D. Use Probability and Greeks
Understanding the "Greeks" can help you analyze risk exposure:
Greek What it Measures Risk Managed
Delta Price sensitivity Directional risk
Theta Time decay Time-related loss
Vega Volatility impact Volatility exposure
Gamma Delta’s change rate Acceleration of price impact
Rho Interest rate impact (minor risk)
Knowing your Greeks allows you to adjust trades when risks become too high.
5. Options Strategies for Risk Management
Some strategies are naturally more “risky,” while others are designed to limit downside. Let’s look at popular risk-managed strategies:
A. Covered Call
You own 100 shares of a stock and sell a call option. This gives you income (premium) and limits upside risk.
Risk: Stock falls
Reward: Premium + upside to strike price
B. Protective Put
You buy a put while holding the stock. It protects you from downside losses, like insurance.
Risk: Cost of put (premium)
Reward: Unlimited upside; limited downside
C. Vertical Spreads (Credit and Debit)
These involve buying and selling options at different strikes.
Bull Call Spread: Buy call + sell higher call
Bear Put Spread: Buy put + sell lower put
Both strategies have limited risk and reward, making them ideal for risk-conscious traders.
D. Iron Condor
You sell a call spread and a put spread on the same stock. Profitable when the stock stays in a defined range.
Risk: Limited to width of spread minus premium
Reward: Net credit received
This is a great strategy for sideways markets and offers good risk/reward if managed well.
6. Managing Risk Over Time
A. Adjusting Trades
If a trade moves against you, you don’t always have to take the loss. You can:
Roll the option to a later expiration
Adjust strikes to collect more credit or redefine risk
Convert to a spread or different strategy
However, be careful not to over-manage trades, which can lead to complex and risky positions.
B. Avoid Trading Around Events
Earnings announcements, Fed meetings, and budget declarations can cause huge volatility spikes. Option premiums are often inflated before such events. If you trade them, keep position size small and use defined-risk trades only.
Oil Steady as Sanction Threat LoomsOil prices held steady near recent highs after Trump threatened Russia with economic penalties if it doesn’t reach a ceasefire with Ukraine within 10–12 days. Traders are watching closely, as potential secondary sanctions on Russia could disrupt crude supply. However, skepticism remains over whether Trump will follow through, given his push for lower oil prices. The threat comes amid ongoing EU sanctions and ahead of key US trade deadlines and an OPEC+ meeting. Despite current tightness and summer demand, concerns of oversupply remain for later in the year.
On the technical side, the price of crude oil is still trading in a sideways range between $64 and $68. The moving averages are confirming a bullish trend in the market, while the Stochastic oscillator is at neutral levels, hinting that the short-term outlook for pricing could go either way. The Bollinger bands have contracted quite excessively, meaning that volatility is low; therefore, it could take some time for any significant moves. Currently, the price is testing the resistance of the 50-day simple moving average, while the first area of technical resistance lies around the $68 level, which is the upper boundary of the current sideways channel.

Gold Tests Key Support Near $3,300Gold held near $3,315 an ounce after a 0.7% drop, as investors awaited the Fed's rate decision, key US economic data, and developments in trade talks. A stronger dollar pressured the bullion, while the market remains on edge ahead of Trump's Aug. 1 tariff deadline. A possible 90-day extension in the US-China trade truce and upcoming jobs and inflation figures could drive volatility. Although gold is up over 25% this year due to geopolitical risks and trade uncertainty, prices have been rangebound since peaking above $3,500 in April.
From a technical point of view, the price of gold is currently testing the support level of the 100-day simple moving average just above the psychological level of $3,300. Even though the Bollinger bands are contracted, they started expanding slightly recently, showing volatility might be picking up, while the moving averages are validating the overall bullish trend in the market. The Stochastic oscillator is in the extreme oversold level, hinting that a bullish resumption of the trend might be seen in the upcoming sessions. Overall, the majority of the technical indicators are hinting at a bullish image in the near short term, so probably it might be a good idea to watch out for any candlestick formations this week that might give you the entry for a long position.
Disclaimer: The opinions in this article are personal to the writer and do not reflect those of Exness

EURUSD : Status @ 25/7Direction: Sell
Signal triggered: 25/7/2025
Stop when:
a) Stop Loss @ 1.1790; or if
b) Buy signal triggered
Action:
Sell the rally
Good luck.
P/S: It seems that 1.1790 is a good resistance line as anticipated. The price may reach as low as 1.1500, which will serve as the next support level. Then we wait there for the next sell or maybe buy signal!
And a BIG congratulation to those who sold @ D - 1.1780 :-)

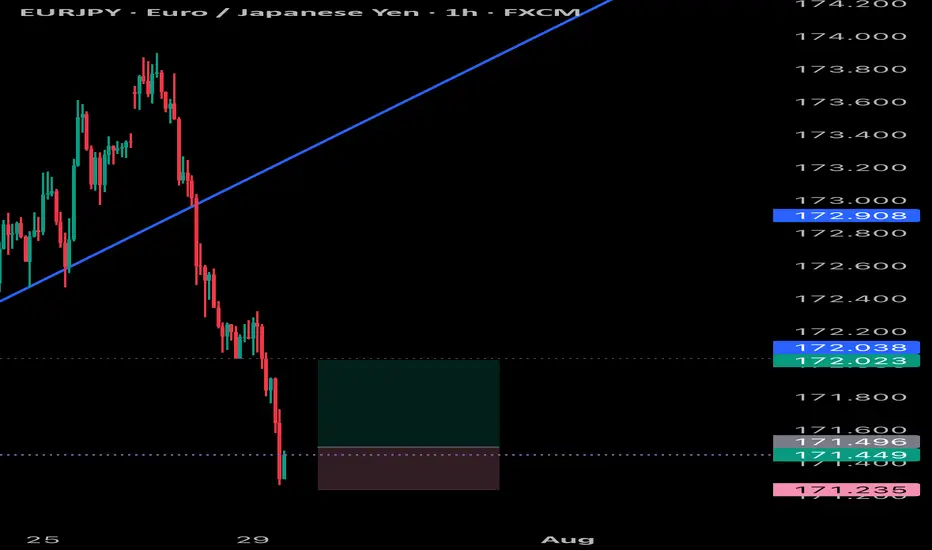
EURJPY SCALP Eurjpy quick scalp trade as it can still drop so it would be wise to not target higher than normal take profits , but will scalp it
Fundamental Market Analysis for July 29, 2025 EURUSDThe pair is consolidating at 148.500, leaving behind a nearly 1% gain since the start of the week. High Treasury yields (10-year bonds — 4.34%) are supporting demand for the dollar, while the easing of the US-Japan trade conflict is reducing defensive demand for the yen. As part of yesterday's statement by the US Treasury, tariffs on Japanese cars are being reduced to 10%, which improves the outlook for export-oriented corporations, but at the same time reduces investors' need for safe-haven currencies.
Despite inflation of 3.7% y/y and rising food costs, the Bank of Japan is likely to keep its rate at 0.5% following its July 30-31 meeting and only revise its CPI forecasts upward. Former Deputy Governor of the Central Bank Hiroshi Nakaso acknowledges that further increases are only possible after assessing the effect of US tariffs, i.e., not before 2026. This scenario reinforces negative real interest rates and a widening yield differential with the US.
In addition, the inflow of Japanese investment into foreign bonds has resumed amid confidence in a gradual, rather than sharp, normalization of BOJ policy. Taken together, these factors point to the likelihood of a test of 150.00 in the coming days in the absence of verbal intervention by the Japanese Ministry of Finance.
Trading recommendation: BUY 148.500, SL 147.900, TP 150.500

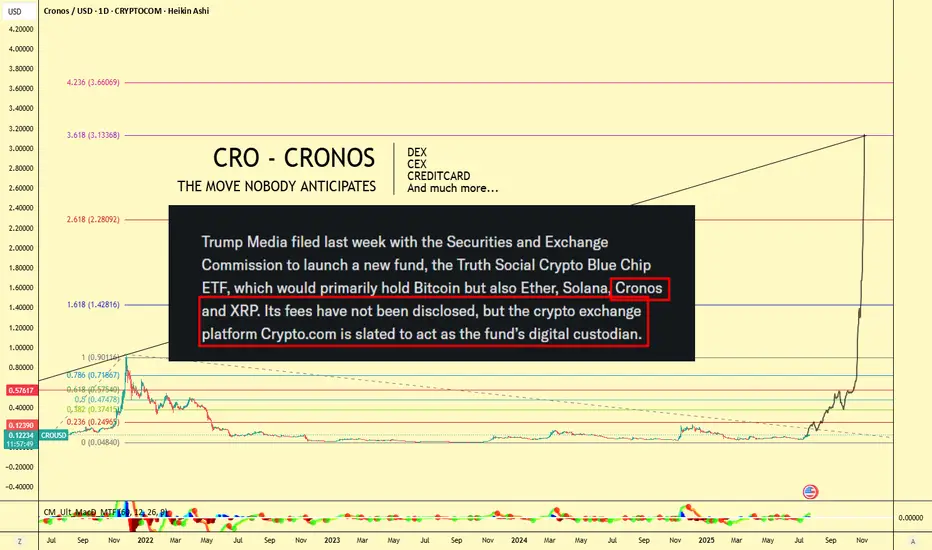
CRO (Crypto.com) $3 Target! Don't Miss This Move🪙 Ticker: OKX:CROUSDT
🕰 Chart: 1D (Heikin Ashi)
🔧 Tools Used: Fibonacci Extension, Fundamental News (ETF Filing)
🔍 Chart Analysis: Fibonacci Extension Targeting $3+
The Fibonacci Extension tool has been applied to the major CRO impulse wave from its peak near $0.90 (late 2021) to the 2022–2023 bottom at $0.0484, confirming a multi-year retracement and consolidation period.
Let’s break down the major Fib levels:
Extension Level Price Target
0.236 $0.2495
0.382 $0.3741
0.618 $0.5745
1.0 $0.9011
1.618 $1.4281
2.618 $2.2809
3.618 $3.1336
📌 Current Price: ~$0.12
🔥 Upside Potential to $3.13+ — a 25x move from current levels if full extension plays out!
📣 Fundamental Catalyst: CRO in Trump Media ETF
According to the chart note (sourced from SEC-related headlines):
"Trump Media filed with the SEC to launch a new ETF, the Truth Social Crypto Blue Chip ETF, which would primarily hold Bitcoin, but also Ether, Solana, Cronos (CRO), and XRP."
Even more important:
"Crypto.com is slated to act as the fund’s digital custodian."
This is massive fundamental validation for CRO — not just as a token, but as an ecosystem and financial infrastructure provider.
🌐 Why Crypto.com Matters: Utility, Ecosystem, Adoption
Crypto.com isn't just an exchange — it's a comprehensive Web3 ecosystem, which includes:
🔁 CEX (Centralized Exchange):
Buy, sell, stake, and trade hundreds of cryptocurrencies with high liquidity and low fees.
🔄 DEX (Decentralized Exchange):
Cronos Chain supports decentralized trading and DeFi apps — with low gas fees and EVM compatibility.
💳 Visa Credit Card Integration:
Crypto.com offers one of the most popular crypto Visa debit cards — earn cashback in CRO and enjoy perks like Spotify/Netflix rebates.
📱 Mobile Super App:
Buy/sell/stake/farm on-the-go with a seamless user interface.
📈 Earn & Lending Services:
Stake CRO or other assets for up to double-digit yields.
🤝 Strategic Partnerships
Crypto.com has been aggressively investing in brand and adoption:
🏟 Official partner of UFC, FIFA World Cup, and Formula 1
🏀 NBA’s Los Angeles Lakers Arena naming rights (Crypto.com Arena)
💼 Member of Singapore's regulated exchanges
🔐 ISO/IEC 27701:2019, PCI:DSS 3.2.1, and SOC 2 compliance — one of the most secure platforms in the industry
🧠 Conclusion: The Perfect Blend of TA + FA
With CRO being included in a potential U.S.-regulated ETF, the Crypto.com ecosystem booming, and technical patterns pointing to a Fib-based target above $3, CRO might be the sleeper play of the next bull run.
"The move nobody anticipates" might just be the most explosive one.
🎯 Short-Term Targets:
$0.25
$0.37
$0.57
🎯 Mid-Term Bull Targets:
$0.90 (prior ATH)
$1.42
$2.28
🎯 Full Cycle Extension:
$3.13
📢 Let me know in the comments:
Are you holding GETTEX:CRO ? What do you think about its inclusion in the ETF?
#CRO #CryptoCom #ETF #TrumpMedia #Altcoins #Bullrun #CryptoTrading #DeFi #FibTargets #CronosChain
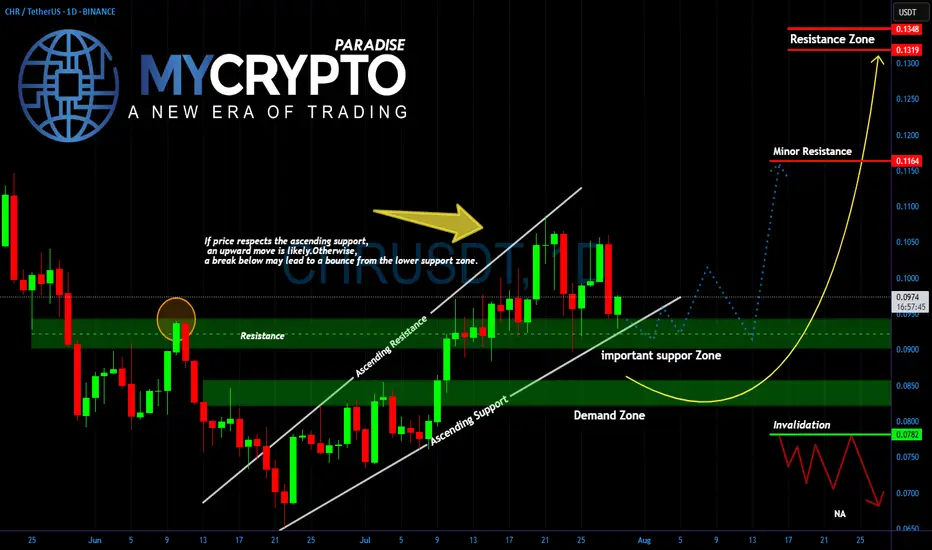
CHR Is About to Explode or Collapse Are You Ready for the Next BYello Paradisers, did you notice how #CHRUSDT is now testing the exact zone we warned about earlier? After weeks of climbing inside a clean ascending channel, the price is now sitting right on top of a critical support area. This is no coincidence what happens here will determine the next major wave.
💎The structure remains bullish as long as #CHR respects the ascending support trendline and the horizontal zone around 0.0900. This region, previously a strong resistance, is now acting as key support. If the bulls step in from here, we could see a sharp rebound toward the minor resistance near 0.1169. A confirmed breakout above that could open the path toward the upper resistance zone between 0.1320 and 0.1351.
💎But don’t get too comfortable. A clean break below this support zone would shift momentum back to the downside, dragging price toward the deeper demand area between 0.0840 and 0.0800. If the structure fully collapses and price breaks below 0.0782, we’d treat that as a clear invalidation of the bullish case, and a much lower range could open up.
For now, CHR remains in a waiting zone. It’s the reaction here that will give us the signal. Let the price come to you don’t chase it.
MyCryptoParadise
iFeel the success🌴
Meta surprises to the upside & strengthens its leadership in AIBy Ion Jauregui – Analyst at ActivTrades
Meta Platforms (TICKER AT: META.US) has posted strong quarterly results that significantly exceeded market expectations, driven by its solid positioning in artificial intelligence, advertising monetization, and the resilience of its digital ecosystem.
Key Financial Highlights
In the second quarter of 2025, Meta reported revenues of $38.72 billion, representing a 15% year-over-year increase, beating consensus estimates by over $1 billion. Net profit reached $13.46 billion, with an adjusted EPS of $5.22, reflecting strong operating leverage.
The advertising segment remains the main growth driver, but revenue gains from generative AI services and enterprise solutions powered by Meta AI and Llama 3, its proprietary language model, were also noteworthy. Meanwhile, Reality Labs, although still operating at a loss, managed to contain its deficits and improve efficiency, while preparing for upcoming product launches linked to the metaverse.
The company maintains a robust cash position with over $58 billion in liquidity, and announced a new $25 billion share buyback program, reinforcing its commitment to shareholder value creation.
Fundamental Analysis
Meta is solidifying its strategic transition into a tech conglomerate focused on AI, personalized advertising, and immersive environments. Despite ongoing regulatory challenges in the U.S. and Europe—having yielded this time to Brussels—the company has maintained strong growth in daily active users (DAUs) and monthly active users (MAUs) across its core platforms: Facebook, Instagram, and WhatsApp.
Consistent investment in AI infrastructure and data centers, coupled with an improved operating margin now at 39%, positions Meta among the most efficient players in the tech sector.
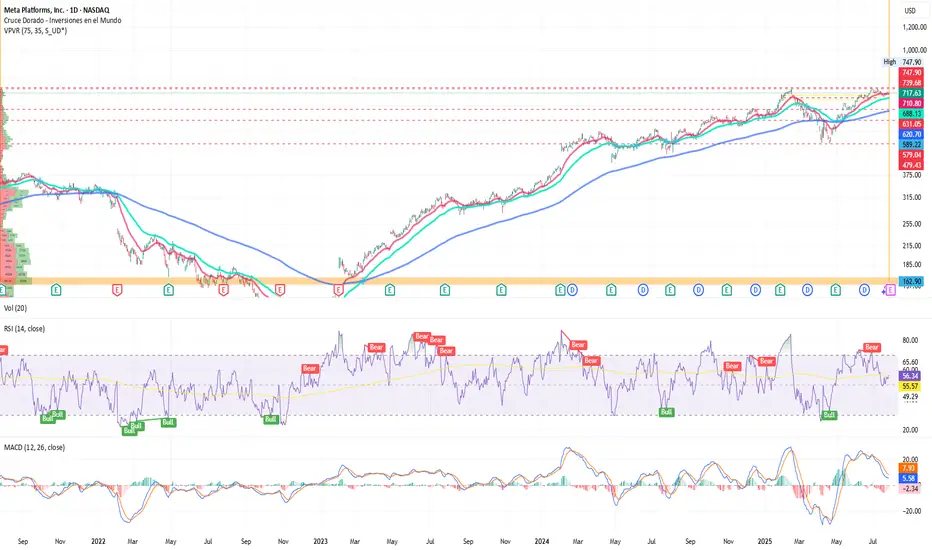
Technical Analysis
From a technical standpoint, Meta is currently trading around $717, following a near 50% rally since April. The daily chart shows a clear uptrend with higher lows in place since November 2022.
The RSI stands at approximately 56.34%, indicating strength without entering overbought territory.
The 50-, 100-, and 200-day moving averages remain aligned in a bullish formation.
The next resistance level is at the all-time high of $747.90; a breakout could pave the way toward $800 in the short term.
The key support level lies at $689, where the 100-day moving average and recent price action converge.
The Point of Control (POC) sits around $590, marking the base of the previous upward move and the recent golden cross that triggered the current rally.
Conclusion
Meta continues to affirm its leadership in the tech sector—not just as a social media powerhouse, but as a key player in the development and implementation of AI-based solutions. Revenue diversification, cost control, and a solid financial structure reinforce its position in an increasingly competitive market. While macroeconomic volatility and regulatory pressures remain, the combination of technical momentum and strong fundamentals suggests the bullish trend could continue.
*******************************************************************************************
La información facilitada no constituye un análisis de inversiones. El material no se ha elaborado de conformidad con los requisitos legales destinados a promover la independencia de los informes de inversiones y, como tal, debe considerarse una comunicación comercial.
Toda la información ha sido preparada por ActivTrades ("AT"). La información no contiene un registro de los precios de AT, o una oferta o solicitud de una transacción en cualquier instrumento financiero. Ninguna representación o garantía se da en cuanto a la exactitud o integridad de esta información.
Cualquier material proporcionado no tiene en cuenta el objetivo específico de inversión y la situación financiera de cualquier persona que pueda recibirlo. La rentabilidad pasada y las estimaciones no sinónimo ni un indicador fiable de la rentabilidad futura. AT presta un servicio exclusivamente de ejecución. En consecuencia, toda persona que actúe sobre la base de la información facilitada lo hace por su cuenta y riesgo. Los tipos de interés pueden cambiar. El riesgo político es impredecible. Las acciones de los bancos centrales pueden variar. Las herramientas de las plataformas no garantizan el éxito.
US30 Forecast: Target Locked, Buy Zones in Sight!Good morning friends ☀️
I've prepared a fresh analysis for US30 (Dow Jones).
My current target is 45,470. Even if the price dips to 45,050 or 44,800, I fully expect it to reach that 45,470 mark.
These levels represent strong buying zones and powerful retest regions—don’t forget that.
Every like from you is my biggest source of motivation to keep posting these insights. 💬📊
Big thanks to everyone supporting with a thumbs-up.

CGPT Buy Idea🔥 Hidden Gem Project Analysis – 5x Potential Play (2025-2026) 🔥
Project Name: (CGPT)
📊 Technical Breakdown (Chart Analysis):
1. Current Price Zone:
Trading at $0.09700.
Critical Support Level (RL): $0.06782 — This is the absolute last line of defense for bulls.
2. Resistance Zones:
Immediate Resistance: $0.12000 (Marked with grey zone)
Mid-Term Target: $0.22000 (MID line) — Historically, price reacts here.
Long-Term Target: $0.55625 - $0.55859 (RH/High) — This is the real breakout zone for a massive rally.
4. Potential Upside:
From current price ($0.097) to High ($0.558) — that’s a 5x - 6x potential rally.
Strong bullish structure forming — Any breakout of $0.12 will trigger fast moves to $0.22 and above.
🔍 Fundamental Narrative (Why This Project?)
Undervalued Gem — Ignored by mainstream, but smart money accumulating.
Major partnerships or exchange listings possible.
Project updates, tech upgrades, or token utility enhancements.
Low Market Cap — Easier for price to pump 3x-5x quickly.
> "🚀 This Coin is Quietly Accumulating Before Exploding 500%+!
Just like how PEPE and FLOKI started slow — this project is gearing up for a monstrous move.
Entry is loading… Don’t regret later when it’s at $0.50+! 📈
DM me for complete research! 📊"

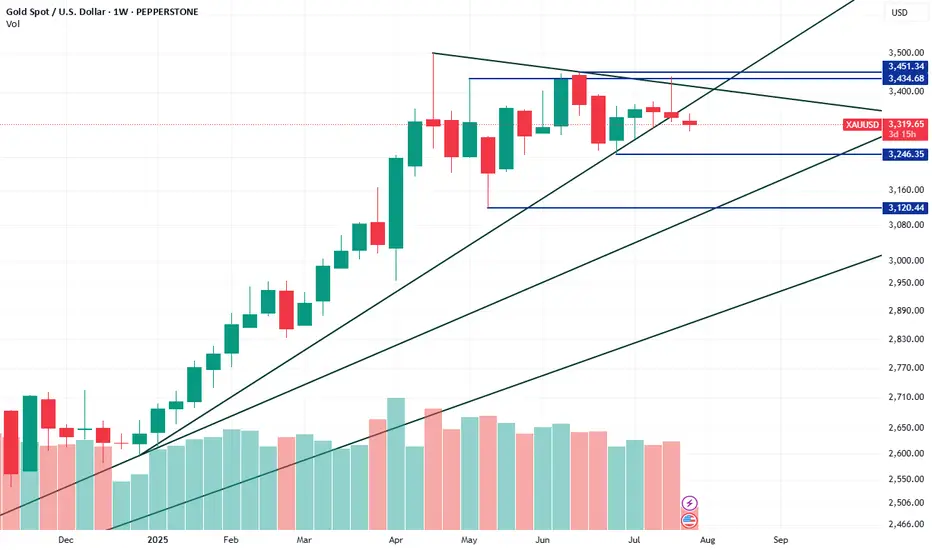
XAUUSD could potentially drop down to 3120XAUUSD has broken its most recent descending trendline on the Weekly chart, signaling a possible short-term reversal. It’s now approaching a higher-timeframe descending trendline, which could act as resistance. The next key demand zone is around 3246; if that fails, the more significant demand lies at 3120. Despite this pullback, the macro trend remains bullish. Notably, institutional traders increased their net long positions by over 40,000 contracts last week, bringing the total to more than 253,000, reflecting a potential shift in sentiment.
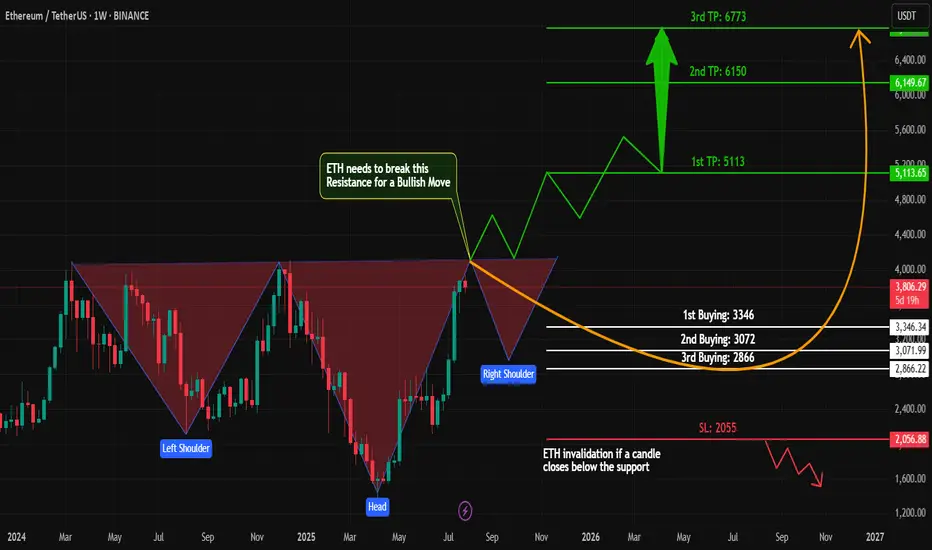
ETH Bullish – Inverse Head & Shoulders Pattern on Weekly Chart!Technical Analysis (Weekly Timeframe)
#Ethereum (ETH) is currently forming a strong bullish structure – the classic Inverse Head & Shoulders pattern – on the weekly chart.
✅ Left Shoulder ✅ Head
🟡 Now Printing the Right Shoulder...
This is a long-term spot trade setup, not for futures.
📈 Key Buy Zones:
1️⃣ First Buy: $3,346
2️⃣ Second Buy: $3,072
3️⃣ Final Support Buy: $2,866
We'll accumulate in these zones as #ETH forms its Right Shoulder.
🔓 Breakout Play:
Once #ETH breaks its All-Time High (ATH), we'll place a Buy Stop Order above the breakout level to ride the next big wave!
💬 Let me know what you think about this #ETH setup.
📌 Are you bullish on #ETH this cycle?
👍 Like, share & follow for more high-probability setups!
#ETH #Ethereum #CryptoTrading #TechnicalAnalysis #InverseHeadAndShoulders #LongTermTrade #SpotTrade #BullishCrypto #Altcoins #TradingView
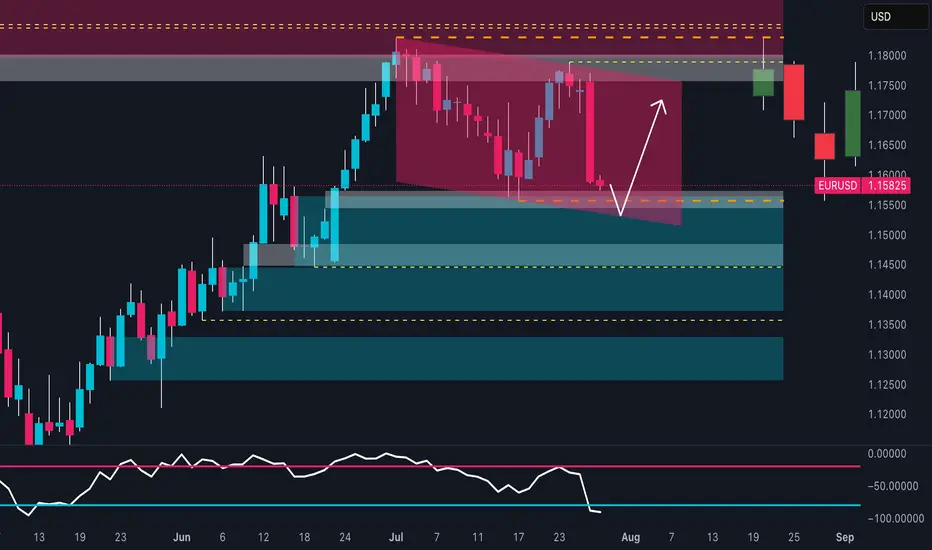
EUR/USD at a Turning Point:Rally or Trap for the Bulls?📉 Technical Analysis
Price has decisively broken out of the descending channel highlighted in recent weeks. The weekly support zone between 1.1540 – 1.1580 is holding, triggering a significant technical reaction. The weekly RSI has entered oversold territory, suggesting a potential short-term reversal.
Key Support: 1.1530–1.1580 (currently reacting)
Key Resistance: 1.1720–1.1780 (inefficiency & supply zone)
Base Case: Potential rebound toward 1.1720–1.1750 before next structural decision
🧠 Sentiment Analysis
82% of retail traders are long, with an average entry at 1.1635
Only 18% are short, a clear minority
This extreme imbalance suggests downside pressure may persist to flush out weak long hands before a genuine reversal takes place.
📊 COT (Commitment of Traders)
USD Index:
Non-Commercials increased both long (+663) and short (+449) positions → uncertain stance but slight USD strengthening
EUR Futures:
Non-Commercials increased long (+6,284) and short (+8,990) positions, but net increase favors the bears
This shift signals a bearish turn in sentiment among large speculators, indicating short-term downward pressure.
📈 Seasonality
In July, EUR/USD historically tends to rise, but:
This year’s price action is underperforming the seasonal pattern, showing relative weakness
August is historically flat to slightly bearish
Seasonality does not currently support a strong bullish continuation
✅ Strategic Conclusion
Current Bias: Bearish-neutral (with short-term bullish bounce expected)
A technical rebound toward 1.1720–1.1750 is likely (liquidity void + RSI bounce + retail imbalance)
However, 1.1720–1.1750 is a key supply zone to monitor for fresh shorts, in line with:
Dollar-supportive COT data
Overcrowded long retail positioning
Weak seasonal context
🧭 Operational Plan:
Avoid holding longs above 1.1750 without macro confirmation
Monitor price action between 1.1720–1.1750 for potential short re-entry
Clean breakout above 1.1780 → shift bias to neutral/bullish
Bitcoin BrokeBitcoin broke below the support area to liquidate high-leverage positions. The price has now regained the $118,000 area and is expected to move upward. The key resistance level is at $120,000.
GBPUSD BUY TIGER SETUP LOOOOOOOOOOOONGwelcome
we have strong mitigation order block on time frame weekly and daily
and on 4H we have break downtrend and retest on it
and we in well discount area
and we have demand on high time frame
so this is good idea for buying
Don't forget to follow me
so that get refresh analysis

EUR/USD: Follow the yellow brick roadHello traders
I have utilized MTF(Multiple Time Frame) analysis for this idea in addition to the current fundamental environment.
The previous weekly levels can often be a good starting point for where this widely traded pair may head next.
On these charts, price has failed ahead of the weekly close of 1.1775. So far.
Fundamentally, the details of the USA/Euro Zone trade deal or framework for a deal, are not very clear yet. Which industries will be hit the hardest in Europe? Fine French wines, Stinky Swiss cheese, Monster M cars from BMW? Take your pick. In my mind, as a consumer, both the USA and the Old Country have significant strengths in different arenas.
As American consumers, we are now going to be forced to some degree to become price conscious one way or the other. Or maybe not. I'll still be sipping California, French or New Zealand wines.
As for the economy:
These "deals" DJT has made so far with Japan and the Euro Zone, once again, smacks of a strong arm policy, more than a reasonable and fair agreement. Time will be the deciding factor. As we have seen over time, trade agreements mean nothing. The WTO is a toothless institution.
The IEEPA ruling heads for the Federal Appeals Court this week and no doubt all the way to the Supreme Court.
However, based on the available information, I am observing the charts by looking back at how the markets react at the Sunday open. It tends to retest weekly OCHL levels first.
As for the USA/EURO zone deal, if it plays out according to news reports, it seems to be logical that a lot of Euros will have to be converted to USD.
But feel free to correct me.
Therefore, until Wednesday and the FOMC presser, I am short EUR/USD.
Best of luck.

EURUSD may fall, but it's all about the FOMC DecisionEURUSD may fall, but it's all about the FOMC Decision
During the first 2 weeks of July, EURUSD fell from 1.18000 to 1.1550 and then the price rose again due to renewed tariffs.
Trump's comments regarding Powell and tariffs, according to which the EU and the US may reach an agreement soon, renewed the strength of EURUSD.
However, this time it is more related to the FOMC. If the FED cuts rates, EURUSD can drop further. When they didn't cut rates, the USD was weak or didn't move at all.
Let's see.
If Powell makes any surprises this time, EURUSD could fall, as shown in the chart, from 1.1800 to 1.1550, which is almost 250 pips lower.
Key support zones: 1.1660 and 1.1580
You may find more details in the chart!
Thank you and Good Luck!
PS: Please support with a like or comment if you find this analysis useful for your trading day
Disclosure: I am part of Trade Nation's Influencer program and receive a monthly fee for using their TradingView charts in my analysis.
