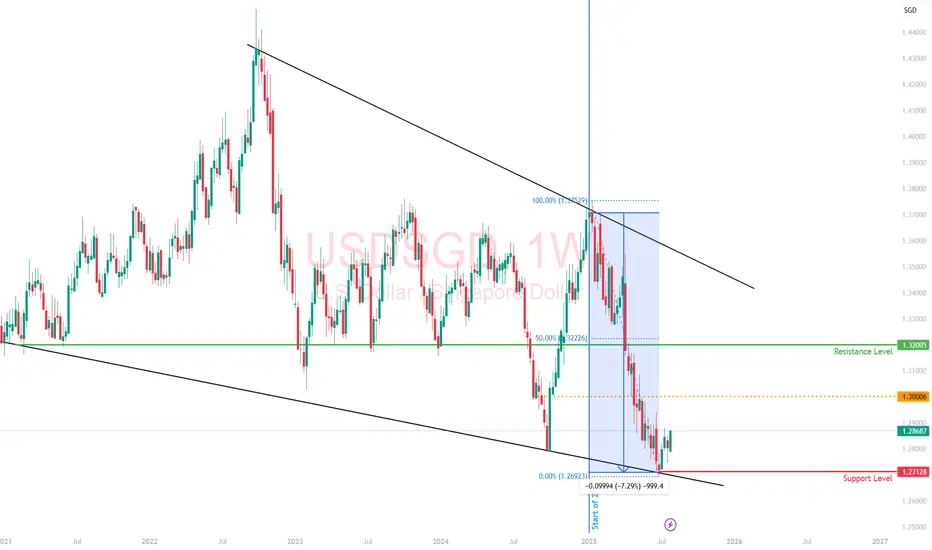
Singapore Dollar: Asia’s Quiet Safe Haven with Eyes on ParityThe Singapore dollar has quietly emerged as one of the strongest performers in Asia, gaining over 7% against the US dollar this year.
While much of the FX world fixates on the yen or franc in times of uncertainty, the SGD is carving out a niche as a regional safe-haven, driven not by size or liquidity, but by credibility.
The strength in the SGD isn’t just about USD weakness. Singapore's macro fundamentals
budget surpluses,
robust reserves, and
deep-rooted investor confidence
offer a kind of quiet strength that traders tend to overlook until it becomes obvious.
This makes the SGD a compelling hedge against both regional turmoil and global dollar decay.
As more global capital looks for stable homes outside of the traditional, Singapore’s financial system and currency are set to benefit.
The idea of SGD hitting parity with the USD, once dismissed as unrealistic, is now getting serious attention.
Analysts have suggested that it could happen within five years, but I wouldn’t be surprised if it comes sooner!
The greenback’s structural issues of twin deficits, political gridlock, and de-dollarization headwinds are no longer theoretical.
That said, liquidity is still a constraint. The SGD makes up just 2% of global FX turnover, and the MAS actively manages the currency to avoid excessive volatility.
This means that while the long-term trend favors SGD appreciation, traders betting on a rapid sprint to parity may be left waiting.
In my view, the SGD is one of the most underappreciated macro trades in FX.
Fundamental Analysis
Hold off on EURUSD for nowYesterday, EURUSD dropped over 150 pips following the trade agreement between the US and the European Union.
Tomorrow, the Fed is expected to announce interest rates, which could bring further volatility.
Avoid entering new positions at the moment and don’t overdo it with your lot sizes.
Once the news is out, there will be clearer and more confirmed trade opportunities.

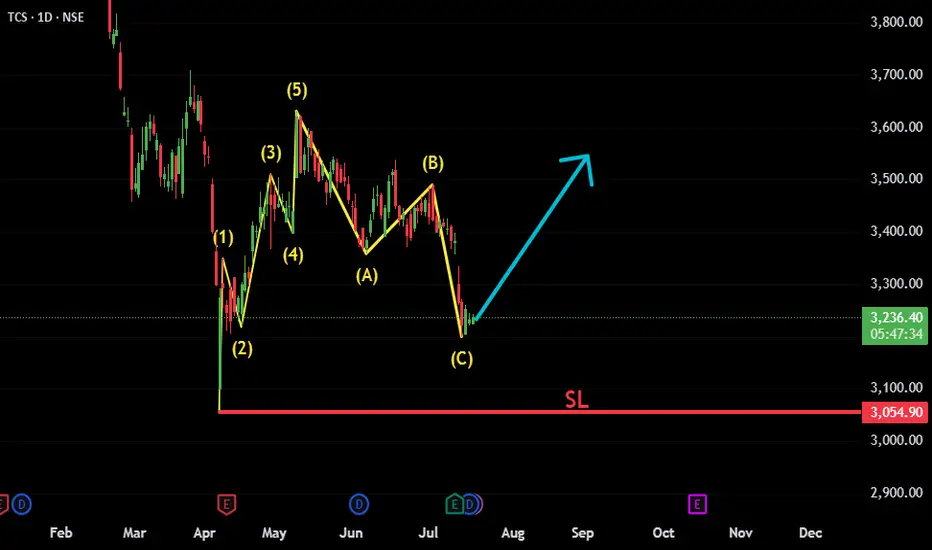
TCS: ABC Correction Complete – New Impulse Wave in FocusTCS appears to have completed a classic Elliott Wave structure, consisting of an initial 5-wave impulsive move followed by an A-B-C corrective phase. The recent price action suggests the correction has likely ended, and a new bullish impulsive move is beginning.
Fundamental trigger:
Interestingly, just a few days ago, TCS announced strong quarterly results — reporting solid profits and declaring a dividend. Despite the positive news, the stock reacted negatively and moved lower. This could have been a classic case of "good news, bad reaction" — possibly a stop-loss hunt or smart money absorbing liquidity before the next leg up.
Key technical points:
✅ Wave 1-2-3-4-5 clearly visible, forming the initial impulse.
✅ A-B-C correction appears complete with price reversing from a key support zone.
📈 Bullish structure forming; watching for confirmation with a break above recent highs.
🔍 Technicals and sentiment suggest renewed upside potential, despite short-term shakeouts.
Invalidation below recent swing low (Beginning of 1st Impulsive).
This setup offers a potential long opportunity with a favorable risk-reward
#TCS #NSE:TCS #ElliottWave #WaveAnalysis #TechnicalAnalysis #ABCCorrection #ImpulsiveWave #LongSetup #ChartAnalysis #NSEStocks #IndianStocks #Dividend #Earnings #PostEarningsMove #TrendReversal #SwingTrading #PriceAction #SmartMoney
GBPUSDGBPUSD has taken liquidity and is heading towards the 2H ORDERBLOCK at 1.33140 once I’ve reached this zone I will take profit and go long. Taking into account jolts today so be careful of volatility and the possibility of long wicks. I can’t see anymore liquidity underneath so expecting big volume to the upside

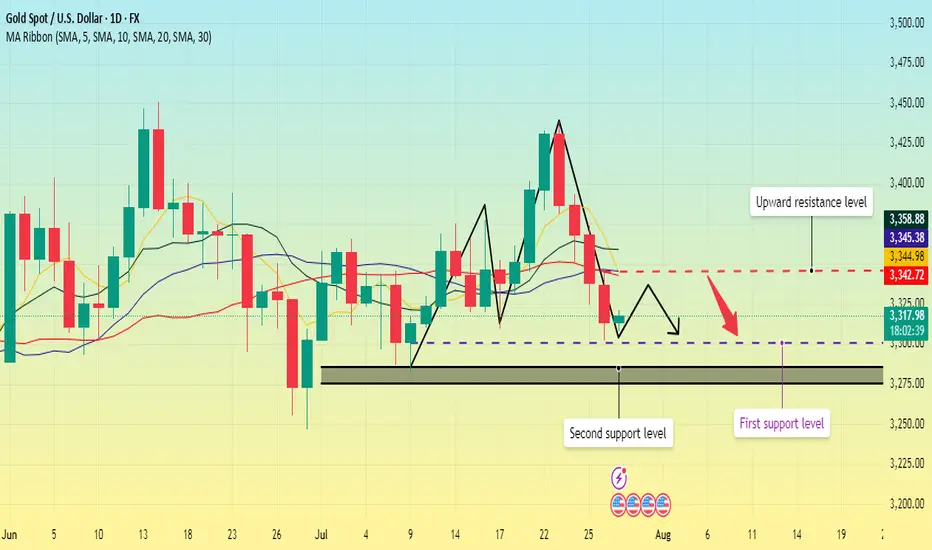
Gold repeatedly tested lows. Will it break through?On Monday, the Asian market opened low and rose in the early trading. In the European trading, it rose to around 3345. The European trading was under pressure and fluctuated. The US trading began to accelerate its decline, and the lowest point reached around 3302. Then it continued to fluctuate in the range of 3300-3320.
On July 27, the United States and the European Union reached a framework trade agreement; the agreement reduced market concerns about the global economic recession, promoted the attractiveness of risky assets, and boosted the stock market and the US dollar. Although Trump has repeatedly pressured for a substantial interest rate cut, the market has strong expectations for a September interest rate cut. The current expectation of maintaining a stable interest rate dominates the market, coupled with the strength of the US dollar, which puts gold prices under downward pressure in the short term.
Gold opened low in the early trading on Monday and then rebounded to recover the losses, but then fell below the low again, and the daily line closed in the negative, and now it has formed a four-day negative decline. MA5 and 10-day moving averages form a dead cross, and there is a downward turn.
The focus on the upper side is around Monday's high of 3345, which is also near the current position of MA5, 20, and 30-day moving averages. Below this position, gold is weak; if it breaks upward, it is necessary to prevent the possibility of a rebound correction.
The lower support first focuses on the 3300 integer mark; secondly, focus on the area around 3285-3275.
Operation strategy:
Short near 3340, stop loss 3350, profit range 3320-3300;
Long near 3300, stop loss 3290, profit range 3320-3340.
Before the release of US data on Tuesday, you can maintain this operation strategy; after the data is released, adjust the strategy based on the impact of the data.
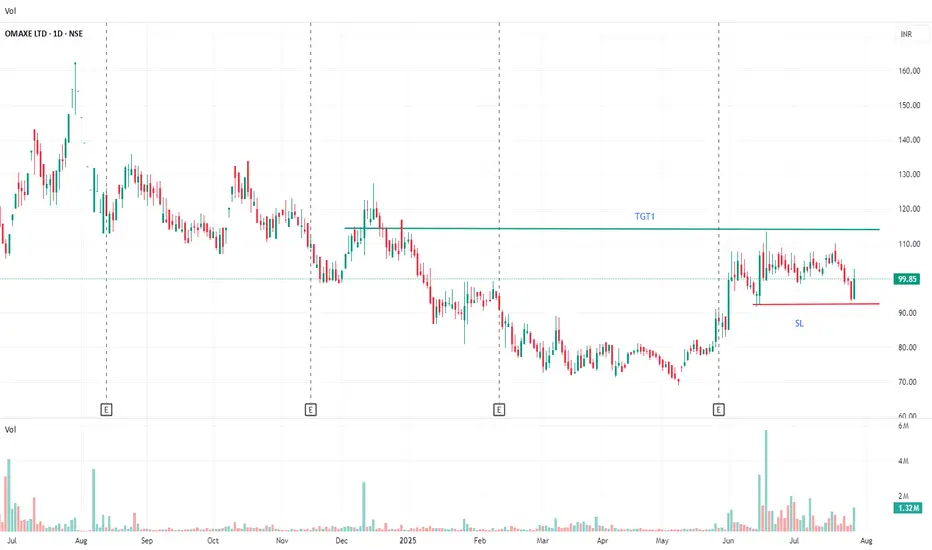
Omaxe Chowk retail leasing picks up paceRangebound since 2021
Showing signs of accumulation 📦
Cheap on Price-to-Book basis vs peers
Low public float → can move fast on news ⚡
Bull factors:
Undervalued vs peers (DLF, Godrej Prop)
Reviving real estate sector in Tier 2/3
Rental income to kick in from Omaxe Chowk 💰
Debt reduction plans are underway
high debt is a concern & project delay may be a concern
Keep on watchlist 📋 or consider small allocation with a long-term view. 🚧
short term traders follow chart.
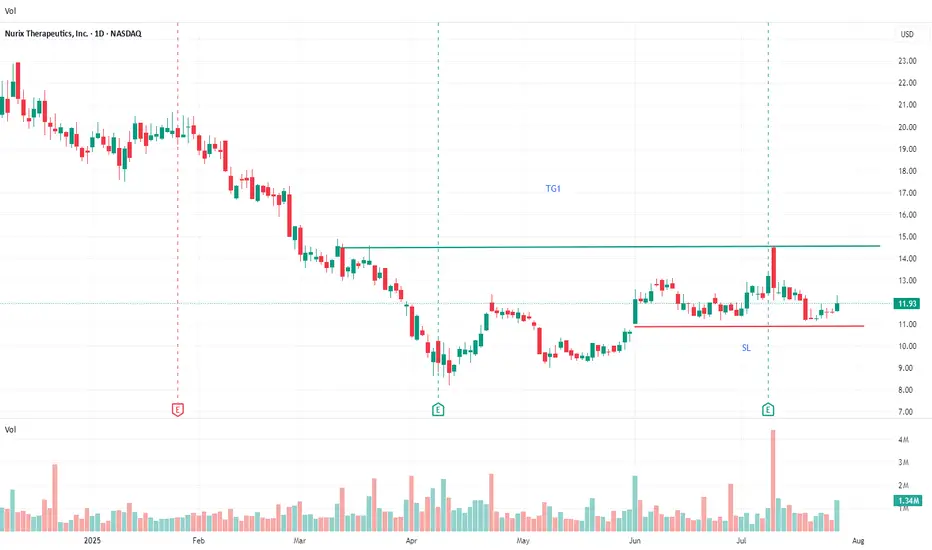
Gilead tie-up ,Big Pharma confidence,massive upside if trials OK
🧪 Pipeline Progress (as of latest update):
NX-2127 & NX-5948 in Phase 1 🔬
NX-1607: Promising early clinical data in solid tumors
Multiple preclinical programs in immuno-oncology and autoimmune space
Down ~80% from highs (2021 biotech bubble burst 😬)
Consolidating near lows — potential bottom fishing zone 🐟
High short interest = possible squeeze setup 🔥
Speculative high-reward biotech. Great long-term potential if pipeline delivers. Suitable for risk-tolerant investors only. Not for the faint-hearted 🧠⚡
UNH Earnings Lotto Setup** (2025-07-28)
📊 **UNH Earnings Lotto Setup** (2025-07-28)
🎯 **Targeting a 2x return on post-earnings upside move**
---
### 💡 Trade Thesis:
**UnitedHealth (UNH)** is primed for a potential bounce on earnings:
* ✅ **Revenue Growth**: +9.8% YoY
* 🔥 **EPS Beat Rate**: 88% over last 8 quarters
* ⚠️ Margin compression risk from increased utilization
* 🧠 **Analyst Upgrades** trending positive
* 📉 RSI = **30.06** → Oversold territory
---
### 🔎 Options Flow & Technicals
* 🧲 Max Pain: **\$290**
* 🟢 Bullish call OI stacking at **\$285**
* ⚖️ IV Rank: **0.75** → Still has juice
* 🔻 Trading below 20D/50D MAs → Room for reversal
---
### 💰 Trade Setup
```json
{
"Instrument": "UNH",
"Direction": "Call (Long)",
"Strike": "$285",
"Entry Price": "$10.30",
"Profit Target": "$20.60 (2x)",
"Stop Loss": "$5.15 (50%)",
"Size": "1 contract",
"Expiry": "2025-08-01",
"Entry Timing": "Pre-Earnings Close (July 28)",
"Earnings Date": "2025-07-29 BMO",
"Expected Move": "±5%",
"Confidence": "70%"
}
```
---
### ⚖️ Risk/Reward
* Max Risk: 💸 \$1,030
* Max Gain: 🚀 \$1,030
* R/R Ratio: **1:2**
* Lotto-style with tight SL post-ER
---
### 🧭 Execution Plan
* 📅 Buy before close on **July 28**
* ⏰ Close same-day post ER **if target or SL hits**
* ❌ Exit manually if theta crush hits hard
---
### 🗣️ Final Note:
> “Oversold + Strong fundamentals + Positive consensus = Earnings bounce in the making.”
---
📌 Tag your UNH trades
💬 Drop your lotto setups
❤️ Like & repost if you're playing UNH this week!
\#UNH #EarningsPlay #OptionsTrading #TradingView #UNHEarnings #LottoTrade #CallOptions #HealthcareStocks #SwingTrade #RSI #IVRank #MaxPain

TLRY Earnings Play: Lotto-Style PUT Setup
📉 **TLRY Earnings Play: Lotto-Style PUT Setup**
*Tilray Brands (TLRY) - Earnings Due July 30 (AMC)*
🔻High risk. High reward. Possibly… nothing. But here's the setup:
---
### 🔬 Fundamental Breakdown:
* 💸 **TTM Revenue Growth**: -1.4% (🚩 declining)
* 📉 **Profit Margin**: -114.4%
* 🧾 **Operating Margin**: -16.8%
* 🧠 **EPS Surprise (avg 8Q)**: **-89.4%**, with only **12% beat rate**
* 🧯 **Sector Risk**: Cannabis = Over-regulated + Overcrowded
🧮 **Fundamental Score**: 2/10 → Broken business model.
---
### 📊 Technicals:
* 🔺 Above 20D MA (\$0.61) and 50D MA (\$0.49)
* 🔻 Well below 200D MA (\$0.91)
* 📉 Volume 0.72x = Weak institutional interest
* 📏 RSI: 57.69 (neutral drift)
**Technical Score**: 4/10 → Weak drift, low conviction.
---
### ⚠️ No Options Flow. No Big Bets Seen.
(But that’s exactly what makes this a clean lotto...)
---
## 🎯 Lotto Trade Idea:
```json
{
"Type": "PUT",
"Strike": "$0.70",
"Expiry": "Aug 1, 2025",
"Entry": "$0.10",
"Profit Target": "$0.50",
"Stop Loss": "$0.035",
"Confidence": "30%",
"Size": "2% portfolio max",
"Timing": "Pre-earnings close"
}
```
---
### 🧠 Strategy:
This is not a trade based on strength. It’s based on **TLRY’s consistent failure to deliver** — and if it disappoints again, we ride the downside. If not? Risk tightly capped.
---
⚖️ **Conviction**: 35%
💀 **Risk**: Total loss possible
🚀 **Reward**: 400%+ possible
---
📝 *Not financial advice — just one degenerate’s earnings notebook.*
💬 Drop your TLRY lotto plans below👇

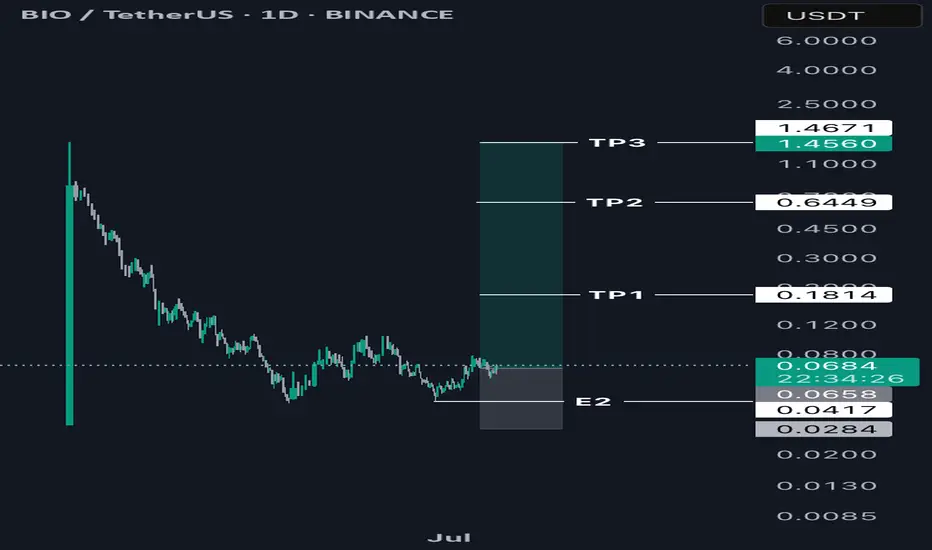
The Perfect Setup for a 90% Drop; Before a Massive RallyCoinbase just added NYSE:BIO to its roadmap a few hours ago. Based on past patterns, that usually means we’re 5–7 days away from a spot listing.
Here’s how I’m positioning for it — and a word of advice: avoid leverage on this one.
With a risk-reward of 37.17, you really don’t need it. Good luck.
CLS Earnings Play - Bullish Setup (07/28)
📈 **CLS Earnings Play - Bullish Setup (07/28)** 💥
💡 *Earnings Confidence: 75% | Sector: Tech/AI Hardware*
🚀 **THESIS**:
* 🔋 19.9% TTM revenue growth
* ✅ 8-quarter beat streak (avg. +11.5%)
* 📈 RSI > 50D/200D MA → Strong momentum
* 🧠 Sector tailwinds from AI/data infra
* 💬 Analysts lagging price → potential upgrades
📊 **OPTIONS FLOW**:
* 🟢 Calls piling at \$175 (institutions leaning bullish)
* 🛑 Some downside puts at \$170 (hedging only)
* 🧮 IV Rank: 0.65 | Expected Move: ±\$11
🔥 **TRADE PLAN**
> 🎯 **Buy CLS \$175 Call (08/01 Exp)**
> 💵 **Entry**: \$8.80
> 📈 **Profit Target**: \$26.40 (+200%)
> 🛑 **Stop Loss**: \$4.40
> ⏰ **Entry Timing**: *Just before earnings close* (07/30 AMC)
> 💼 **Size**: 2% of portfolio
📉 **Risk**: Moderate IV, downside if earnings miss.
📊 **Reward**: Strong beat history + AI trend = possible upside surprise.
🔔 **Watchlist it now. Execute near close 07/30.**

Daily Analysis- XAUUSD (Tuesday, 29th July 2025)Bias: No Bias
USD News(Red Folder):
-JOLTS Job Openings
Notes:
- Strong bearish closure
- Uncertainty on fundamentals
- Potential BUY/SELL if there's
confirmation on lower timeframe
- Pivot point: -
Disclaimer:
This analysis is from a personal point of view, always conduct on your own research before making any trading decisions as the analysis do not guarantee complete accuracy.

Trade management for NZD/AUDThe US-EU trade deal boosted USD demand and jolted FX markets at the open. This, coupled with low liquidity during the Monday Asian session caused a gap in this pair. Our short term trade was taken out at break even, while our medium term trade narrowly survived. This was a technical play in an odd pair, opportunistic while doing some charting :) I took profit at 1:1 and will wait to deploy capital elsewhere.

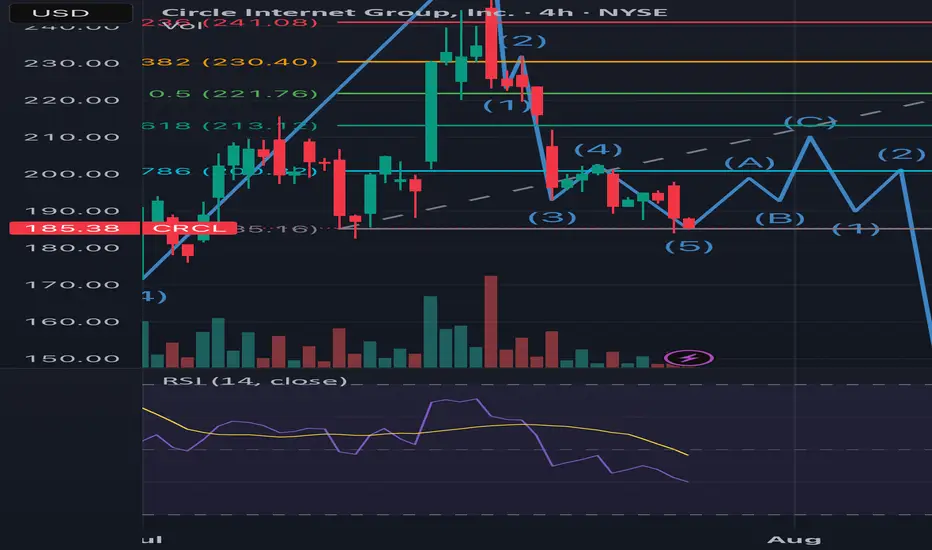
What goes around comes full CRCLFor the record, I bought in at ~$220 and looking to exit to ethical reasons. I believe that this stock will reach over $400USD for the end of the year but with every l opportunity left off for a greater cause, there will always be a greater reward.
1. Notice the end of the first 5 wave Elliot Impulse coincides with the passing of the GENIUS bill. Wave 3 peak was the ATH and wave 5 was the Friday peak of around $262.
2. We’ve entered the correction where sellers are looking to close from the hype
Wave 1 of the correction was the sell off from the wave 5 peak.
From the chart you can see the 3 wave correction is beginning with wave 1 of the 3 coming to an end.
Good news if you want to swing it to 213, this would be a good entry. Bad news if you want ito t hold it for ATH as it means you’d have to bear the third wave of the correction phase (gap fill ~$216), from there I’m expecting the huge sell off post earnings and FED expectations.
However, after retracing a new cycle will emerge led by major catalysts like the CLARITY Bill, CIRCLE’s bank charter application, USDT diminishing presence in the US and the adoption of USDC even possibly making it the standard stablecoin for all US crypto activity, DE-Fi growth and tradfi participation and growth in their MMF and remittance segments. This will kick start a new run where the highs of $400 will be achieved.
So target next high (earnings time) is $213. I assume price will not go below this region. But a recommended sell until q4
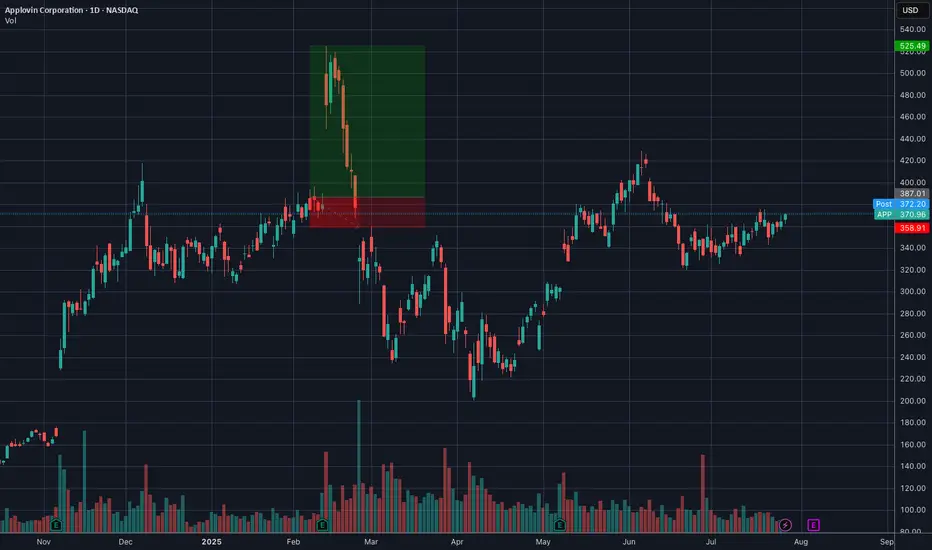
Buy Idea APP (Applovin Corp)Entry: $371 - 372
Stop: $342.50
Risk per share: $28.80
Earnings Catalyst Setup
• Flat base breakout above $370 zone, strong price structure
• Volume expanding into earnings — ideal for pre-earnings momentum pop
• Holding all major MAs: 21EMA, 50MA, 200MA clustered below
• MACD & Oscillators turning up, showing early momentum shift
• Institutional positioning appears supportive
• Earnings Date: ~9 days (6 Aug 2025 after mkt)
⚠️ Key Notes
• Pre-earnings breakout pattern, keep size light
• Possible re-rating if earnings surprise positively — watch for revenue growth in AI/game ads
• Sell partial above 1R to de-risk, trail rest
DISCLAIMER : The content and materials featured are for your information and education only and are not attended to address your particular personal requirements. The information does not constitute financial advice or recommendation and should not be considered as such. Risk Management is Your Shield! Always prioritise risk management. It’s your best defence against losses.
Dollar General | DG | Long at $90.00Dollar General NYSE:DG took a massive hit this morning after revising their future earnings guidance. The economy is showing many signs of a recession, and this is a clear warning. From a technical analysis perspective, it has retouched my "crash" simple moving average and may dip further into the $80's in the near-term. But, like many overall strong companies that suddenly plummet, I view this as a future opportunity given the strength of NYSE:DG as a business (holistically). Dollar General is the only grocery and home goods store around in many rural locations. So, while there is doom and gloom in the near-term, Dollar General is in a personal buy zone at $90.00. I view this as a starter position, though, with the potential for future declines/opportunities for additional share accumulation in the near-term.
Target #1 = $100.00
Target #2 = $122.00
Target #3 = $200.00+ (very-long term outlook...)

GE Healthcare Technology | GEHC | Long at $62.25GE Healthcare Technology $NASDAQ:GEHC. An aging and unhealthy population will only create an increased need for healthcare imaging services. Add AI to the diagnostic mix, and imaging will be imperative for routine health maintenance and screening. With a P/E of 15x, debt-to equity of 1x, earnings forecast growth of 8.36% per year, and bullish analyst ratings, this could be a good value play for the patient.
Thus, at $62.25, NASDAQ:GEHC is in a personal buy zone. Further drops are possible if trade wars make imaging materials/technology difficult to obtain, but that general statement applies to the whole market at this time...
Targets:
$70.00
$78.00

07/28/25 Trade Journal, and ES_F Stock Market analysis EOD accountability report: +405
Sleep: 5 hours
Overall health: meh
VX Algo System Signals from (9:30am to 2pm)
— 9:00 AM Market Structure flipped bullish❌
— 10:04 AM VXAlgo ES X1 Buy signal! ✅
— 11:21 AM Under 6424, the structure is bearish. Don't avg down! ✅
— 11:40 AMVXAlgo NQ X1 Buy Signal! ✅
— 12:40 PM VXAlgo NQ X1DD Sell Signal! ✅
— 1:30 PM VXAlgo ES X3DD Sell Signal! ✅
What’s are some news or takeaway from today? and What major news or event impacted the market today?
Today was one of the few short the resistance day and refreshing to see after we been grinding ATH (all time highs)
News
Eu trade deal over the weekend,
& china tariff extension.
What are the critical support levels to watch?
--> Above 6395= Bullish, Under 6374= Bearish

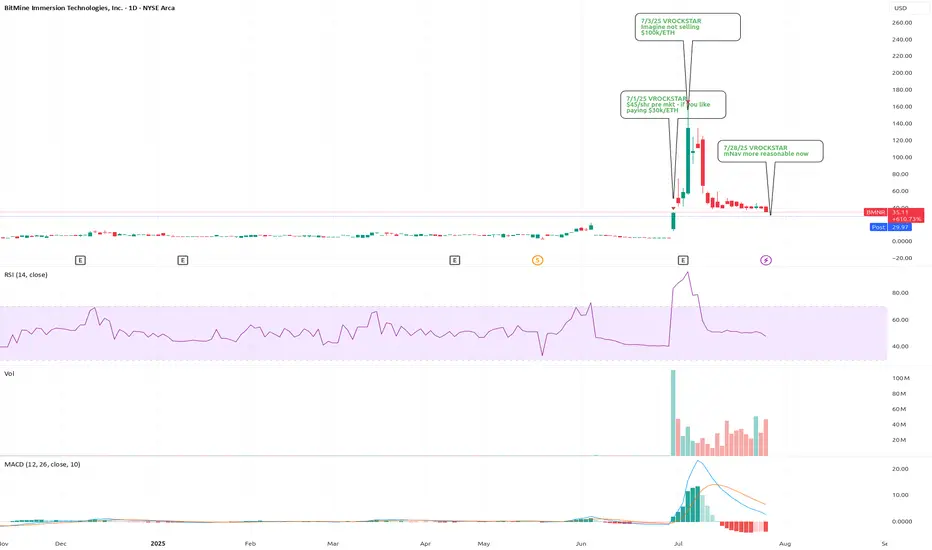
7/28/25 - $bmnr - mNav more reasonable now (1.3x at ~$30/shr)7/28/25 :: VROCKSTAR :: AMEX:BMNR
mNav more reasonable now (1.3x at ~$30/shr)
- i'd link the docs but tradingview wants you to do the digging and doesn't want me to "promote" doing your own DD. ironic.
- so here's how you get there
- go the sec dot gov website search edgar in google
- type in the ticker
- check out the latest 8K
- click presentation
- slide 30 shows "BMNR NAV Detail"
- about 23 bucks per share NAV on fully diluted shares
- AH this thing trading at $30 ish... so 1.3x mnav
- considering view that ETH becoming a captured/ "knighted" winner by the tradfi gremlins, $10k/eth or higher not unlikely this cycle
- this type of "ROE" on a Kc of probably 10-15% means a 3..4...5x mNAV at cycle top not unreasonabl
- so if ETH declines here 50% (also reasonable to expect the worst, you're at $10-15/shr assuming mnav toward 1)... and then a say 2x mnav on $10k/eth would mean shares (considering no additional moves/ accretion from here - also unlikely and conservative) would mean a 4x on the current share px so conservatively that's $100 again.
- does it get to ATH?
- honestly the way that euphoria trades if we make a run for $100... probably yeah moar ATH, but that's unlikely to happen ST unless ETH has a monster run (and it already has)
- nevertheless... i'm finally (VERY) slowly adding this to my exposure, which for me means 50 bps at the AH px of $30.
V
XAUUSD Bearish BreakoutGold (XAUUSD) has broken below the ascending trendline and is currently trading under the 200 EMA—confirming a shift in short-term momentum. A clean bearish rejection was observed on the retest.
* Breakout from rising wedge pattern
* 200 EMA acting as dynamic resistance
* MACD histogram showing increased bearish pressure
* Resistance: 3,360
* Support: 3,247 – 3,245
Risk-to-reward setup is favorable for a short trade.
Gold remains under pressure due to a stronger U.S. dollar and higher bond yields. The latest economic data (GDP and durable goods orders) reinforced expectations that the Federal Reserve will keep interest rates elevated, reducing demand for gold.
* USD strength supported by robust macro data
* Real yields remain high, weighing on gold
* Central bank demand subdued
* No significant geopolitical risk to drive haven flows this week
Market sentiment is bearish unless we see a dovish shift from the Fed or surprise risk events.
🎯 **Trade Setup**
* Sell Entry: 3,314
* Stop Loss: 3,360
* Take Profit: 3,247
* Risk\:Reward: \~1:2
📌 **Bias:** Bearish (Short-Term)
Price action remains weak below the 200 EMA and key structure. Expect continuation to the downside toward 3,247 support.

Rest and waitThe daily structure in the S&P 500 implies a rest and wait structure for Tuesday. This would mean that the S&P 500 would trade inside the Monday range on Tuesday as the market prepares for a tremendous amount of fundamental information coming out this week.

SAGAUSDTNow is the time to buy and hold with low risk.
Target: 0.70
Stop-loss: Weekly candle close below 0.17
I'm just sharing my personal opinion to help us all better understand the market’s potential.
Always do your own research before investing — don’t rely solely on my view as a beginner, or anyone else's, even top analysts.
No one can predict the future with certainty.
Wishing peace and clarity to everyone.

Amd - New all time highs will follow!🪠Amd ( NASDAQ:AMD ) rallies even much further:
🔎Analysis summary:
After Amd perfectly retested a major confluence of support a couple of months ago, we saw a textbook reversal. This retest was followed by a rally of more than +100% in a short period of time. But considering all the bullish momentum, Amd is far from creating a top formation.
📝Levels to watch:
$200
SwingTraderPhil
SwingTrading.Simplified. | Investing.Simplified. | #LONGTERMVISION
