ETH continues to gather more upward momentumETH continues to gather more upward momentum
From our previous analysis, Ethereum is close to the last target, but the potential seems higher.
On the 60-minute chart, the price has already formed a small bullish flag pattern, indicating that the bulls are in control of the price and ETH could move beyond our last target.
I am looking for a possible upward move with targets at 3080; 3175 and 3250.
You may find more details in the chart!
Thank you and Good Luck!
PS: Please support with a like or comment if you find this analysis useful for your trading day
Fundamental Analysis

XAUUSDIt seems that gold will continue its downward movement to the 3336 range after touching the 3366 price range.

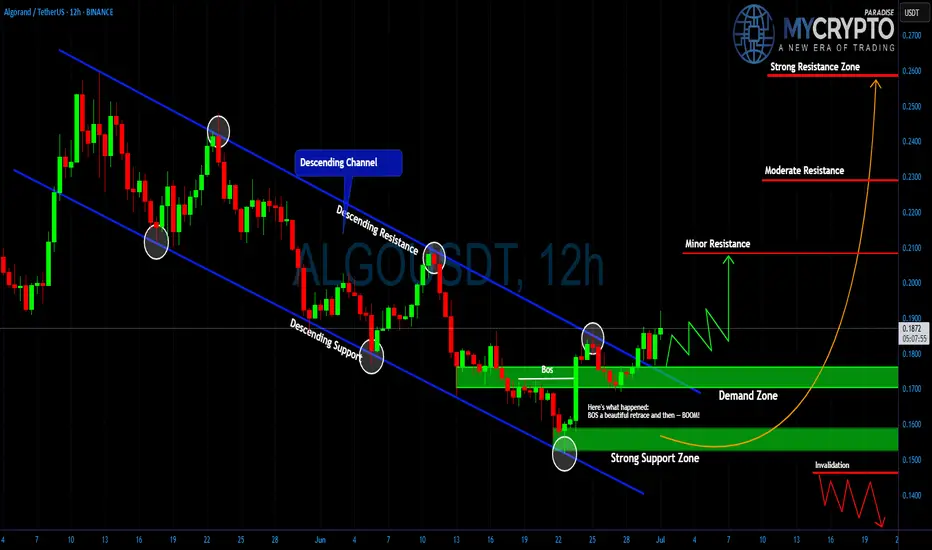
ALGO: Surprise Rally Ahead?Yello Paradisers, did you spot that breakout from the descending channel in time or are you still waiting for confirmation that already happened?
💎#ALGO/USDT has officially broken out of its multi-week descending channel after a textbook Break of Structure (BoS). Price action gave us a beautiful retrace into the demand zone, and from there boom momentum began shifting. This move is now showing early signs of bullish continuation, but as always, the majority will only realize it once the big move is already done.
💎#ALGO had been trading within a clearly defined descending channel, with price reacting precisely between the descending resistance and descending support lines. The breakout occurred after a strong candle pierced the descending resistance, and more importantly, we got a BoS followed by a clean retest of the demand zone around $0.165–$0.175. That reaction was sharp and decisive, indicating strong interest from buyers stepping in.
💎As of now, it is trading near $0.186 and forming higher lows, which supports the idea of an ongoing trend reversal. The structure has changed, and bulls are slowly regaining control. If price sustains above $0.190, the doors open for further upside. The first key level that could slow momentum is minor resistance near $0.210. If that level breaks with volume, moderate resistance around $0.230 becomes the next critical zone. Above that, the major target sits at $0.260, a strong resistance area where a lot of liquidity could be triggered.
💎On the flip side, the strong support zone between $0.145 and $0.155 remains our invalidation area. If price drops below this range, the bullish setup collapses, and we reassess the entire structure. But unless that happens, the bias remains cautiously bullish.
Trade Smart. Stay Patient. Be Consistent.
MyCryptoParadise
iFeel the success🌴
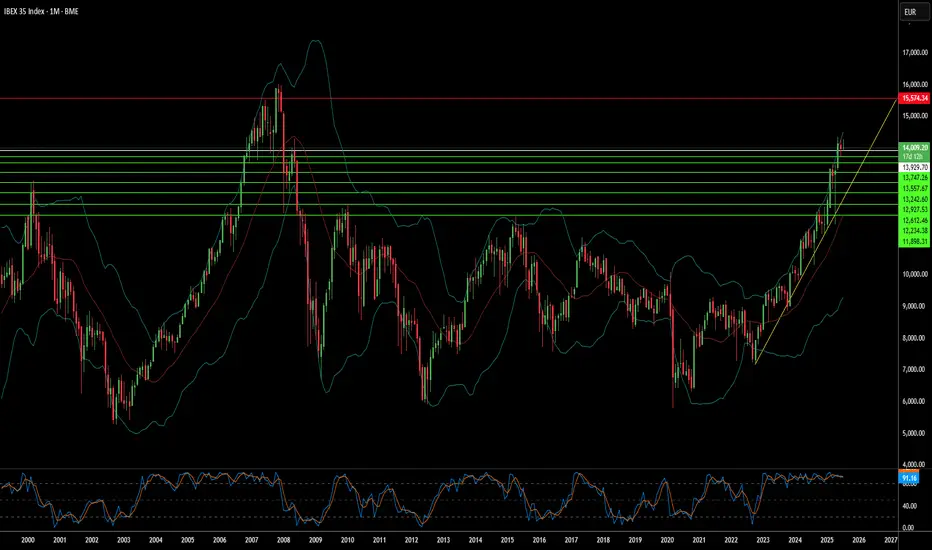
Why Spain's Market Faces a Challenging Horizon?The IBEX 35, Spain's benchmark equity index, navigates a complex landscape. Despite encouraging macroeconomic indicators, including robust GDP growth and declining unemployment, underlying vulnerabilities persist. Political instability forms a significant headwind. A fragmented parliament, ongoing corruption scandals, and the specter of early elections create an environment of legislative gridlock. This uncertainty directly impacts investor confidence and hinders the effective implementation of crucial reforms and budget approvals, contributing to the IBEX 35's underperformance compared to its European counterparts in 2025.
Social tensions further exacerbate the country's domestic challenges. Recent anti-migrant protests, such as those in Torre Pacheco, underscore a societal fragmentation that can deter foreign investment and impact labor dynamics. While immigration is vital for Spain's economic growth, rising anti-immigrant sentiment, potentially exploited by far-right political factions, introduces unpredictability into social cohesion and future policy directions. This confluence of political and social unease creates an unstable backdrop for businesses and investors.
Beyond internal dynamics, global factors add to the pressure. Lingering uncertainties surrounding international trade, including potential US tariffs, pose risks for Spain's export-oriented sectors and its globally exposed corporations. Furthermore, while Spain champions renewable energy, persistently high electricity prices due to domestic policies continue to challenge industrial competitiveness. The historical context of ineffective deployment of significant EU NextGenerationEU funds, hampered by political hurdles, also raises concerns about Spain's long-term growth trajectory and its ability to capitalize on recovery initiatives.
These combined elements suggest a difficult period ahead for the IBEX 35. Sectors sensitive to domestic policy, such as construction, banking, and real estate, face direct exposure to political uncertainty. Moreover, Spain's traditional reliance on tourism and agriculture makes it susceptible to external shocks, including global travel disruptions and climate change impacts like severe droughts. Investors must carefully assess these multifaceted risks, as they are likely to shape the IBEX 35's performance in the near to medium term.
Why This Breakout Feels Like $29K and $48K – Big Moves Ahead?🤔📊 Why This Breakout Feels Like $29K and $48K – Big Moves Ahead? 🚀📈
Hey everyone! It’s Saturday, July 12th , and while the markets take a breather, it’s the perfect moment to zoom out and assess the bigger picture . Are we in for another retail weekend surge?
Let’s break it down 🔍👇
After closely analyzing the charts, one thing becomes clear — this breakout is structurally similar to the previous key breakouts at $29K and $48K. In both historical cases, price surged significantly without immediately retesting the breakout level.
➡️ Back in 2020, price exploded +144% above the yellow level before ever coming back to test it.
➡️ At $48K, a similar move of +49% occurred before signs of exhaustion and a retest emerged.
Fast forward to today: We've just broken above a massive ascending support zone — $114,921–$115K — and the market shows no intention of pulling back yet. This tells us something powerful: Momentum is in control.
💡 According to my technical roadmap, we may not see a retest of $115K anytime soon. Instead, the next target zone lies around $182K–$189K, depending on velocity and sentiment. With halving-to-ATH cycles historically lasting ~550 days, we’re well within that bullish window.
Remember the channel support/last entry right after the Iran-Israel ceasefire on June 23rd? That’s been a defining entry and it’s still playing out beautifully. So we wish for geopolitical stability and peace.
So, while it’s easy to feel left out — don’t short, don’t sulk. This may be our moment to ride the wave long. 🎯📉📈
One Love,
The FXPROFESSOR 💙
Disclosure: I am happy to be part of the Trade Nation's Influencer program and receive a monthly fee for using their TradingView charts in my analysis. Awesome broker, where the trader really comes first! 🌟🤝📈

EURUSD buy zoneEURUSD is holding around levels just below 1,1700.
Tomorrow, U.S. inflation data is expected, which could trigger bigger moves.
The key zone to watch for a reaction is between 1,1591 and 1,1682.
Look for a bounce and potential buying opportunities in that area.
Next resistance levels to keep in mind are 1,1813 and 1,1916!

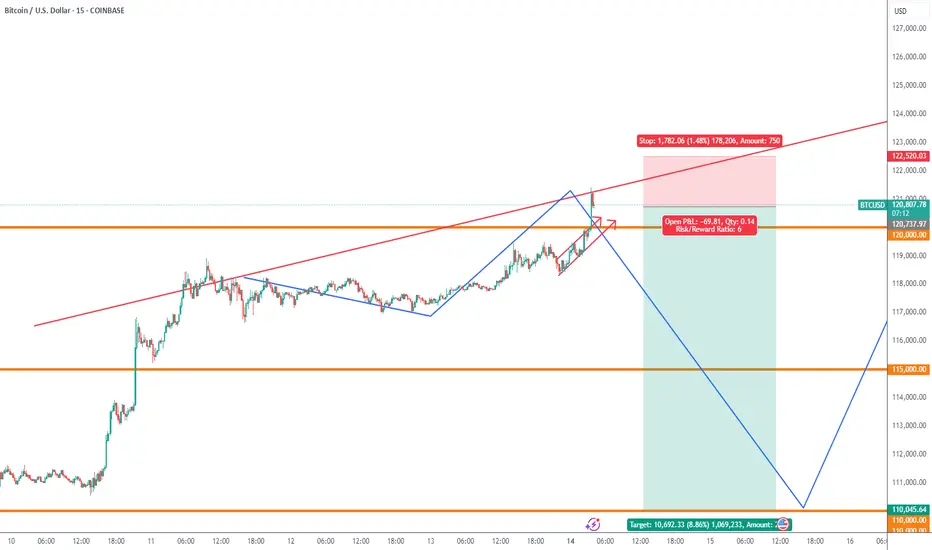
BTCUSDWeekend price pump will fade expecting price to fall back to $110k region before we see a major price move to $130k
XRP just an IdeaI have plotted all these lines early 2025.
Now it approaching the right shoulder as I drew.
Let watch the next move of XRP. ☺️
#do you on research

XAUUSDA short sell but our overal biased is a buy. once we see a sign of weakness to the downside we will definitely close our open trade and focus on entry to the upside.

BTCUSDA short term Long biased although we favor the down side rather than the upside but we are trying to make some entry before we see major price retracement


Gbpjpy long outlookReviewing past price moevembt . Looks like support is holding and can potentially break out of reisistance area and contour moving foaled. Still early… what do you guys think?


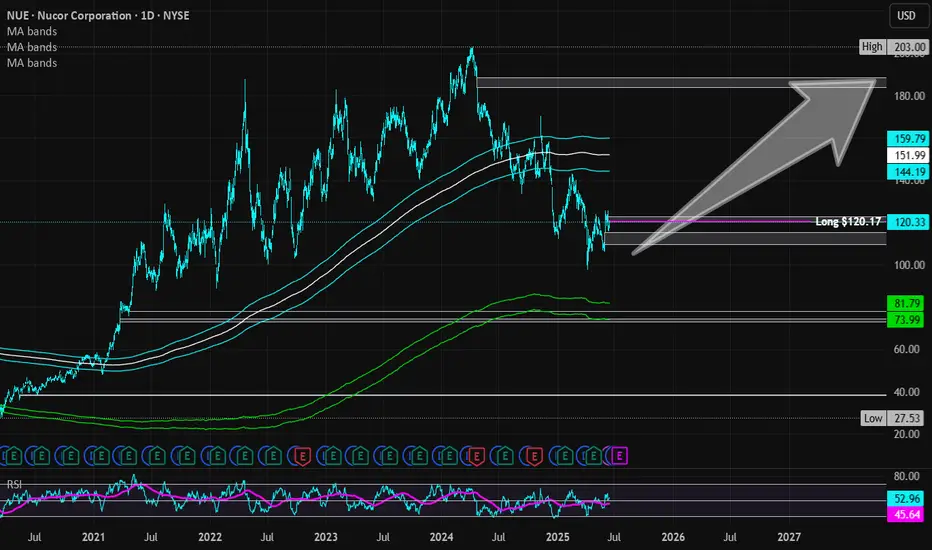
Nucor | NUE | Long at $120.17Nucor NYSE:NUE , a US manufacture of steel and steel products, will likely capitalize on reduced foreign competition as tariffs become reality. The CEO also recently stated that the steelmaker's order backlog is the largest in its history and is increasing prices. So, while there is a potential for short-term downside as tariff "unknowns" are negotiated, the longer-term upside may be there for those who are patient... but time will tell.
Basic Fundamentals:
Current P/E: 21x
Forward P/E: 15-16x
Earnings are forecast to grow 29.6% per year
Projected Revenue in 2025: $32.3 billion
[*} Projected Revenue in 2028: $39.4 billion
Debt-to-Equity: 0.4x (healthy)
Dividend Yield: 1.8%
Technical Analysis:
Riding below the historical simple moving average and there is risk the daily price gap near $109 will close before moving higher. If there is a "crash" in price, $70s is absolutely possible which will be a "steel" if fundamentals do not change.
Targets in 2027:
$142.00 (+18.2%)
$187.00 (+55.6%)
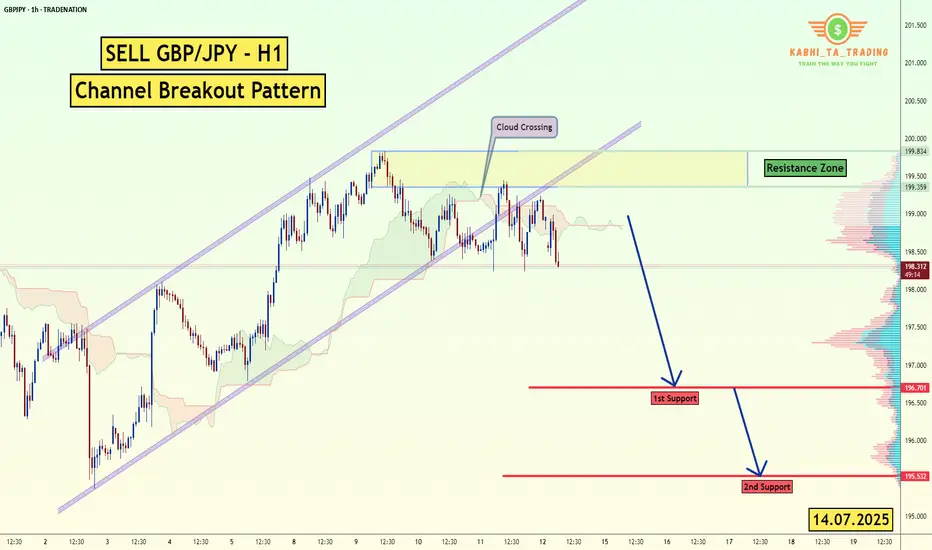
GBP/JPY -H1- Channel Breakout (14.07.2025)The GBP/JPY Pair on the H1 timeframe presents a Potential Selling Opportunity due to a recent Formation of a Channel Breakout Pattern. This suggests a shift in momentum towards the downside in the coming hours.
Possible Short Trade:
Entry: Consider Entering A Short Position around Trendline Of The Pattern.
Target Levels:
1st Support – 196.70
2nd Support – 195.53
🎁 Please hit the like button and
🎁 Leave a comment to support for My Post !
Your likes and comments are incredibly motivating and will encourage me to share more analysis with you.
Best Regards, KABHI_TA_TRADING
Thank you.
Disclosure: I am part of Trade Nation's Influencer program and receive a monthly fee for using their TradingView charts in my analysis.
Daily Analysis- XAUUSD (Monday, 14th July 2024)Bias: No Bias
USD News(Red Folder):
-None
Notes:
- Price created a small gap up
during market open
- No exact bias, small consolidation expected
- Potential BUY/SELL if there's
confirmation on lower timeframe
- Pivot point: 3340, 3400
Disclaimer:
This analysis is from a personal point of view, always conduct on your own research before making any trading decisions as the analysis do not guarantee complete accuracy.

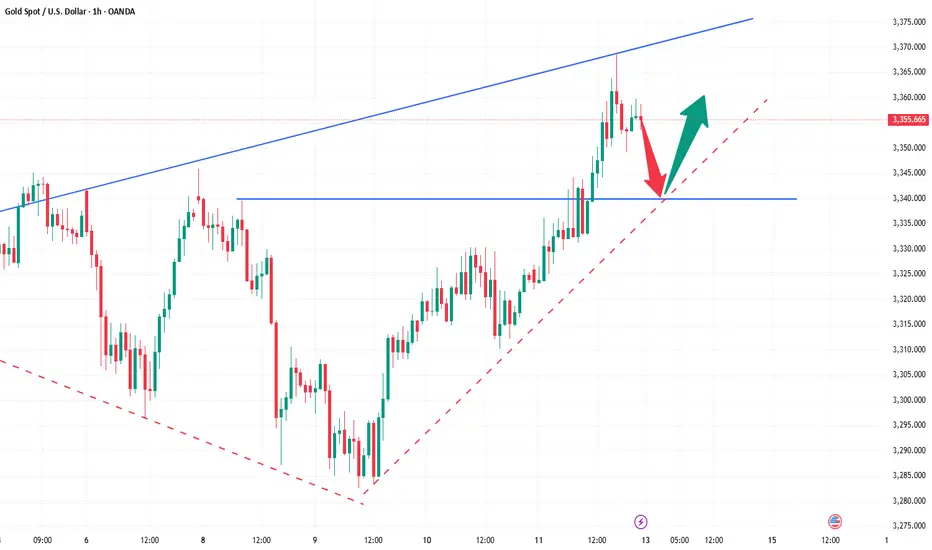
Expecting a slight Pull Back for gold I’m expecting a slight pull back on gold for the first day of trading week as always. A consolidation will always happen first before flushing retails out. 3339-3353 could be a possibility for bulls / long positions continuing higher. Breaking lower by EOD we can expect more bears to come in.
As always my analysis is for reference. Not an advised. Trade with your own due diligence. Risk management is always important for trading. Stay safe. Trade safe.

Gold Market Opens Bullish week 3 July – Eyes on 3380Gold market opens 3rd week July with a strong bullish sentiment across the Asian session , eyeing a potential sweep through 3380. This level could act as a key liquidity zone and set the tone for the next market move. yall should watch for confirmation as price action unfolds. follow for more insights , comment and boost idea

The 3400 mark will be the key for next week!Gold has been up and down this week, and the shock wash has intensified. It bottomed out and rebounded at 3282, and then steadily pulled up. After a slow rise to 3368 on Friday, the retracement was limited, and finally closed at 3355. So can gold be expected to be strong? Is it possible to reach 3400 next week? From the trend point of view, it is too early to say that it will turn strong. 3400 is an insurmountable barrier. Only by breaking through 3400 can we see a stable strong bull. If it is suppressed below 3400, the bulls will not be stable and may fall back at any time. We can only see large range fluctuations. From the overall trend point of view, gold is currently fluctuating widely in the large range of 3250-3400. It is safe to buy below 3300, and it is easy to go up. After all, it is still upward in the long run. Next week, we will focus on the gains and losses of the 3400 mark. It is not recommended to chase the high position directly on Monday. On the one hand, the interruption of the market after the weekend holiday can easily cause discontinuous rise. In addition, after three consecutive positive lines on the daily line, there will either be a negative correction and a fall, or a large positive volume. Combined with the current trend and rhythm of gold, be careful of a high-rise fall, and it is easy to get trapped by chasing long positions at high positions. Don't feel that it will soar as soon as it rises, and the high point of 3500 seems to be within reach; don't feel that it will fall sharply as soon as it falls, and the 3000 mark is not a dream. We should stay away from those who sing long when it rises and sing short when it falls. The direction is not because you see it, so you believe it, but because you believe it, so you see it. There will always be a time when you chase the rise and sell the fall and you will return with nothing.
Moreover, the high point of 3365 has not formed a substantial break and stabilized. On Monday, we still need to focus on the gains and losses of this position, so we need to look at it from two aspects:
1. If it rises directly at the opening, pay attention to the pressure near 3370-3380 and you can go short, and the target is 3350-3340!
2. If the market falls back at the opening, go long around 3340-3330, with the target above the high point of 3360-3368.
DOW JONES-MYM -SELL PREDICTIONThe market has created a new weekly high. Im expecting a short sell off in the upcoming week down into the weekly FVG. Then possible move to the upside.

EURUSD BUY So we have nice weekly fvg below along with a strong pivot point we could possibly see price reach this level before the push to the upside. I’m pretty confident we will have a strong push to the upside due to the macroeconomics and positioning of key players as they are still very bullish on the euro as we still creating higher highs consistently. A lot of people are in sells right now so we could see them taken out before the move to the downside they the EurUsd buy will be in play .

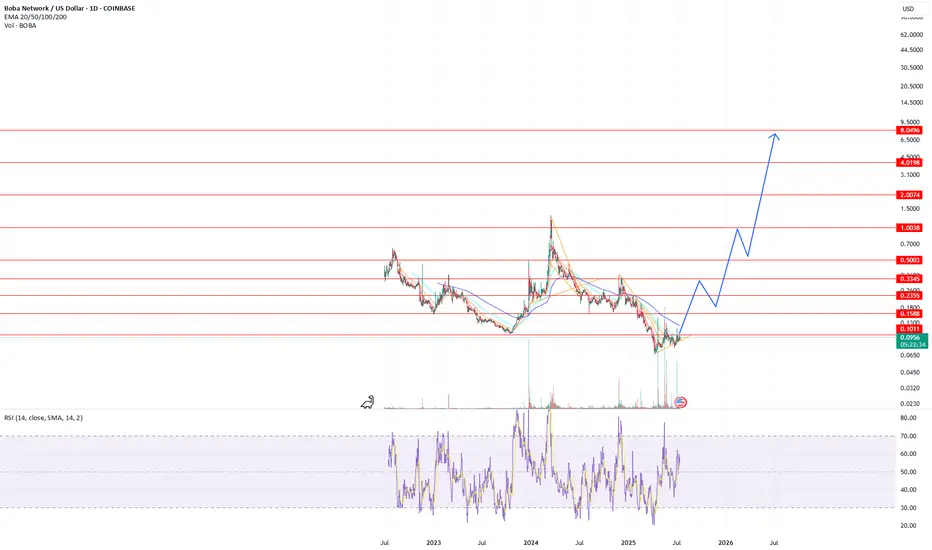
BOBA NETWORK EXPLOSION TO $3+!!! ($BOBA)Boba Network is a Ethereum Layer 2 Optimistic Rollup utilizing the OP stack and part of the Superchain Ecosystem. Its considered one of the original L2 rollups along with Arbitrum and Optimism. There are now efforts being made to upgrade to ZK utilizing Succinct.
Whats special is that Boba Network is powered by HybridCompute technology that brings the power of Web2 on-chain, with smarter smart contracts that allow visionary developers to leverage off-chain compute and real-world data to build hybrid dapps that connect people to the future of blockchain applications.
The token is trading on major exchanges like Coinbase, with potential listing on Binance. There are rumors about a partnership with Pi Network, along with TradFi and Web2 companies for Real-World Assets (RWA)
Its original funding was $45 million ($3 x 15 million BOBA) for a fully diluted value of $1.5 billion. It recently raised another $75 million for further development.
Tokens that were locked in the FTX bankruptcy proceedings have now been returned to the treasury. No one else has received tokens from FTX.
The token supply now is fully diluted, which is very rare for an L2 with VC funding.
The price currently sits at approx. $0.10 for a market cap of $50 million.
Last year, the price went from $0.10 to $1.30 within a matter of weeks.
The all-time high is $8 for a market cap of $4 billion.
Simple math says BOBA is a hidden gem and can easily make $3+ for 30x once the altcoin markets, especially ETH and L2s, explode.
Once it breaks out of the ascending triangle at this level, there is very weak resistance until $1 and $3 and $8.