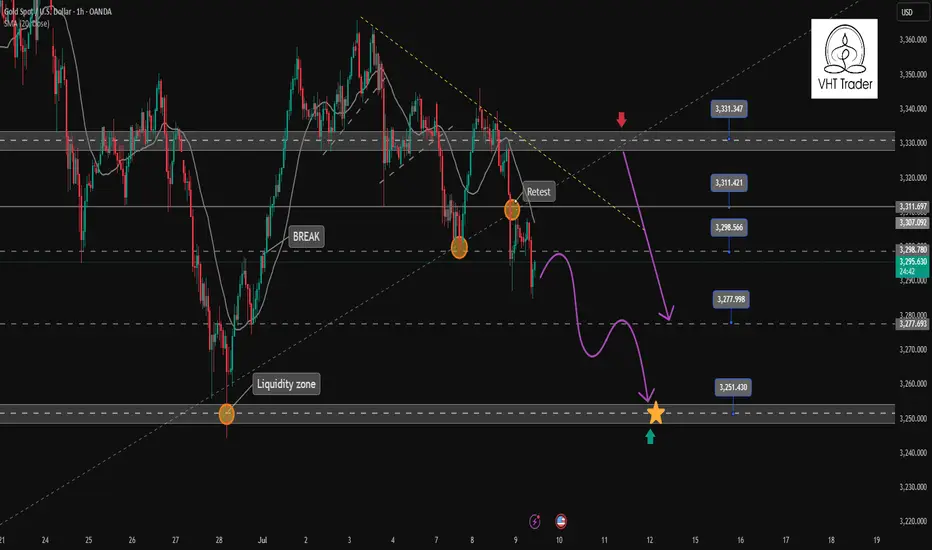
Gold continues downtrend today✏️#GOLD view
Yesterday's D1 candle confirmed the decline in gold prices when the selling pressure returned below the liquidity candle wick. The extension of the downtrend will continue today.
Yesterday's strong support zone 3297 has become today's resistance zone, this is the SELL point today when there is confirmation from the selling side in this zone.
3310 The confluence resistance zone between the trendline and the US Session Resistance is noted in today's SELL strategy. The previous SELL Target 3352 orders pay attention to the reaction at 3377.
📈Key Level
SUPPORT 3277-3250
RESISTANCE 3297-3310-3328
SELL Trigger: Price cannot break 3297
SELL DCA Trigger: Break 3276
Target: 3250
BUY Trigger:PriceTrading above 3276
Leave your comments on the idea. I am happy to read your views.
Fundamental Analysis
Where Can Bitcoin Go? Part 8 –(MASSIVE 'Resistance or Breakout')🚀📊 Where Can Bitcoin Go? Part 8 – The Final Test is Near! 🔥🔍
Welcome to Part 8 of “Where Can Bitcoin Go?” – the update of this long-running series. Since mid-2023, not much has changed in the structure. That’s the power of solid technical analysis – levels don’t lie.
🟨 The Setup
Bitcoin is now approaching a third test of a major structural resistance. If you’ve followed my 1-2-3 strategy, you know this is where decisions are made:
✅ Test 1: Rejection
✅ Test 2: Rejection
⏳ Test 3: Now pending… the TERMINAL and DECISIVE 'Breakout or Rejection', and this will change everything.
But here’s the deeper layer:
We’re not just testing one sequence. We now have two separate sets of 1-2 rejections —
🔹 One set from 2021 (the Red 1 and 2)
🔹 And a recent one in 2025 (the white 1 and 2)
This upcoming test is the third rejection attempt on both timeframes, making it a rare and extremely significant technical moment.
📐 Price is now near a critical ascending trendline around $115K–$116K, which has been the gatekeeper to parabolic moves in previous cycles.
🔄 Based on historical halving cycles:
548 days post-halving in 2016 → ATH 2017
565 days post-halving in 2020 → ATH 2021
Halving #4 was in April 2024 → 👀 Could this point to a new ATH by end of 2025?
📊 Probabilities
🔹 83% chance we see the third test before year-end
🔹 57% chance of breakout
🔻 43% chance of rejection
⚠️ And here’s the reality check:
If we see that breakout — the market unleashes itself. We’re talking major pumps, potential follow-through moves, and price discovery into untouched zones like $188K, $197K, and beyond.
But... if we get rejected, it won’t be pretty. We could retest major levels like $66K or worse, and lose momentum that took years to build.
And unfortunately — this isn’t like 18K, or 40K, or even the 79K retest.
Things are much more complicated now.
The sentiment, the structure, the risk profile — they’ve all evolved. We cannot afford to have the same blind bullishness we had in those earlier phases. This is a mature part of the cycle, and it demands discipline over emotion.
💬 What’s your take?
Will Bitcoin finally break through?
Is this just another fakeout in disguise?
Are you feeling this same tension in the market?
Let’s talk structure. Let’s talk price. Let’s talk reality.
One Love,
The FXPROFESSOR 💙
Disclosure: I am happy to be part of the Trade Nation's Influencer program and receive a monthly fee for using their TradingView charts in my analysis. Awesome broker, where the trader really comes first! 🌟🤝📈

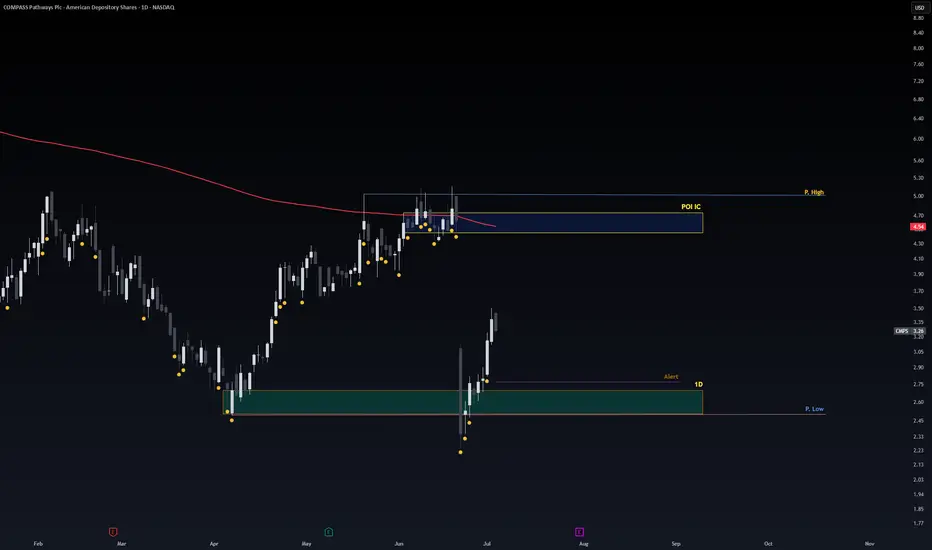
Safe Entry Zone CMPSStock Recovering from steep drop from bad news (which we don't care).
Blue Zone is Sell Zone.
Green Zone is Buy Zone.
since stock already rallied. its Risky to follow we wait price to re-test Green Zone.
Also My Beloved CAthie Wood BEST INVESTOR All Time (based on statics better than Warren Buffet Entire Histroy) Is BUYING!
Note: 1- Potentional of Strong Buying Zone:
We have two scenarios must happen at The Mentioned Zone:
Scenarios One: strong buying volume with reversal Candle.
Scenarios Two: Fake Break-Out of The Buying Zone.
Both indicate buyers stepping in strongly. NEVER Join in unless one showed up.
2- How to Buy Stock:
On 1H TF when Marubozu/Doji Candle show up which indicate strong buyers stepping-in.
Buy on 0.5 Fibo Level of the Marubozu/Doji Candle, because price will always and always re-test the
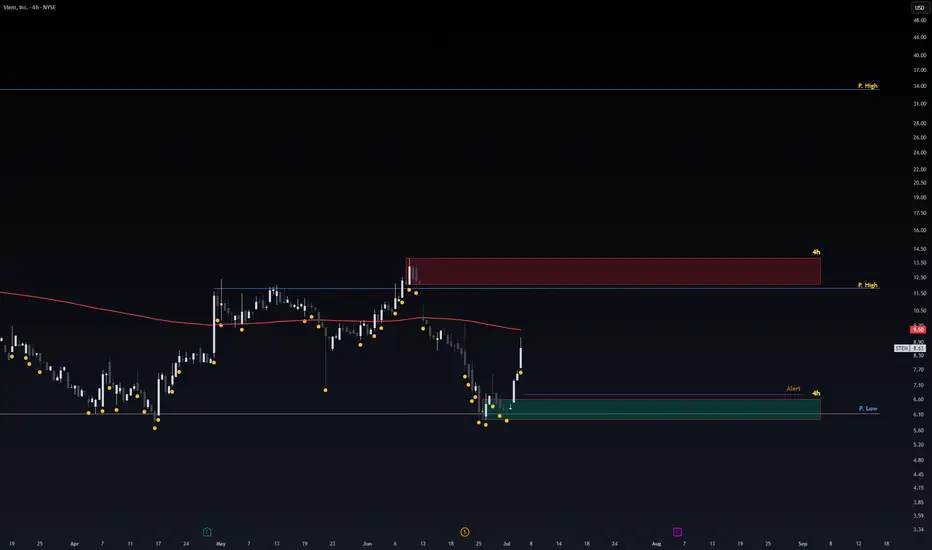
Safe Entry STEMPrice movement consolidating.
Safe Entry Green Zone.
Red Zone is Sell Zone. better watch out for any selling pressure.
P.high Lines Are Good Resitances.
Final Target 33.45$ price level.
better to wait stock and not follow.
Note: 1- Potentional of Strong Buying Zone:
We have two scenarios must happen at The Mentioned Zone:
Scenarios One: strong buying volume with reversal Candle.
Scenarios Two: Fake Break-Out of The Buying Zone.
Both indicate buyers stepping in strongly. NEVER Join in unless one showed up.
2- How to Buy Stock:
On 1H TF when Marubozu/Doji Candle show up which indicate strong buyers stepping-in.
Buy on 0.5 Fibo Level of the Marubozu/Doji Candle, because price will always and always re-test the
Safe Entry CNSNote: Lower TF to 1h or 4h to see better details.
Recently Trump lift chips design prohibition to be sent to china. (Positive to CDNS)
Stock Obvious and clearly at major resistance with such news it expected to open Gap Up.
following the stock would be mistake unless stock open in pre-market with price level similar to close.
better to wait stock to open gap up. Re-test the major resistance.
that would be major support level and safe entry for price to go higher.
Note: 1- Potentional of Strong Buying Zone:
We have two scenarios must happen at The Mentioned Zone:
Scenarios One: strong buying volume with reversal Candle.
Scenarios Two: Fake Break-Out of The Buying Zone.
Both indicate buyers stepping in strongly. NEVER Join in unless one showed up.
2- How to Buy Stock:
On 1H TF when Marubozu/Doji Candle show up which indicate strong buyers stepping-in.
Buy on 0.5 Fibo Level of the Marubozu/Doji Candle, because price will always and always re-test the

Safe Entry OracleStock In Up-Movement.
P.High (Previous High) is Safe Entry.
Note: 1- Potentional of Strong Buying Zone:
We have two scenarios must happen at The Mentioned Zone:
Scenarios One: strong buying volume with reversal Candle.
Scenarios Two: Fake Break-Out of The Buying Zone.
Both indicate buyers stepping in strongly. NEVER Join in unless one showed up.
2- How to Buy Stock (safe way):
On 1H TF when Marubozu/Doji Candle show up which indicate strong buyers stepping-in.
Buy on 0.5 Fibo Level of the Marubozu/Doji Candle, because price will always and always re-test the

Safe Entry Zone CHWYCurrently stock in Ranging Movement.
1h Green Zone is buying Zone.
1h Red Zone is selling Zone.
Price ranging with strong potional of Strong Up-Movement.
Note: 1- Potentional of Strong Buying Zone:
We have two scenarios must happen at The Mentioned Zone:
Scenarios One: strong buying volume with reversal Candle.
Scenarios Two: Fake Break-Out of The Buying Zone.
Both indicate buyers stepping in strongly. NEVER Join in unless one showed up.
2- How to Buy Stock:
On 1H TF when Marubozu/PinBar Candle show up which indicate strong buyers stepping-in.
Buy on 0.5 Fibo Level of the Marubozu Candle, because price will always and always re-test the imbalance.

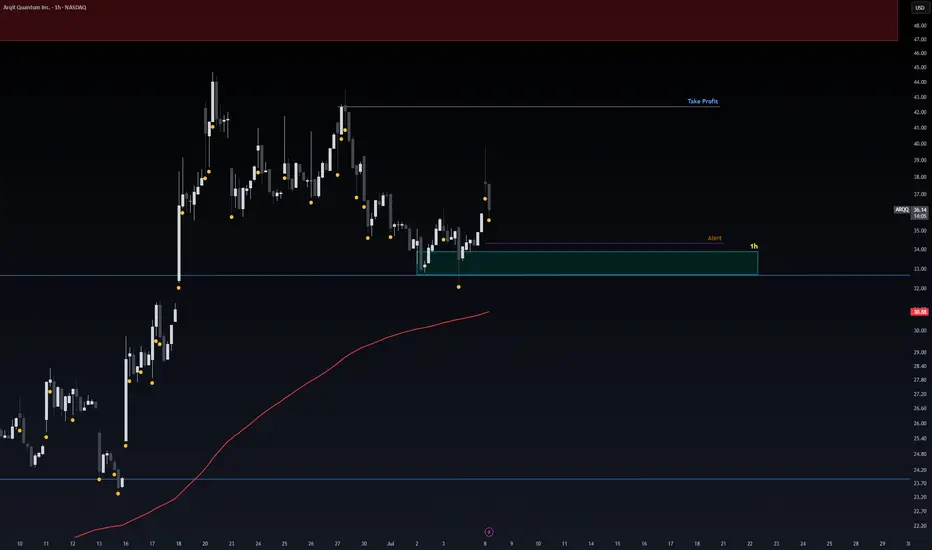
Safe Entry Zone ARQQStock in Up Movement.
1H Green Zone is Safe Entry.
Note: 1- Potentional of Strong Buying Zone:
We have two scenarios must happen at The Mentioned Zone:
Scenarios One: strong buying volume with reversal Candle.
Scenarios Two: Fake Break-Out of The Buying Zone.
Both indicate buyers stepping in strongly. NEVER Join in unless one showed up.
2- How to Buy Stock (safe way):
On 1H TF when Marubozu/Doji Candle show up which indicate strong buyers stepping-in.
Buy on 0.5 Fibo Level of the Marubozu/Doji Candle, because price will always and always re-test the
SONATASOFTWARE techno-funda analysisSonata Software Ltd. is a global IT services and solutions company focused on digital transformation, cloud enablement, and platform modernization. It caters to sectors like retail, BFSI, travel, and manufacturing, with deep capabilities in Microsoft ecosystem technologies. The stock is currently trading at ₹509.35 and is forming a base after a broad retracement from previous highs.
Sonata Software Ltd. – FY22–FY25 Snapshot
Sales – ₹5,372 Cr → ₹6,214 Cr → ₹7,465 Cr → ₹8,155 Cr – Consistent revenue expansion led by digital and cloud
Net Profit – ₹410 Cr → ₹487 Cr → ₹548 Cr → ₹618 Cr – Margin stability despite macro cost pressures
Company Order Book – Moderate → Moderate → Strong → Strong – Strong deal pipeline in U.S. and Europe Dividend Yield (%) – 1.23% → 1.31% → 1.40% → 1.40% – Fair yield, supports total shareholder return
Operating Performance – Moderate → Moderate → Strong → Strong – Cloud and IP-led growth improving
Equity Capital – ₹140.23 Cr (constant) – Efficient capital structure
Total Debt – ₹195 Cr → ₹180 Cr → ₹165 Cr → ₹155 Cr – Low and declining, comfortable leverage
Total Liabilities – ₹2,030 Cr → ₹2,150 Cr → ₹2,270 Cr → ₹2,385 Cr – Growing with operating scale
Fixed Assets – ₹465 Cr → ₹480 Cr → ₹505 Cr → ₹528 Cr – Gradual tech and infra investment
Latest Highlights
FY25 net profit rose 12.8% YoY to ₹618 Cr; revenue up 9.2% to ₹8,155 Cr
EPS: ₹44.07 | EBITDA Margin: 17.4% | Net Margin: 7.58%
Return on Equity: 21.79% | Return on Assets: 10.96%
Promoter holding: 34.55% | Dividend Yield: 1.40%
Strong performance in cloud migration, managed services, and proprietary platform IPs
North America remains key growth driver, with robust enterprise digital transformation budgets
Technical Snapshot Sonata Software is trading at ₹509.35 with an RSI of 44.70, signaling neutral to mildly bearish sentiment. After correcting from the recent top, the stock has found support around ₹509.35 and earlier at ₹424.15 and ₹366.45. Price is coiling near the base of a structural channel with rebound potential. If sentiment turns, bullish retracement targets lie at ₹787.00, ₹923.05, and ₹1,096.40 in the medium term.
Business Growth Verdict Yes, Sonata Software is scaling steadily with a solid IP-led tech strategy
Margins are stable with strong ROE and limited debt exposure
Order book strength and platform-led solutions support future visibility
Capex and infra investments remain conservative and purposeful
Final Investment Verdict Sonata Software offers a mature growth narrative in the mid-cap IT services space. Its differentiated approach in digital engineering, Microsoft partnerships, and repeat global clientele provide high revenue stickiness. While broader IT demand is moderating, Sonata’s platform-led margin resilience and capital discipline stand out. The current technical base and improving order visibility make it a strong candidate for medium-term accumulation with a focus on operational consistency and yield support.

Gold lures shorts, mainly depending on the rebound.On Monday, the gold market rebounded. The root cause was that Trump sent tariff letters to 14 countries at one time. Even allies such as Japan and South Korea were not spared and were subject to high tariffs of 25% to 40%. This "extreme pressure" trade method instantly ignited the market's risk aversion sentiment. Funds poured into gold, pushing up gold prices. The market quickly saw through the "routine". On Tuesday, Trump extended the tariff deadline from July 9 to August 1. This delay was seen as a signal of "surrendering" under trade pressure, and trade tensions were eased. The safe-haven demand dissipated like a receding tide, and gold was sold off violently, plummeting by $35 in a single day, a drop of more than 1%, and the lowest fell to $3,287.2 per ounce.
On Tuesday, the price of gold showed a trend of rising and falling. It reached a high of 3245 in the morning and then gradually fell. It fell to 3287 and then stopped falling and rebounded. As it failed to break through the key resistance level of 3345 and the price continued to be unable to stand firm on the middle track, the bulls' rebound momentum was insufficient. Yesterday's daily line closed with a large Yin line in the engulfing pattern. This K-line combination indicates that the gold price may continue to fall today. The focus below is on the support strength near the lower track 3280. The upper resistance level needs to pay attention to the 3320-3330 range. Today's daily closing is crucial. If the real big Yin line continues to close, it may drive the Bollinger Band to open downward and further open up the downward space; if the closing can stand above 3330, the short-term downward trend may end and the market is expected to restart the rise. From the weekly perspective, the gold price showed an obvious oscillation pattern this week. After rising on Monday, it fell back on Tuesday. The bulls and bears fought fiercely but failed to gain a decisive advantage. Although the current market is weak, the price is close to the important support area. In terms of operations, it is recommended that under the premise of controlling risks, you can now pay attention to the opportunities to buy on dips in the 3295-3285 area.

Live trade: AUD JPY long Entry 95.71
Nothing has happened to alter my 'risk in bias'. A, I've been waiting for a 'nice but of support' to place a stop loss behind. And I'm comfortable with the 1hr swings that have formed.
It's a 20 pip stop loss with 30 pip profit target.
The risk to the trade is a fresh bout of negative sentiment

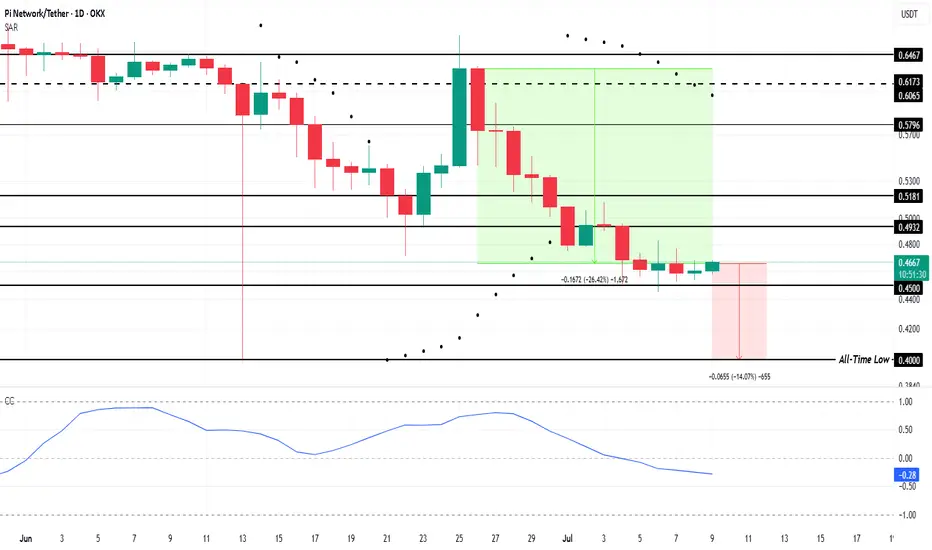
Pi Coin Decouples from Bitcoin, Pushes Price To All-Time LowOKX:PIUSDT is currently priced at $0.465, just above the critical support level of $0.450. With the altcoin hovering only 14% above its all-time low of $0.400 , it faces significant downside risk.
This price range puts Pi Coin in a precarious position, as a break below $0.450 could trigger a further decline. In the past two weeks, OKX:PIUSDT has already suffered a 26.4% drop , highlighting its ongoing struggle to regain momentum.
OKX:PIUSDT has experienced a dramatic shift in its correlation with BINANCE:BTCUSDT , now sitting at a negative 0.27 . This negative correlation means that Pi Coin is moving in the opposite direction to Bitcoin. In simpler terms, as Bitcoin rises, OKX:PIUSDT continues to struggle.
The negative correlation with Bitcoin suggests that Pi Coin will not capitalize on the positive trends seen in the wider cryptocurrency market. Instead, OKX:PIUSDT faces the risk of further decline.
Given these indicators, it seems likely that OKX:PIUSDT will fall to its all-time low of $0.400 . The fear of further losses is likely to prompt additional selling, which could accelerate the price decline. With the market sentiment weighed down by Pi Coin’s disconnection from Bitcoin, the path to recovery looks increasingly challenging.
However, there is still hope for OKX:PIUSDT if investors show restraint. If Pi Coin manages to hold the $0.450 support level, it could bounce back. A move past the $0.493 resistance level would be a positive sign , potentially pushing the price to $0.518. Such a recovery would invalidate the bearish thesis and offer a fresh outlook for the altcoin.
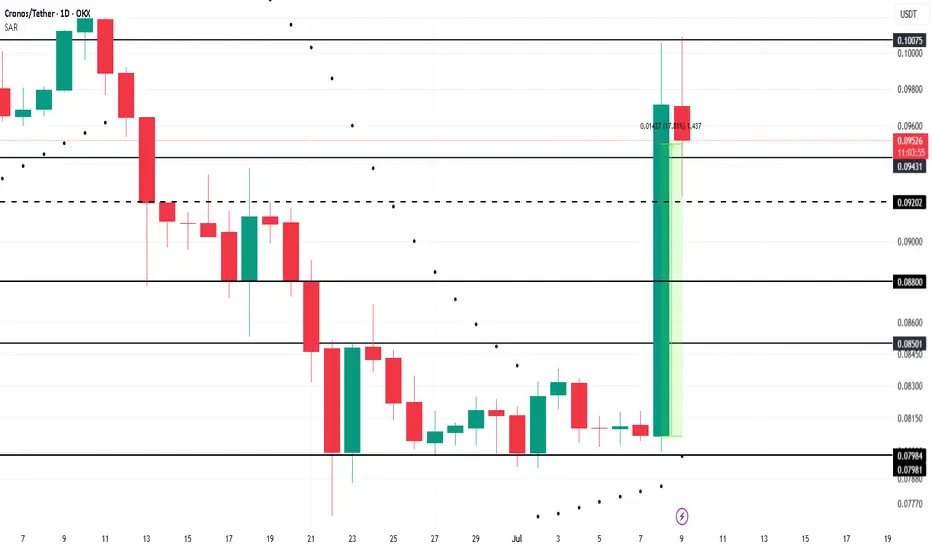
Cronos Rallies 18% After Truth Social Files for Blue-Chip ETFOKX:CROUSDT is a leading candidate for a Binance listing this month, following the proposed Crypto Blue-Chip ETF filed by Truth Social with the SEC. The fund includes 70% Bitcoin, 15% Ethereum, 8% Solana, 5% Cronos, and 2% XRP , positioning Cronos as a key asset in the fund.
Of the tokens in the proposed fund, only Cronos (CRO) is not currently listed on Binance. If the SEC approves the Crypto Blue-Chip ETF, Binance could fast-track the listing of Cronos . This move would likely draw more liquidity and investor interest toward CRO, fueling its price growth.
OKX:CROUSDT price surged by 17.8% over the last 24 hours, signaling strong momentum. If the ETF listing is approved and Binance acts swiftly, CRO could break through key resistance levels, potentially surpassing $0.1007. This upward movement would benefit investors, continuing the positive trend for the altcoin.
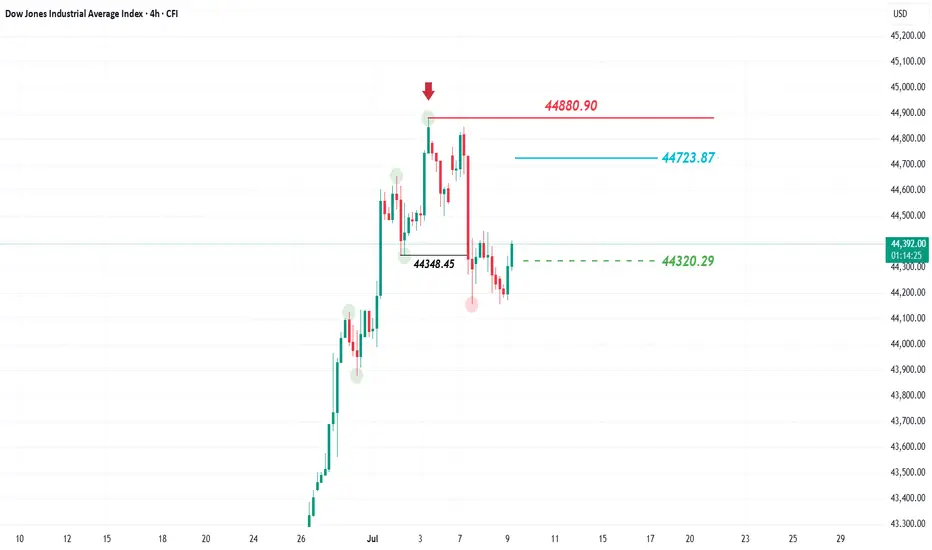
Dow Jones takes a different path!US President Donald Trump announced a postponement of the suspension of tariffs from July 9 to August 1, stressing that this deadline is final and will not be delayed again.
This decision has left the markets cautious, particularly US indices, but the Dow Jones Index has taken a different route compared to the S&P 500 and Nasdaq, which are generally trending upwards. Meanwhile, the Dow has shifted its direction from bullish to bearish.
On Monday, July 7 2025, the Dow Jones fell and recorded a lower low at 44,348.45, below its previous higher low. This signals a trend reversal on the 4-hour chart from bullish to bearish, a trend it had maintained for the past few weeks.
What’s the next expected move?
The current rise is considered a corrective move aiming to retest the 44,723.87 level, before likely dropping again to target 44,320.29. The bearish outlook would be invalidated if the price rises above 44,880.90 and closes a 4-hour candle above
Report - 9 jully, 2025Macro & Geopolitical Overview
Trump’s Tariff Threats vs Market Optimism
Despite President Trump’s insistence that sweeping tariffs will start August 1 (with no extensions), markets have demonstrated remarkable resilience. Wall Street appears to view these threats as a continuation of negotiation tactics rather than fixed policy.
The S&P 500 is up ~6% YTD, trading close to record highs, underpinned by robust corporate fundamentals and expectations of looser monetary policy.
Banks including Goldman Sachs, Bank of America, JPMorgan, Deutsche Bank, Citigroup, and Barclays have raised their S&P 500 forecasts, projecting additional 6–11% upside over the next 12 months.
Treasury Secretary Scott Bessent claims tariffs could yield $300bn in revenue this year, with $100bn already collected.
Market Read: Consensus suggests that repeated tariff postponements have desensitized investors, with strategists highlighting the continued strength in mega-cap tech and broader earnings momentum as outweighing trade policy risks.
EU Seeks Temporary Trade Deal
The EU is negotiating a provisional deal to maintain tariffs at 10% and avoid full-scale retaliation. German finance officials have warned of potential countermeasures if no fair resolution is reached.
Implications: A temporary truce could reduce volatility in European equities and alleviate pressure on the euro. Eurozone markets already showed optimism, with the Stoxx 600 up 0.3% and DAX and CAC 40 both gaining 0.6%.
Ukraine’s Financing Strains Intensify
The EU is urgently seeking to fill Ukraine’s projected $19bn budget gap for 2025 as ceasefire prospects diminish. Options under discussion include front-loading loans from G7 support packages and leveraging frozen Russian assets.
Trump’s promise to resume defensive arms deliveries provides a partial relief but does not fully address fiscal shortfalls.
EU leadership aims to finalize support plans before winter to ensure operational stability in Ukraine’s defense and civil services.
Strategic View: Ukraine’s funding gap underscores ongoing geopolitical risk in Eastern Europe, which could impact energy markets, defense equities, and the euro.
Port of Rotterdam Defense Preparations
Europe’s largest port is preparing for potential conflict with Russia by designating military cargo spaces and coordinating with Antwerp. This forms part of an EU-wide rearmament and strategic stockpiling effort.
Proposals include stockpiling critical raw materials (copper, lithium, graphite) and essential supplies.
Supports broader EU resilience efforts to reduce dependency on imports from China and Russia.
Implications: Reinforces the structural bullish thesis on critical raw materials and European defense contractors.
Corporate & Sector Updates
Wall Street Earnings Sentiment Turning Positive
Despite tariff noise, optimism around earnings season is rising.
Big banks expect solid Q2 results supported by labor market strength and easing inflation trends.
Analysts highlight that U.S. corporates have maintained guidance despite higher input costs.
Investment Implication: Reinforces overweight positioning in U.S. large caps, especially in tech and industrials with strong balance sheets.
Former UK PM Sunak Joins Goldman Sachs
Rishi Sunak rejoining Goldman Sachs as senior adviser highlights geopolitical expertise premium at major financial institutions.
Expected to advise on economic and geopolitical strategy while maintaining parliamentary role.
His compensation will support charitable projects, minimizing domestic political fallout.
BCG’s Gaza Fallout
BCG’s involvement in controversial Gaza post-war relocation plans has led Save the Children to cut ties after 20 years, severely damaging the firm's reputation.
Implications: Could impact BCG’s client relationships and broader consulting industry reputational risks, especially in ESG-conscious markets.
BP and Shell Return to Libya
BP and Shell have signed MoUs to explore and redevelop major Libyan oil fields, signaling re-engagement despite ongoing political instability.
Libya aims to raise output from 1.3m to 2m b/d.
These moves underscore Western energy majors' renewed focus on fossil fuels amid investor pressure for returns.
Investment View: Supports medium-term oil production growth; bullish for European oil majors despite ESG headwinds.
Asia & EM Updates
China’s Overcapacity and Deflation Concerns
China criticized local firms and governments for excessive price competition (neijuan), which has entrenched factory gate deflation for 33 consecutive months.
Beijing is signaling potential “supply-side reforms” to manage capacity and stabilize prices.
Overcapacity concerns extend to green sectors (solar, EVs), threatening global price dynamics.
Implications: May support global industrial metals prices if successful. However, near-term risks for global trade tensions remain elevated.
Southeast Asia Tariff Wall
Trump threatens 25–40% tariffs on Cambodia, Indonesia, Laos, Malaysia, and Thailand to counter Chinese transshipment practices.
Vietnam accepted a 20% base tariff, rising to 40% for transshipped goods.
Analysts predict higher production costs and consumer prices, potentially slowing ASEAN manufacturing relocation trends.
Strategic View: Increases risk premium on regional supply chains and may provide a tailwind for nearshoring/U.S. manufacturing.
Brics Pushback and De-dollarization Drive
Brics leaders sharply criticized Trump’s new 10% "anti-Brics" tariff threat. The bloc reaffirmed its commitment to reduce USD dependence and reform global financial governance structures.
Market Lens: Accelerated shift toward local currency trade settlements could support alternative reserve currencies and precious metals.
Alternative Assets and Innovation
Tokenized Treasury Funds Surge
Crypto traders and institutions are pivoting to tokenized Treasury and money market funds (assets up 80% YTD to $7.4bn) as an alternative to stablecoins.
Advantages: yield generation, rapid blockchain-based settlement, and new collateral options.
BlackRock, Franklin Templeton, and Janus Henderson products seeing robust inflows.
Implications: Bullish for blockchain infrastructure and tokenization service providers. Early-stage adoption curve but strong growth potential.
Sector Themes
Private Equity (PE): U.S. public universities are increasing PE allocations (targeting up to 30%) despite valuation and exit risks. Signals belief in long-term outperformance vs. muted public equity expectations.
Agriculture & EU Budget: CAP subsidies to farmers remain protected despite budget consolidation, driven by strong lobbying. Confirms ongoing policy support for European agricultural income stability.
Energy Transition & Defense: EU budget and port strategies reflect dual focus on green resilience and military preparedness, providing structural support to both ESG and defense-linked investments.
Markets Summary & Outlook
S&P 500 +6% Near all-time highs, supported by earnings optimism.
Euro Stoxx 600 +0.3% EU trade optimism offsetting geopolitical tensions.
DAX +0.6% Strong industrials rebound; trade negotiations key.
FTSE 100 +0.5% Supported by commodity strength and oil majors.
Dollar Index: +0.2%, moderate safe haven demand.
US 10Y yield: ~4.63%, reflecting ongoing macro uncertainty and strong U.S. data.
Gold: Supported by Brics de-dollarization narrative and geopolitical hedging.

GOLD SELL M15 XAU/USD 15-Min Chart Analysis – July 9, 2025
The chart shows that Gold is currently in a bearish structure with multiple Breaks of Structure (BOS) and Change of Character (CHoCH), indicating a potential continuation to the downside.
Current Price: 3,289.710
Resistance Zone: 3,294 – 3,302 (marked in red)
Equal High (EQH): Formed inside the purple supply zone, indicating liquidity above
Supply Zone: Marked in red/purple area
Weak Low: Identified near the 3,284 level
Target Level: 3,279 (marked in blue with “TARGET 3279” tag)
Stop Loss (SL): 3,302 (above the supply zone)
Strategy:
Expecting a minor pullback toward the supply zone (purple area)
Price is likely to reject from this zone and continue bearish
Final bearish target is 3,279, with possible extension if the weak low is broken

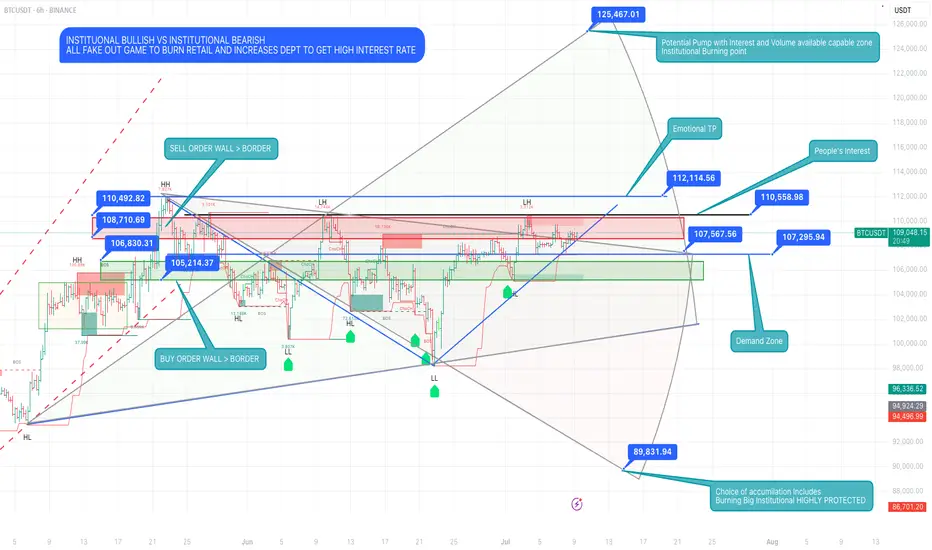
The Whale’s Blueprint: Read It Before It Happens🧠 The Real Game
Institutional Bullish vs Institutional Bearish — It Was Never About Direction.
This chart isn’t about setups.
It’s a blueprint of manipulation, a battlefield map where:
• Retail gets trapped at emotional highs
• Liquidity gets swept in layers
• Institutions reload in silence
• And the price becomes the puppet, not the player
🔺 Top Red Zones (106K–112K):
These aren’t resistance. They’re execution zones for sell walls, fake breakouts, and late long liquidations.
🔻 Green Demand Zones (105K & Below):
Not support. They’re reaction chambers — where whales absorb panic and retail exits in fear.
💥 125K is not a fantasy. It’s a controlled explosion waiting to happen —
But only if the trap is set right and the fuel (volume + interest) loads in.
🧱 Real accumulation doesn’t happen in comfort.
It happens in the shadows, at the edges of fear.
This isn’t price action.
This is power action.
⸻
“Most trade the surface.
Snipers wait beneath it…
and strike before the story reveals itself.”
#BTCUSDT #LiquidityGame #WhaleTrap #InstitutionalZones #SniperMindset #KaizenMethod #TheRealGame
Big day for xauusd (gold)today fed (fomc ) will change the game , so i provide the level on chart. please check that levels . chart say #xauusd touch the level 3264 on negative news that level for buy and positive news for #gold 3296 and 3307 level and next t day 3328 and 3343 . so all thing on fed sir. and i am going for buy . thanks

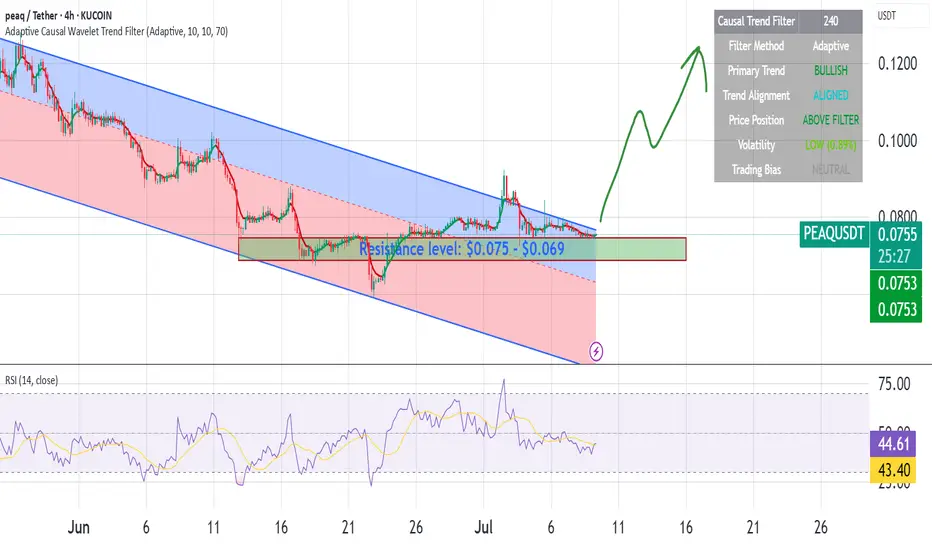
PEAQ TA: Bullish Breakout Above Key ResistanceSymbol: PEAQUSDT
Timeframe: 4H
Current Price: $0.0753
Date: July 9, 2025
CRYPTO:PEAQUSD has successfully broken above the critical resistance zone of $0.069-$0.075, marking this level a strong resistance where sellers are exhausted, as prices have been above this level for over 2 weeks.
Multiple momentum indicators confirm bullish sentiment, while the peaq network continues to deliver key milestones, including the Machine Economy Free Zone in the UAE, MachineX (DEX) and new listings (Kraken).
Technical Analysis
Breakout Confirmed: Clean break above $0.075 resistance with volume confirmation.
Previous Range: Extended consolidation between $0.069-$0.075 for several weeks.
Current Structure: Higher highs and higher lows pattern starts emerging.
Support Levels: $0.069 (previous resistance now support), $0.060 (secondary support).
Bears seem exhausted.
Key Technical Indicators
Adaptive Causal Trend Filter:
Primary trend: BULLISH
Trend alignment: Strong
Trading bias: STRONG BULLISH
Volatility: Low
EVAR Position Sizing:
Current reading: 2.5555 (positive momentum)
Risk level: Medium
The dramatic green spike indicates significant buying pressure and momentum shift
Tsallis Entropy Risk Management:
Risk score: 41.5 (Medium)
Market entropy levels stable
Risk-adjusted position sizing suggests 6.77% allocation appropriate (positive sign)
Fundamental Backdrop
PEAQ operates in the rapidly expanding Decentralized Physical Infrastructure Networks (DePIN) space, which has seen explosive growth in 2025. Key fundamental drivers of the last 3 months include:
Launched Machine Economy Free Zone in UAE
Kraken Listed PEAQ for trading
Over the Reality Partnership to unite DePIN ecosystems
SkyX and iGAM3 Integrated for AI-powered weather intelligence
Lucid Labs Launched $PEAQ VEO for visibility and engagement
Alpha AI, Over the Reality chose to build on Peaq, expanding the ecosystem
MachineX - peaq DEX is live
Over 5 million addresses are now live on peaq (machines and humans)
Partnerhip with CRYPTO:AUKIUSD
Tokenomics:
Limited token unlock pressure
Deflationary mechanism through network usage
Staking rewards for network validators
Real utility driving organic demand
Price Targets & Risk Management
Bullish Scenario (70% probability)
Short-term target: $0.095 (26% upside)
Medium-term target: $0.120 (59% upside)
Long-term target: $0.150 (99% upside)
Key catalysts to watch:
Q3 partnership announcements
Network growth metrics
Broader DePIN sector developments
Bitcoin/crypto market sentiment
Risk Factors
General crypto market volatility
Regulatory uncertainty around DePIN projects
Competition from other blockchain platforms
Execution risk on roadmap deliverables
Rating: BUY
Risk Level: Medium
Time Horizon: 3-6 months, or longer
Quick note: I'm just sharing my journey - not financial advice! 😊 The analysis above is personal.
nifty going to down that chart say level sabke nikalte h. ye bat ham bta rhe h.nifty going to down because here chart say about it and this point is also strong after deal not success with USA. so be careful to going on trend
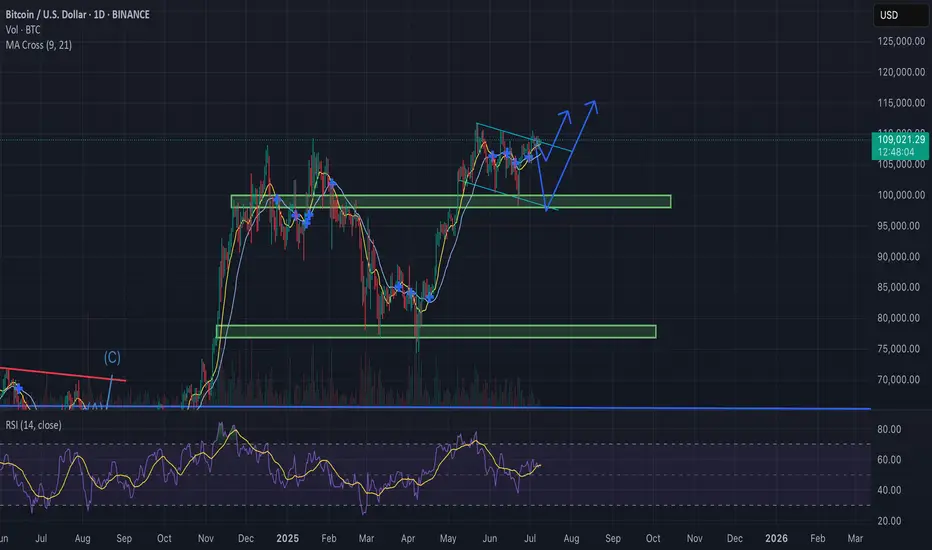
Bitcoin Update – Bullish Falling Wedge in Play?BTC/USD is currently trading near $108.8K, compressing within a falling wedge formation — historically a bullish continuation pattern, especially after a strong uptrend.
Why the Bias Remains Bullish:
Bullish MA Cross: Short-term MAs (9/21) are aligned for upside momentum.
Falling Wedge: Price compressing with lower highs and lows, coiling for a breakout.
RSI Strength: RSI (purple) remains elevated, supporting continued upside pressure.
Fundamental Catalysts:
Trump delays trade war announcements, reducing global uncertainty.
FOMC meeting in late July: Trump pushes for rate cuts, potentially bullish for risk assets like BTC.
If BTC breaks out above the wedge resistance with convincing volume:
Retest likely at ~$110K
Targets : $115K → $120K+
Data is about to be released. Where will gold go?Yesterday, the market expected a trade agreement between the United States and its trading partners, which boosted risk sentiment, and the strengthening of the US dollar and the rise in US bond yields further added pressure on gold prices. Gold fell 1% during the day and once lost the $3,300 mark during the session.
After gold bottomed out and stabilized at 3,320 on Monday, it fell sharply above 3,320 again on Tuesday and has now completely fallen below 3,320. The position of 3,320 is very important. In the 3,320-50 range, it chose to break down at 3,320 again.
Today, the Federal Open Market Committee of the United States will release the minutes of the June monetary policy meeting. Although Federal Reserve Chairman Powell remained neutral on the June interest rate decision, many Federal Reserve officials released dovish signals. Federal Reserve Board member Bowerman has turned to support the possibility of a rate cut in July.
From a technical point of view, the market has penetrated into the area around the lower support of 3,275-3,295.
The rhythm of the entire market is still a process of oscillating decline. From the perspective of pressure position, the daily MA5 average line has not fallen below, and may fall again to around 3270. Once the market falls too fast and approaches this position, there is a high probability that there will be a rebound demand.
Operation strategy:
Buy near 3375, stop loss at 3365, profit range 3315-3320.
Continue to hold position after breakthrough.

Bears On The Prowl, Key Supports In FocusAnalysis
USDJPY has faced downward pressure recently and is currently trading below a key resistance level around 152.250. This level acts as a significant barrier to upward movements, and the inability to decisively break above it reinforces our bearish outlook.
Key Observations
🔹 Dominant Bearish Pressure: Despite fluctuations, bulls (buyers) seem to be struggling to maintain higher levels, while bears (sellers) are asserting pressure.
🔹 Key Resistance: The 152.250 level serves as a strong resistance. As long as the price remains below this level, the bearish view will prevail.
🔹 Crucial Supports: The levels of 141.710 and 137.410 are acting as critical support zones for this pair. A break below either of these levels could pave the way for further declines.
🔹 Momentum Indicators: (Here, you can add details about specific indicators that confirm your bearish view. For example: "The RSI is moving towards oversold territory, suggesting continued downside momentum," or "The MACD is showing a bearish crossover, indicating potential for further weakness.")
Potential Scenarios
🔴 Primary Scenario (Bearish): As long as USDJPY remains below the 152.250 resistance, we anticipate continued downward pressure. The bears' initial target will be to test and break the 141.710 support.
🔻 Break of First Support: If the 141.710 support is broken decisively (with strong candles and significant volume), this would be a strong bearish signal. In this scenario, the next target for the price would be to test the lower support at 137.410. A break below this level could lead to even deeper declines.
🟢 Alternative Scenario (Bullish): Should USDJPY manage to decisively break above the 152.250 resistance and sustain itself above it, our bearish view would be temporarily invalidated, and we might see a corrective upward movement. However, until this occurs, the focus remains on the bearish scenario.
Fundamental Considerations
🔘 US-Japan Interest Rate Differential: The significant interest rate differential between the US Federal Reserve and the Bank of Japan continues to be a major factor. Any shift in market expectations regarding the monetary policies of these two central banks could impact USDJPY.
🔘 Bank of Japan (BoJ) Policy: Any signs of a change in the BoJ's ultra-loose monetary policy (e.g., an interest rate hike or a reduction in asset purchases) could strengthen the JPY and put downward pressure on USDJPY.
🔘 US Economic Data: Upcoming US economic data, particularly inflation figures and statements from Federal Reserve officials, could influence the dollar's value and, consequently, USDJPY.
🍀HAVE PROFITABLE TRADES🍻
