EURGBP Is Rising Further After UK Retail Sales missed estimatesEURGBP Is Rising Further After UK Retail Sales missed estimates
EURGBP already broke out from an Ascending Triangle pattern after it spent some time in accumulation and without direction the price is rising today.
This is the third and clear bullish pattern that EURGBP broke out and the chances to rise one more time are high.
K retail sales is supporting this bullish movement because they failed to meet expectations.
Overall, the data was higher compared to the last month, but the fact that it missed expectations suggests that the UK economy is growing in small steps.
You may find more details in the chart!
Thank you and Good Luck!
PS: Please support with a like or comment if you find this analysis useful for your trading day
Disclosure: I am part of Trade Nation's Influencer program and receive a monthly fee for using their TradingView charts in my analysis.
Fundamental Analysis

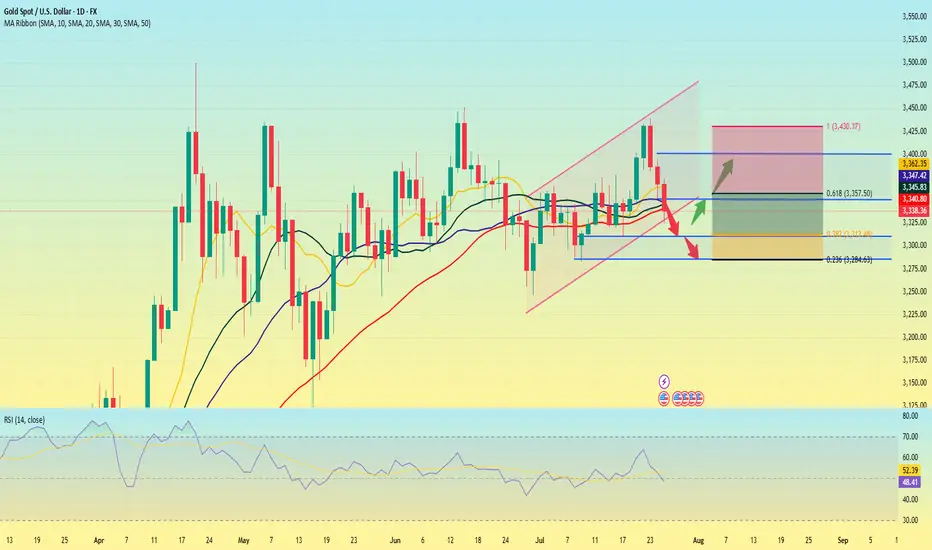
Gold is weak. Will it explode next week?Gold prices failed to stabilize above $3,400 after a bullish breakout this week. The technical outlook highlights the recent indecision of gold bulls.
In the first two trading days of this week, spot gold prices rose by 2.4%, but the cumulative decline in the last three trading days of this week reached nearly 3%. The sharp fluctuations this week were due to the positive progress in Trump's trade negotiations, and the rebound in market risk appetite, which hit the safe-haven demand for gold.
Looking at next week, the economic calendar will provide several high-impact data releases. The Federal Reserve will announce its monetary policy decision after the policy meeting on July 29-30; the US Bureau of Labor Statistics will release the July employment report; and some important news such as the US-China trade negotiations may trigger the next major move for gold.
From a technical perspective, the current market short-term technical outlook highlights the hesitation of gold buyers. The daily chart shows that the RSI is still slightly below 50, and gold prices have difficulty staying away from the 20-day and 50-day MAs after breaking through these two levels earlier this week.
On the upside, 3450 constitutes the first resistance for gold prices. If it breaks through this resistance, gold prices will most likely hit the 3400 integer mark again.
On the downside, if gold prices remain below 3340, technical sellers may still be interested. In this case, 3310 can serve as the first support level, followed by the second support level near 3285.
A new week is about to begin, and I wish all traders good luck.
TON/USDT - Bullish Channel in H4 (27.07.2025)The TON/USDT pair on the H4 timeframe presents a Potential Buying Opportunity due to a recent Formation of a Bullish Channel Pattern. This suggests a shift in momentum towards the upside and a higher likelihood of further advances in the coming Days.
Possible Long Trade:
Entry: Consider Entering A Long Position around Trendline Of The Pattern.
Target Levels:
1st Resistance – 3.770
2nd Resistance – 3.989
🎁 Please hit the like button and
🎁 Leave a comment to support for My Post !
Your likes and comments are incredibly motivating and will encourage me to share more analysis with you.
Best Regards, KABHI_TA_TRADING
Thank you.

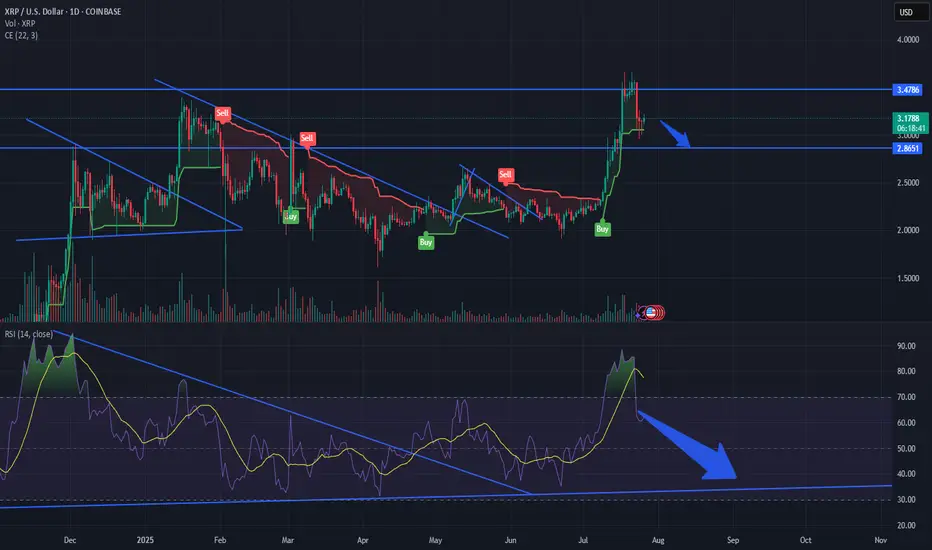
XRPUSDT - Analysis for Immediate Long Entry1. Chart Analysis
First, let's confirm the technical setup on the daily chart.
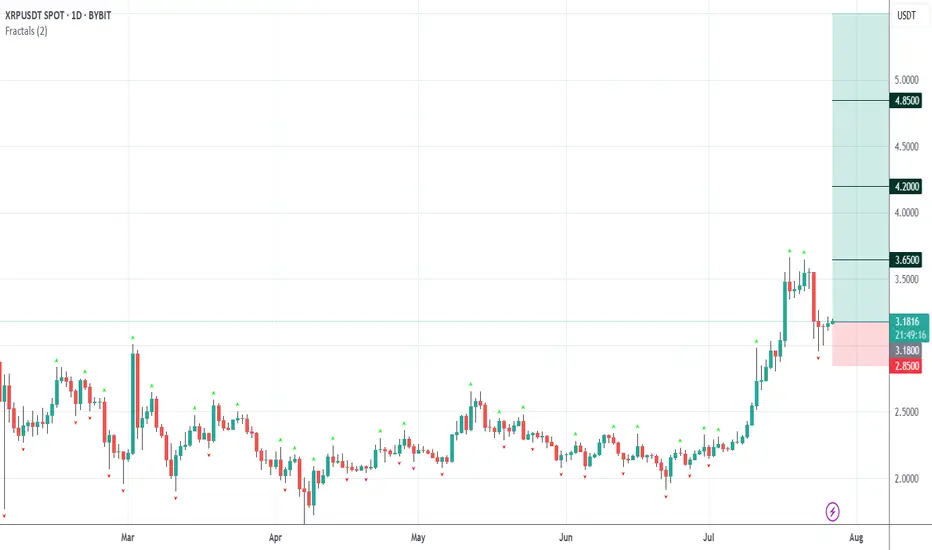
The chart shows a powerful rally in July, peaking around $3.60. The price then entered a retracement phase, pulling back as expected.
It has now dropped to the $3.15 - $3.20 zone. As we identified, this level is critical. It was the peak of the rally in early March 2025. The price is currently testing this old resistance level, and we are looking for it to act as new support. The most recent daily candle is green and appears to be bouncing right off this level. This is a textbook "support and retracement" setup, making it a prime candidate for an immediate long market entry.
2. Sentiment and Fundamental Analysis
Now, let's see if the news supports our bullish technical outlook.
"Nasdaq Firm Files $50M Plan to Integrate XRP into Core Operations" (13 hours ago) & "Nasdaq-Listed Firm Bets on XRP for Payments, Treasury in SEC Filing" (2 hours ago): This is highly significant and bullish news. A publicly-traded company integrating XRP into its core operations and treasury with a $50M plan is a massive vote of confidence. It signals real-world adoption and institutional interest, which are powerful drivers for price.
"Wellgistics Taps XRP for Payments, Collateral, and Income Plans" (22 hours ago): Another concrete example of real-world utility. A logistics company using XRP for payments and collateral reinforces the core use case for the token. This is fundamentally bullish.
"XRP Golden Cross Confirmed: Could This Be the Spark for a Major Breakout?" (24 hours ago): A "Golden Cross" (when a short-term moving average crosses above a long-term one) is a classic technical buy signal that many traders follow. While it's a lagging indicator, news articles highlighting it can create bullish sentiment and attract more buyers.
"Ripple CEO Exposes DeFi Power Move as 35M XRP Suddenly Changes Hands" (17 hours ago): This headline is slightly ambiguous but points to significant on-chain activity and strategic moves by Ripple's leadership in the DeFi space. Large token movements often precede significant price action and suggest strategic positioning, which in this context, appears bullish.
Overall Sentiment: The sentiment is overwhelmingly bullish. The news is not just hype; it's focused on concrete, fundamental developments like institutional adoption (Nasdaq firm, Wellgistics) and treasury integration. This aligns perfectly with our bullish technical setup.
Decision:
Proceed with the long trade. The technicals and fundamentals are in strong alignment.
The Trade Plan: XRPUSDT (Long)
The plan is set. We're entering a long position with a market entry now, around $3.18.
Entry Reason: Entering a long position as the price retraces to a key historical resistance level ($3.15-$3.20) that is now acting as support. The entry is confirmed by a bounce on the daily chart and overwhelmingly positive news about institutional adoption and real-world utility.
Stop Loss (SL): $2.85
Reason: This level is safely below the current support zone and below the recent swing low of the pullback. A break below $2.90 would invalidate the "resistance-turned-support" thesis. Placing the SL at $2.85 gives the trade room to fluctuate without stopping us out prematurely.
Take Profit 1 (TP1): $3.65 (Moonbag Target)
Reason: This target is just above the most recent high. A move to this level would confirm the uptrend has resumed. It's a logical place to take initial profits as there may be some sellers at the previous peak.
Action: At TP1, we take some profit and move the trailing stop to our entry price (~$3.18) to make the remainder of the trade risk-free.
Take Profit 2 (TP2): $4.20
Reason: This is a key psychological level and corresponds to a standard Fibonacci extension target (1.272 extension) projected from the previous major swing. It represents a logical next stop for the rally.
Action: When TP2 is hit, move the trailing stop up to the TP1 level ($3.65) to lock in profits.
Take Profit 3 (TP3): $4.85
Reason: This level aligns with the 1.618 Fibonacci extension, a very common target in strong trends, and is approaching the major psychological number of $5.00.
Action: When TP3 is hit, move the trailing stop up to the TP2 level ($4.20).
Take Profit 4 (TP4): $5.50 (Final Target)
Reason: This is our optimistic final target. It represents a significant psychological milestone and a potential area for a major trend peak.
Action: Close all remaining positions.
Conclusion:
The XRPUSDT long trade is a high-quality setup where both technical and fundamental factors are aligned. The risk is well-defined, and the profit targets offer a strong reward potential. The plan is now in place.
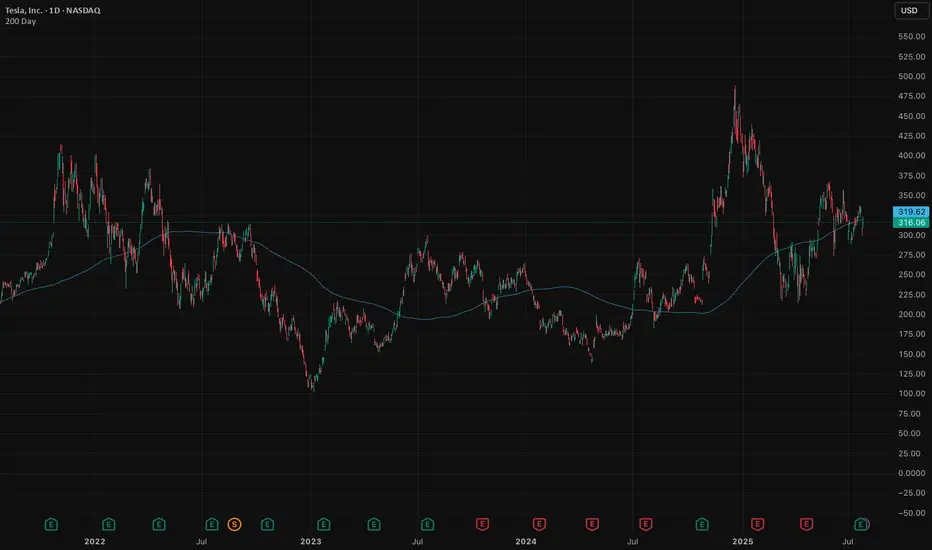
Tesla in the waiting room as revenue slidesTesla is a global innovator that is changing the world. As a general rule, many investors have a saying: Never bet against Elon. They're not wrong. Elon delivers. But the short term is messy.
The stock is hovering around its 200-day moving average, a critical test. Break lower and we could see $290, maybe $260. That’s not panic, it's just price catching up to reality.
The auto business is deep in a downcycle. Q2 deliveries fell 14%, with revenue down 12%. Profits squeezed. Classic cyclical move. Nothing new here. But it’s weighing on momentum.
The upside isn’t about cars, it's autonomy, robotaxis, AI (Grok in cars). That’s where Tesla becomes a $2 trillion company. Musk knows it and is building for the future (100,000 GPU super cluster). He’s already shifting the story.
But that future is 6–12 months out, maybe longer.
In the meantime, we sit in the waiting room. Auto volumes need to stabilise. Robotaxi needs scale. Optimus requires proof and some definitive timeframes to get the market excited. That creates a 3–6 month narrative gap. Markets hate gaps.
Earnings last week were among the softest (though expected). EPS fell 23%. Free cash flow almost vanished. No real catalysts until next quarter. If the broader market sells off, which looks likely, Tesla takes more heat.
But let’s not lose the plot. Tesla is still Tesla. Long-term vision remains. Musk’s execution record is unmatched. Bet against him and you lose, eventually.
Short term, expect weakness. Patience required. If the stock breaks $315 with conviction, we’d expect further weakness before the real upside re-emerges.
Wait, watch, then pounce.
The forecasts provided herein are intended for informational purposes only and should not be construed as guarantees of future performance. This is an example only to enhance a consumer's understanding of the strategy being described above and is not to be taken as Blueberry Markets providing personal advice.
USOILBullish senaorio
"BUY Call / Long – Strong upside trend across most timeframes, supported by disrupted supply, elevated oil prices due to real production losses, and renewed geopolitical risk."

FFCFFC PSX STOCKs breakout Day Level Buy Call
Fundamental Strengths
Robust earnings growth:
FY 2024 net profit ~PKR 64.7 B vs ~PKR 29.7 B (2023) – EPS nearly doubled to PKR 45.49
Pakistan Stock Exchange
+15
StockAnalysis
+15
.
Q1 2025 EPS ~PKR 9.33 (Sep‑Nov on TTM ~PKR 66.6)
Pakistan Stock Exchange
.
Attractive valuation:
TTM P/E ~9.6× (TradingView shows ~6.6×—likely consolidated vs standalone) .
High dividend yield:
~8.7–9.9% yield in 2024, with a ~60% payout ratio
TradingView
.
Diversified portfolio:
Operations across fertiliser, power, food, banking (via Askari Bank), wind generation, phosphate JV – mitigating sector risk
TradingView
+1
+1
Strong ownership:
Backed by Fauji Foundation (~43% owner) – adds stability and governance credibility

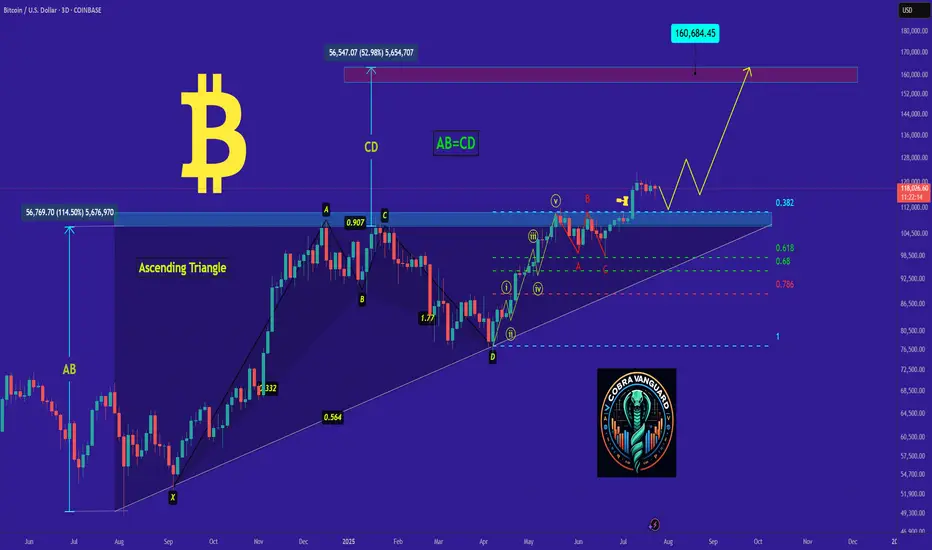
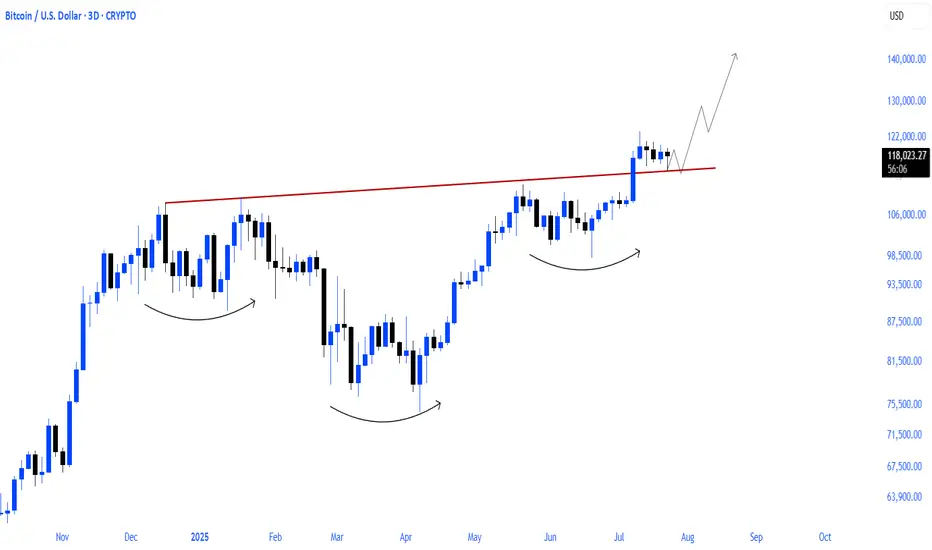
$BTC NEXT WAVE PROGRAMMED!bitcoin will load the next wave after the accumulation process it is in after the parabolic run
#QS - 4HR [Will the last boost last or will it bust? With a new Volkswagen investment and partnership. Quantum Scape’s earnings were far from stellar with a 26% decrease in income compared to same time last year. They have, nevertheless, made advancements with their very promising lithium-Metal battery technology.
With fundamentals aside, I am curious to gauge how long-term investors have priced-in the company's stock price.
Technically, I see price moving to present yet another opportunity by EOY if not sooner. My count shows important levels to watch.
Go #QuantumScape, Go!!!
Check out my other chart ideas @CaxhPrince everywhere.

$ETH MAJOR FALLING TREND BREAKOUT!CRYPTOCAP:ETH MAJOR FALLING TREND BREAK AND RETEST COMPLETE.
Eth season seems to be just around the corner
MORE TO COME

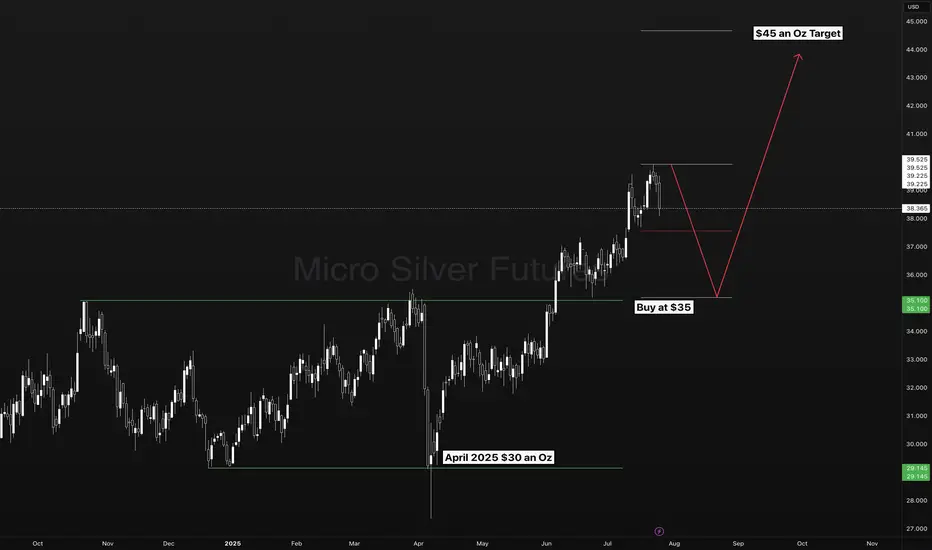
Silver - The Long Term SetupSilver on the longer term may be setting up for a trend continuation opportunity from $35 to $45 dollars an Oz.
Do you Trade FOREXCOM:XAGUSD ?
Do you Trade FOREXCOM:XAUUSD ?
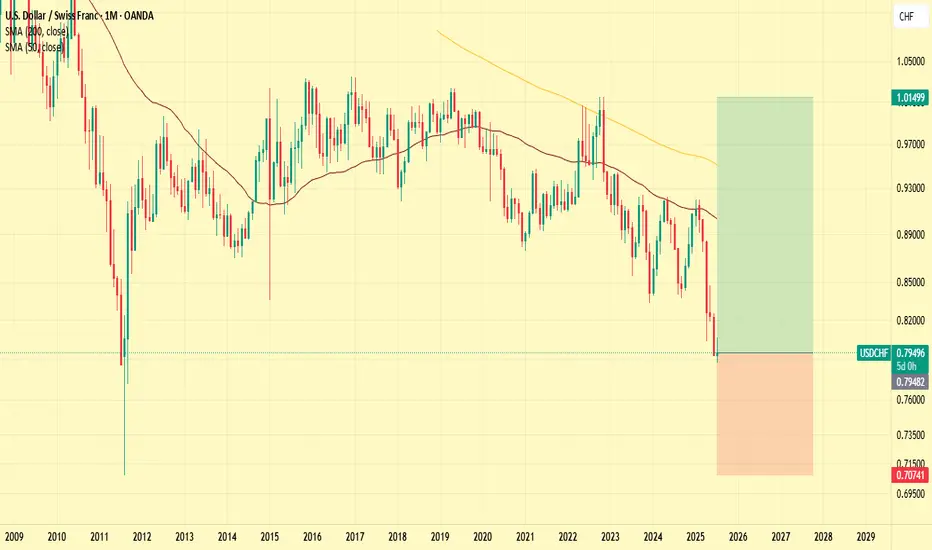
US Dollar Strength To Return In Full ForceThe mighty Dollar will once again prevail in the long term across all major pairs. It's status as the world reserve currency is far from removed.
Swing Short for EURGBPPrice will likely turn bearish again soon. Expecting the Pound to regain ground.

BTCUSD LONGIt's a long time to write and explain everything, just buy the level with the limit that is at ~117.550. You can count on a short-term rebound.
The one below the touchdown is not worth taking. I'll let you know if it works or not later.


ETH to $3700 Before a Major Bounce?Ethereum has been showing signs of exhaustion after its recent rally. I'm watching the $3700 level closely — it's a key support zone that has acted as both resistance and support in the past.
🟦 If ETH pulls back to this area, I expect it to find strong buying interest, potentially leading to a significant bounce and continuation of the bullish trend.
📌 Scenario I'm Watching:
🔻 Pullback to the $3700 support zone
📉 Shakeout or stop hunt below previous lows
💚 Followed by a strong bullish reversal — possible move toward $4000+
Why $3700?
Confluence of previous highs/lows
Psychological round number
Potential liquidity pocket
Not Financial Advice!
This is a scenario I'm tracking, not a guarantee. As always, wait for confirmation (e.g. bullish engulfing, RSI divergence, volume spike) before jumping in.
📉 If $3700 fails decisively, I'll reassess — next support likely around $3550–3600.

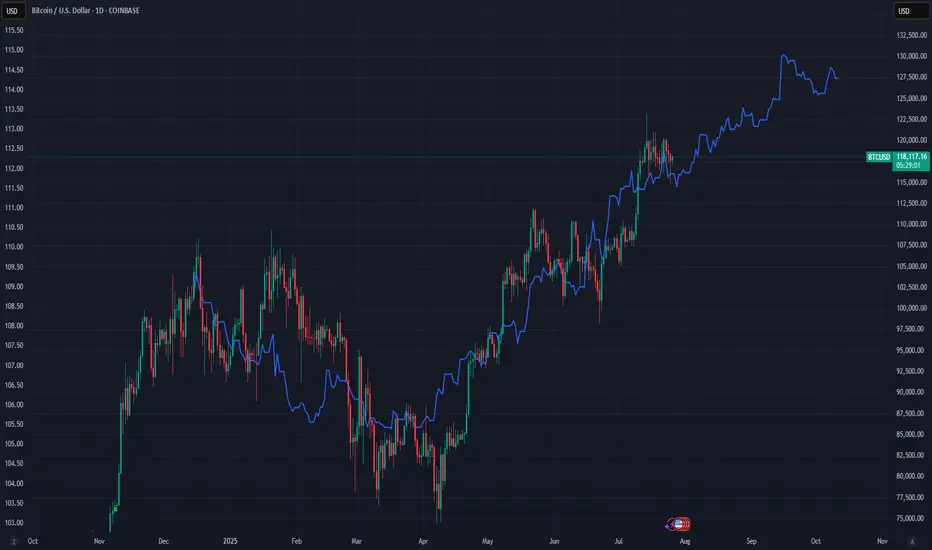
Bitcoin vs Global M2: Can Liquidity Predict the future?This chart compares Bitcoin’s price (daily) with a Global M2 indicator that includes the monetary supply of major economies like the U.S., Eurozone, China, and Japan.
It’s not a perfect global measure — but it gives us a reliable macro signal of what global liquidity is doing.
And when it comes to Bitcoin, liquidity is everything.
Why this matters:
Bitcoin is often seen as volatile or unpredictable. But when we zoom out and overlay it with liquidity flows (like M2), a powerful pattern emerges:
Bitcoin tends to follow global M2 with a ~10-week lag.
When M2 rises, Bitcoin often rallies weeks later. When M2 contracts, Bitcoin loses momentum.
This makes M2 a powerful leading indicator — not for predicting exact price levels, but for catching the direction of trend and regime shifts.
What this chart tells us:
M2 leads, Bitcoin follows.
The curves won’t align perfectly — but the macro structure is there.
Big expansions in M2 create a friendlier environment for risk assets like BTC.
This is the same logic used by macro strategists like Raoul Pal: liquidity drives everything.
Important disclaimer:
This doesn’t mean M2 tells you where price will be on a specific date. But it can help identify turning points — and confirm whether we’re in a reflationary vs contractionary environment.
Think of it as a weather forecast, not a GPS pin.
In other words:
This chart doesn't show the price. It shows the future.
xrp correction time rsi indicates oversold RSI is oversold on the 1 day daily correction happening next stop $285 ish good luck
EURCAD BUYS!Both entries still very much valid, we are bullish on the daily , first entry pushes to the upside to take out liquidity , then we target the imbalance in the market at the bottom, which then pushes the market to break our last daily high.

Teach me to fish, don’t hand me the catch.
---
🎯 **“Teach me to fish, don’t hand me the catch.”**
That’s the mantra behind what we do.
We’re not here to hand you quick wins—we’re here to equip you with the tools, mindset, and precision to master the art of **technical analysis**.
📚 **Follow Us** as we unlock proven strategies, crafted through years of experience and sharpened by real market conditions.
💼 **What You'll Get:**
- High-performance analysis techniques
- Visual case studies from our **actual trades**
- Clear examples from the insurance sector and beyond
- A blueprint to recognize and seize winning setups with confidence
💥 Whether you're new or seasoned, this isn't textbook theory.
This is **applied strategy**, built for clarity and verified by results.
---

GBPNZD Breakdown – Smart Money Turns Fully Bearish🧠 Macro + COT + Sentiment Context
Commitment of Traders (COT) – Asset Managers
Institutional asset managers are significantly net short on GBPNZD, with positioning at its lowest level of the year and declining sharply since May. This reflects a clear bearish stance from smart money and reinforces the current downward pressure.
Sentiment & Momentum Indicators
DPO: -54.9 → Indicates a moderately bearish momentum phase.
Wyckoff: -20.3 → Price is in a distribution phase, suggesting weakness.
Speed: 3.2 → Low acceleration, but directional bias remains bearish.
Market Mood: Neutral, but leaning into oversold territory.
Seasonality (July 1st – Sept 30th)
Historically, GBPNZD performs positively in this period:
3Y: +1.7%, 5Y: +1.6%, 10Y: +2.3%, 15Y: +2.8%
However, in 2025, price is diverging sharply from seasonal norms. The pair is trading against historical patterns, suggesting a seasonal anomaly where institutional flow is dominating historical behavior.
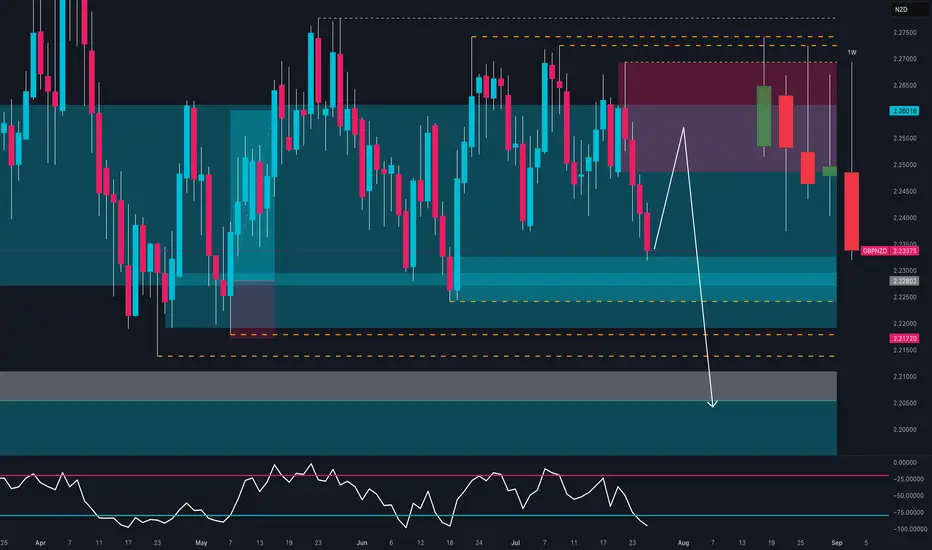
🧱 Technical Outlook (Daily Chart)
GBPNZD had been consolidating in a clear range between 2.2170 support and 2.2750 resistance since May. The pair has now broken down with a strong, full-bodied weekly candle, closing below the 2.2320 demand zone.
Key Technical Zones:
Supply zone (2.2494–2.2659) → A clear rejection zone that initiated the current selloff.
Demand zone (2.2170–2.2300) → Has been tested twice already, increasing the probability of a clean breakdown.
RSI (Daily) → Currently neutral, with a sequence of lower highs and no bullish divergence in sight — indicating weak momentum.
✅ Conclusion & Trade Plan
Directional Bias: Bearish (Short)
Although seasonality typically supports bullish price action for GBPNZD in Q3, the current context is decisively bearish. Institutional positioning, price structure, and sentiment all confirm a potential shift in direction, reinforced by a confirmed weekly breakdown.
Bearish Targets:
📍 First: 2.2170 (recent support test)
📍 Second: 2.2000–2.1900 (April swing low)
📍 Extension: 2.1750 (base of previous accumulation zone)
Invalidation Criteria:
A weekly close above 2.2490 (supply zone breached)
Bullish RSI divergence + weekly recovery candle
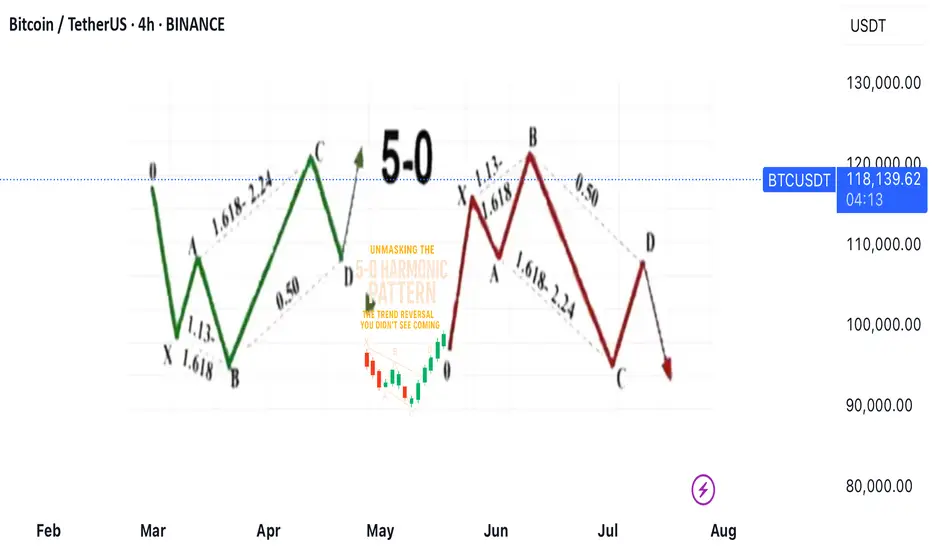
Unmasking the 5-0 Harmonic Pattern
---
🎯 **Unmasking the 5-0 Harmonic Pattern: The Trend Reversal You Didn't See Coming**
Discovered by the visionary Scott Carney and unveiled in _Harmonic Trading, Volume Two_, the **5-0 pattern** isn't just another blip on a trader’s radar—it’s a siren of market reversal.
📈 **Why It Stands Out**
- Unlike the familiar Bat or Gartley structures, the 5-0 pattern is fueled by **precise Fibonacci ratios**, making its reversal zone deadly accurate.
- Centered around the pivotal **Point B**, this model doesn’t just hint at change—it defines it.
🌀 **The Anatomy of a Flip**
- Often marking the **first true pullback in a major trend reversal**, the 5-0 isn’t a lagging indicator—it’s your early warning system.
- The **AB leg?** That’s no ordinary wave—it’s usually the final gasp of a fading trend, setting the stage for powerful new momentum.
💥 **Bottom Line**
This isn’t just technical analysis—it’s strategic foresight. The 5-0 pattern reveals where the market **hesitates... and where you strike**.
---
_"To truly learn, we must see it in action.
So let’s pull back the curtain and share a powerful example from our **past insurance market trades**—a deal that blended precision, timing, and strategy.
In comments
bitcoin- Time to buy again! (Update)As I said, Bitcoin broke the triangle, and now with a slight price correction, it could surge to $160,000, and you still think I'm joking!!
Previous analysis