#Bitcoin/#Nasdaq correlation💡CRYPTOCAP:BTC often follows the technology sector of the stock market. The chart clearly shows the moments when they diverge. As we can see now one of these.
Also below you can see the Spearman-rank correlation, which better shows us the moments when two assets start to move in different directions.
Fundamental Analysis

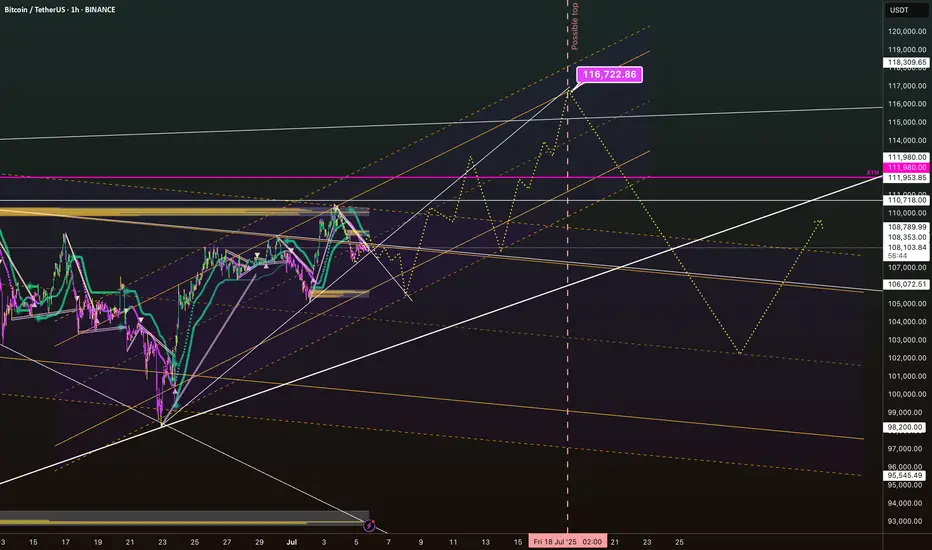
BTC/USDT July Outlook: Road to 116K or a Trap Below?The current structure shows Bitcoin consolidating after a strong bounce off the June lows. We’re now forming a potential bullish continuation pattern within a clear rising channel (dashed yellow lines), but the price is currently testing a mid-channel liquidity zone around $108,000–$110,000.
Key observations:
Local resistance zone: $111,980 (marked ATH) – a major liquidity magnet that could trigger a squeeze if broken. Support range: $106,000–$103,000 – strong confluence zone if price rejects current structure. Potential fakeout: Liquidity dip down to the $98,200–$95,500 zone is possible before a mid-July reversal (highlighted yellow path and vertical time marker on July 18).
Upside target: The upper channel boundary and projected fib confluence points to a bullish target of $116,722 by mid-to-late July.
Invalidations:
Sustained break below $95,000 could negate the bullish structure and push us into deeper correction territory.
Timing: The key date to watch is around July 18, where multiple structural lines and projection paths converge.
What’s your bias for July? Trap and rip… or stairway to 117K?
#Bitcoin #BTCUSDT #CryptoAnalysis #TradingView #LiquidityZones #BTCJulyOutlook
DOODUSDT.P 4H SHORTDOODUSDT.P {BYBIT} 🔻
Market hits resistance with lower momentum showing divergence in momentum. Expecting a third touch on bearish trendline and a strong bearish confirmation to short. Share your thoughts in the comment section.

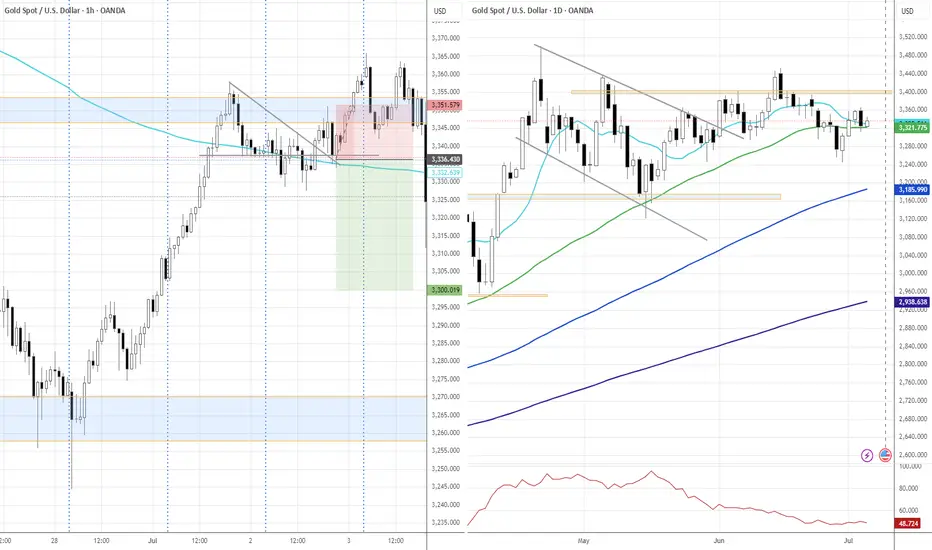
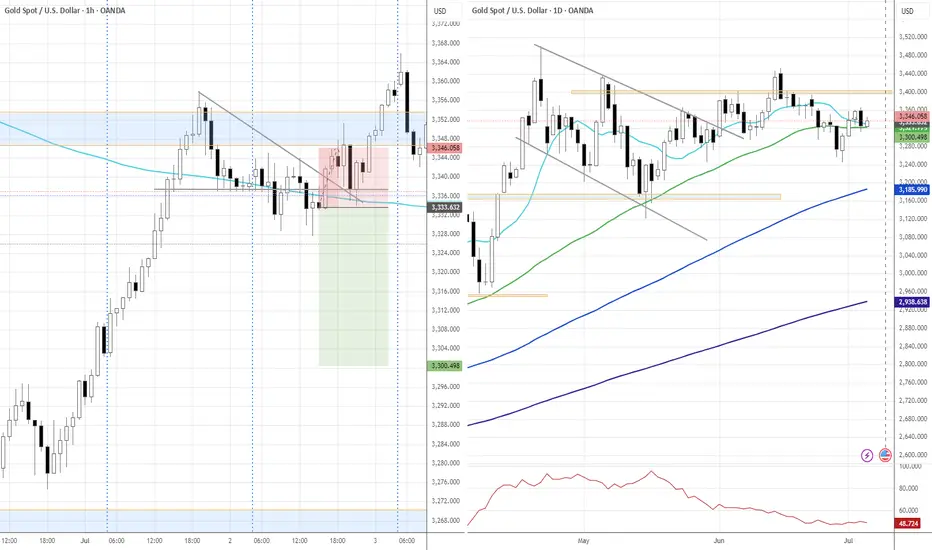
Gold continues to fluctuate. The direction is uncertain.Gold prices did not have a large continuation breakthrough on Friday due to the impact of the US Independence Day holiday; although the non-agricultural data on Thursday fell rapidly under the unfavorable conditions and formed a bottoming-out situation, the short-term bulls and bears were once again in a deadlock. After a small sideways movement on Friday morning, it rose again. Although it did not break through the upper pressure line of 3345, it still closed in the form of a positive line, which also gave the bulls hope to dominate next week.
At present, the upper key pressure is still maintained at the 3345 line, which is also the first point for the bulls to break through. Once the upper breakthrough is successful, the next target will be maintained at around 3365-3380. The support below is maintained at around 3325. If this position is broken down on Monday, the support of 3325 will not be maintained, and the bears will continue to open the downward channel.
But overall, the market direction is still unclear, and we can conduct trial transactions. Go long when the price falls back to 3325 on Monday in the Asian market, the profit range is 3340-3350, and the stop loss is 3315. If the European market continues to strengthen, you can still go long. If the European market continues to strengthen, we can still continue to go long. Otherwise, we still need to adjust our thinking in a timely manner.

$EUIRYY - Europe CPI (June/2025)ECONOMICS:EUIRYY 2%
June/2025
source: EUROSTAT
- Eurozone consumer price inflation rose slightly to 2.0% year-on-year in June 2025, up from May’s eight-month low of 1.9% and in line with market expectations, according to a preliminary estimate.
The figure aligns with the European Central Bank’s official target.
Among major economies, inflation in Germany unexpectedly declined, while France and Spain saw modest increases and Italy’s rate held steady.

Current Pivot Points on the BtcUsd Pair📈 Classic Pivot Points (Daily Timeframe)
Using yesterday’s data:
High = $109,723.7 (Jul 3)
Low = $108,544.8
Close = $108,590.5
investopedia.com
+15
marketmilk.babypips.com
+15
dailyforex.com
+15
investing.com
+1
coinlore.com
+1
Compute:
Pivot Point (PP) = (109723.7 + 108544.8 + 108590.5) / 3 ≈ $108,953.0
Resistance 1 (R1) = (2 × PP) – Low ≈ $109,361.2
Support 1 (S1) = (2 × PP) – High ≈ $108,182.3
Resistance 2 (R2) = PP + (High – Low) ≈ $109,912.0
Support 2 (S2) = PP – (High – Low) ≈ $108,023.0
These central and level lines offer key zones where price might reverse, pause, or breakout.

LITECOIN (LTC) - On The Verge Of Exploding - ETF Catalyst?Litecoin: A Decentralized Network with a Differentiated Risk Profile
Litecoin (LTC), launched in 2011 by former Google engineer Charlie Lee, is one of the oldest and most active Layer-1 blockchain networks in the cryptocurrency space. Often referred to as the “digital silver” to Bitcoin’s “digital gold,” Litecoin was designed to offer faster transactions, lower fees, and broader accessibility while maintaining a similar monetary policy and codebase.
This post aims to provide an overview of Litecoin’s technical structure, usage, risk profile, and current developments—without speculative bias—so readers can form their own assessments.
1. Transparent Origins and Founder Dynamics
One key difference between Litecoin and Bitcoin lies in the identity of their respective creators. Bitcoin was developed by Satoshi Nakamoto, a pseudonymous and still-unknown individual or group, who is estimated to hold 750,000 to 1.1 million BTC—a significant portion of the total supply that has never moved. The dormant status of these holdings has occasionally raised concerns about future market impact if they were ever activated.
In contrast, Litecoin was founded by Charlie Lee, a known and public figure who was active in the community before, during, and after the launch. In 2017, Lee announced he had sold or donated nearly all his LTC holdings to avoid any potential conflict of interest. Today, no founder or insider is known to hold a disproportionate share of the Litecoin supply. This level of transparency and decentralization has been interpreted by some as a factor that lowers long-term governance and concentration risk.
2. Structural Simplicity and Leverage Exposure
Another distinction between Litecoin and Bitcoin lies in market structure and exposure to leverage.
Bitcoin is widely used as collateral in crypto lending markets and institutional derivatives, including perpetual futures and structured products. This has introduced significant systemic risk during periods of market stress, as high leverage has historically led to cascading liquidations across centralized and decentralized platforms.
Litecoin, in contrast, has relatively limited exposure to leveraged products and collateralized lending. It is not commonly used as collateral in CeFi or DeFi protocols, and institutional futures markets for LTC are smaller and less active. As a result:
Litecoin is less likely to trigger or be affected by mass liquidations
It has reduced systemic risk due to lower market entanglement
Its price tends to reflect more organic supply/demand dynamics
It is less involved in cross-collateralized or rehypothecated loan systems
This simpler structure may appeal to risk-aware investors looking for cleaner exposure without the reflexivity effects common in heavily leveraged markets.
3. Scarcity and Monetary Policy
Litecoin shares a similar deflationary model with Bitcoin, with a hard cap of 84 million LTC and scheduled halving events every four years. The most recent halving occurred in August 2023, reducing the block reward from 12.5 to 6.25 LTC per block.
With over 75 million LTC already mined, fewer than 9 million remain in future issuance. The protocol’s monetary policy is deterministic and cannot be altered unilaterally, which may appeal to those who prioritize predictable supply and inflation resistance.
While Litecoin’s cap is four times higher than Bitcoin’s, the relative issuance schedule and halving dynamics mirror Bitcoin’s design. Some investors view this as a hedge against fiat currency debasement, although the asset's volatility and adoption context should be taken into account.
4. Network Fundamentals and Real-World Use
Litecoin has maintained near 100% uptime since inception, and its transaction throughput and fee structure are generally favorable compared to many competing networks.
In 2024, Litecoin became the most used crypto for payments via BitPay, surpassing Bitcoin in transaction volume, driven by its fast 2.5-minute block times and low transaction fees. It is supported by major platforms including PayPal, and accepted by thousands of online and retail merchants.
From a security perspective, Litecoin’s hashrate reached all-time highs in 2025, partly due to merge-mining with Dogecoin, which has helped strengthen its proof-of-work infrastructure. Network upgrades like MWEB (MimbleWimble Extension Blocks) have added optional privacy layers to Litecoin’s UTXO model, while Lightning Network integration supports instant payments.
These developments suggest that Litecoin continues to evolve, with emphasis on efficiency, user privacy, and practical usability.
5. Institutional Presence and ETF Outlook
Litecoin has seen modest but growing institutional involvement. Products such as the Grayscale Litecoin Trust (LTCN) have existed for several years, and Coinbase introduced Litecoin futures trading in 2024. Fidelity also offers LTC trading and custody to institutional clients.
More notably, a Spot Litecoin ETF application is currently under review by the U.S. Securities and Exchange Commission (SEC), with analysts from Bloomberg estimating a 95% probability of approval before the end of 2025. If approved, this would make Litecoin one of the first proof-of-work assets outside of Bitcoin to gain direct exposure through a regulated ETF vehicle.
Should that happen, it may increase access, liquidity, and legitimacy among traditional investors. However, as always, regulatory decisions remain uncertain and subject to broader political and market conditions.
6. Technical Structure and Long-Term Price Action
From a macro-technical perspective, Litecoin has historically followed a pattern of higher lows and higher highs across each market cycle. This structure remains intact as of 2025, with a strong support at 81 USD on a 6 months timeframe.
Summary
Litecoin presents a combination of characteristics that differentiate it from other crypto assets, including:
✅ A public, transparent founder and no major insider dominance
✅ Limited exposure to leveraged lending, reducing systemic risk
✅ Deterministic monetary policy with a fixed supply and halving schedule
✅ Real-world usage in payments and retail adoption
✅ Strong network security and development activity
✅ Potential ETF approval that may broaden accessibility
These features do not necessarily imply outperformance, but they form the basis for an asset with a relatively clean structure, historical resilience, and a distinct position in the crypto ecosystem.
🔎 Disclaimer:
The information presented here is for educational and informational purposes only and should not be interpreted as financial advice.
Always conduct your own research, assess your individual risk profile, and make investment decisions based on your own analysis and objectives.

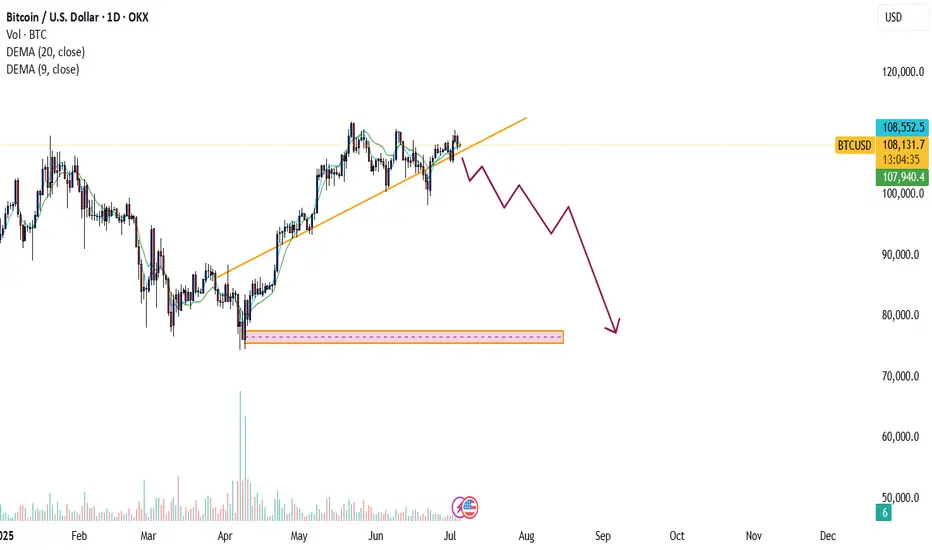
Bitcoin the exact scenariobitcoin may need some mre liquidity to fuel back up , so it's better to see this scenario as the most accurate, in order to make some new all time high
XAUUSD H4 Outlook – July 7, 2025“You don’t chase gold. You set the trap, then wait.”
👋 Hey traders — we’re gearing up for a new week on gold, and the H4 chart is starting to speak clearly. After Friday’s clean push into premium rejection zones, price is now compressing beneath a key supply block. Structure is fragile, and the next move will likely come fast.
Let’s position with precision before the breakout.
—
🔸 H4 Bias
Structure remains bearish short-term, with clear lower highs forming below a major supply at 3344–3351.
The broader bias leans neutral as we trade between unmitigated demand and inducement-heavy resistance. Confirmation is everything.
—
🔴 Supply Zones (Sell Areas)
3344–3351
→ H4 Fair Value Gap + OB combo inside premium
→ If price wicks above recent highs and rejects here, it could trigger a clean swing sell.
3380–3394
→ Origin of the last bearish leg + liquidity wick
→ High-risk, high-reward rejection zone if price spikes impulsively this week (e.g. post-Fed tone or surprise volatility).
—
🟢 Demand Zones (Buy Areas)
3265–3275
→ H4 FVG + flip zone + prior sweep level
→ If price taps and holds here, we may see re-accumulation for a move toward 3327–3340.
3235–3246
→ Strong unmitigated OB + discount level
→ Ideal sniper long zone only on clean rejection + structure shift (BOS on M15+).
—
🟡 Flip / Decision Zone
3299–3305
→ EMA50 + micro-range equilibrium
→ If price breaks and holds above this zone with strength, bias turns short-term bullish. If it rejects, continuation down is favored.
—
🎯 Execution Notes
EMA21/50 are acting as active compression bands — watch for rejection pressure
RSI shows no clear divergence yet — but volume is thinning
Liquidity is building above 3340 and below 3265 — prepare for traps both ways
—
🔚 Final Words
Sniper traders aren’t early — they’re precise. If you’ve been reacting too fast lately, this is your week to reset. Gold is telling a story here… but only structure speaks the truth.
🚀 If this helps bring clarity to your outlook, tap follow — we do this daily, with structure, not signals.
—
📢 Disclosure: I use Trade Nation’s broker feed on TradingView and I’m part of their influencer program.
📉 This is educational content, not financial advice.

XAUUSD Daily Outlook – July 7, 2025👋 Hey traders, welcome to the fresh week! After the Friday selloff, gold is approaching a key inflection point. Let’s break down what’s happening on the Daily chart and how to approach it with clarity — no guessing, just precision.
Stay focused. The real opportunity is always in how you prepare.
🌍 Macro + Sentiment
Market remains sensitive to yield shifts and broader risk sentiment (BRICS summit also continues)
Price remains elevated in premium territory after months of vertical flow — but structure is finally showing re-accumulation or re-distribution?
📈 Daily Bias
Neutral to bearish until the 3330–3344 zone fully flips cleanly as support
Structure shows lower highs, strong wick rejections in premium zones, and a need for confirmation
🧠 What the chart tells us:
Price is compressing between a D1 FVG (below) and unfilled premium OB (above)
Friday’s low wicked into a small imbalance — but was not a clean tap into the main OB
RSI is midrange, EMAs are flat, and momentum is indecisive
We're either gearing up for a bullish FVG reclaim or prepping for a deeper drop into discount
⚠️ Key Zones to Watch
🔵 Support Zones (Buy Zones)
3230–3208
→ D1 Fair Value Gap + unmitigated bullish OB + discount pricing
→ Valid only with clean bullish rejection. High interest for sniper entries if price returns.
3170–3154
→ Untapped daily OB + historical support wick + aligns with deeper discount zone
→ Stronger bounce zone if 3230 fails. Confluence with fib retracement & RSI likely oversold here.
🔴 Supply Zones (Sell Zones)
3420–3450
→ Premium FVG + D1 OB combo + previous bearish rejection wick
→ High probability inducement area. Valid only if price fails to hold 3344 flip.
3388–3402
→ Minor supply + internal structure break level
→ Short-term reaction area. Lower conviction but watch for rejection if price overextends.
🟡 Decision / Flip Zone
3327–3344
→ Former support now turned resistance
→ If this zone flips bullish and holds, bias shifts to continuation. If rejection occurs, confirms retracement deeper into discount.
✅ Conclusion
The market is entering a decision week — no rush. Let the chart guide you.
Clarity comes not from prediction, but preparation. This chart isn’t hindsight — it’s a live framework.
✨ Final Thought
If this chart feels clear, that’s because it was built with intention — not after the move, but before it happens.
The difference between noise and precision is structure.
And we don’t guess — we prepare.
🚀 If you appreciate detailed, real-time structure like this, hit follow and join the traders who value clean execution over hype.
💬 Drop your bias below — bullish or bearish this week?
📢 Disclosure: I use Trade Nation's broker feed on TradingView and I'm part of their influencer program.
📉 This is educational content and not financial advice.

EUR vs. CHF: Who Wins?EUR vs. CHF: Who Wins?
The Euro (EUR) is holding strong thanks to:
✔️ Germany’s new spending boosting growth
✔️ ECB done cutting rates (no big surprises ahead)
✔️ Weak USD helping EUR overall
But the Swiss Franc (CHF) is a tough rival because:
✔️ It’s a safe haven—up 11% in a year
✔️ Swiss National Bank (SNB) keeps it strong to fight inflation
✔️ Switzerland’s economy is stable (low inflation, steady growth)
What This Means for Traders:
If markets get nervous (wars, trade fights, etc.) → CHF gets stronger
If Europe’s growth stays solid → EUR could fight back
Right Now?
Not the best time to buy EUR/CHF
CHF could keep winning unless SNB changes its tune
Watch ECB & SNB speeches—any hints could move markets
Bottom Line: Wait for a clearer signal before trading this pair. CHF is the safer bet for now.
Trade smart—keep it simple! 🚀
Not a buy setup yet—wait for clearer signals.

XAUUSD Weekly Outlook | July 7–11, 2025“The market always whispers before it roars. The wise trader listens to structure.”
Hello beautiful minds 💬
We enter the second week of July with strong macro undercurrents and new structure shifts beginning to show. While the U.S. celebrated Independence Day, the market quietly set up key zones for next week’s liquidity sweep.
🔸 Macro & Geopolitical Overview
🟠 Geopolitics: Tensions continue post-BRICS Summit, with a focus on further de-dollarization talks.
💰 U.S. Economy: Consumer credit and NFIB small business confidence to kick off the week.
🔔 Big catalysts:
Wednesday: Fed speeches (Mouslem, Waller, Daly)
Thursday: Unemployment Claims + Bond Auction
Friday: Federal Budget Balance (a key fiscal stress indicator)
📉 Expect spikes in volatility mid-week and dollar reactions post-FOMC speeches.
🔸 WEEKLY BIAS:
Still bullish to neutral, but momentum is cooling inside a premium rejection range.
Price broke structure to the upside in May-June, forming a new weekly higher high (HH) above 3380 — but failed to hold convincingly above the volume imbalance (void zone) around 3430–3480.
We are now rejecting premium and hovering just under the 3327 level — previous institutional support and the midpoint of the weekly FVG.
🔹 Weekly Key Zones
🟢 Support zone to watch (buy interest)
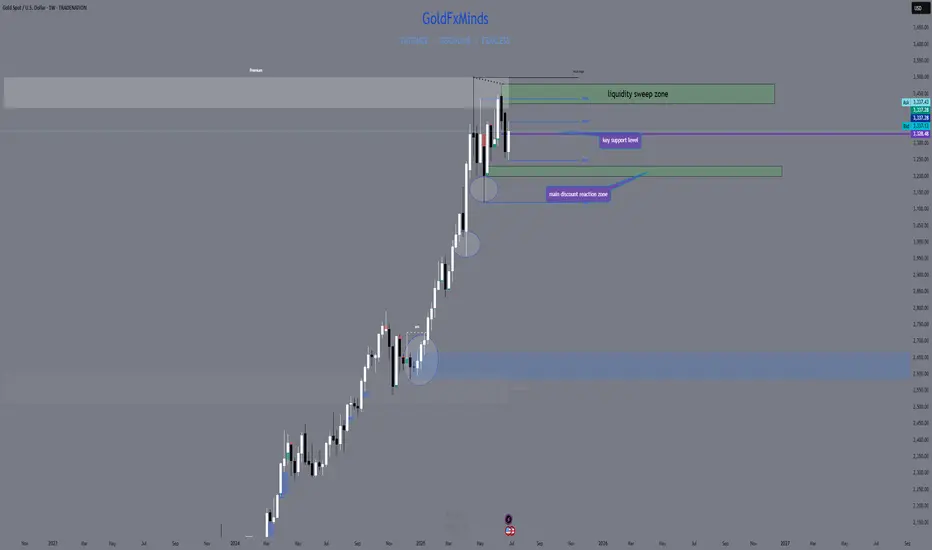
3204–3230 = Weekly FVG + equilibrium retrace + EMA50 rising
This is the main discount reaction zone. If price taps in with bullish PA, we look for bullish continuation toward 3327 then 3380.
🟡 Mid-level (decision point)
3327 = prior key support now acting as resistance
Watch how price reacts here — if it flips cleanly with a daily close, short-term bullish pressure may return.
🔴 Supply zone / resistance (sell interest)
3420–3480 = Weekly FVG + premium OB + liquidity sweep zone
This is the main premium rejection area. If tapped again without strong volume or fundamentals, this may fuel a swing short setup.
🔸 What This Means for You
This week is about patience and precision. The cleanest setups may come after volatility spikes during Fed speeches. Structure will tell — but emotional control will confirm.
If you feel like you’ve been chasing trades lately… this is the week to reset.
Focus only on sniper setups. Wait for them to form. Let others rush.
🔚 Final Words from the Team
Clarity beats chaos. Always. This weekly map is your compass — now it’s your job to wait, watch, and act with precision.
🔔 Follow GoldFxMinds for structured gold planning that respects both price and time.
🗨️ Drop a comment with your bias — bullish or bearish this week?
—
📌 Disclosure: This analysis is for educational purposes only and reflects market structure at the time of writing. No financial advice.
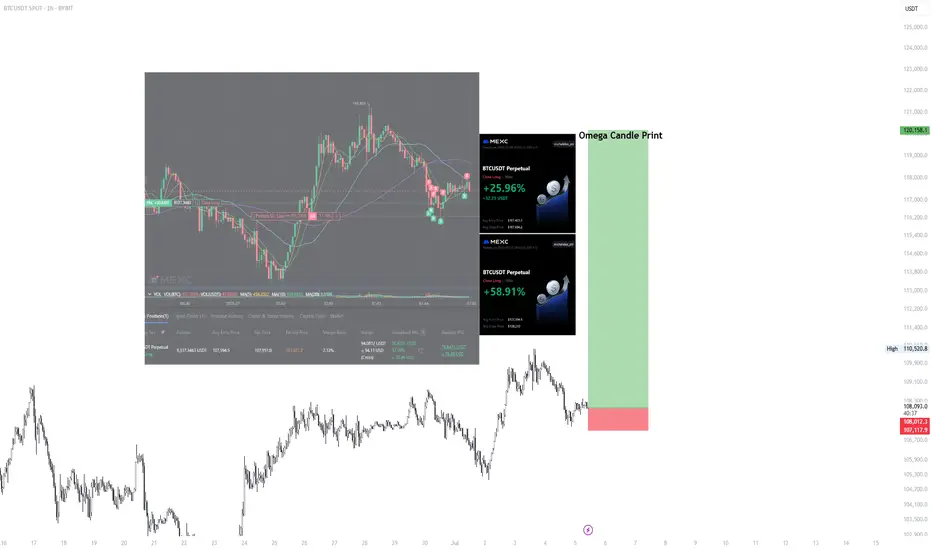
BTC/USDT BYBIT IDEA #2 – Local Range Hold and OMEGA CANDLE PRINTThis is my second Setup I am currently in - apart from going to 6h orderblock we will hold the LTF range and continue higher breaking new highs and starting price discovery.
Combined this with Bullish News could bring amazing BTC Run, followed by Altcoin Season in Mid August/September. If you look into Bitcoin Balance and the way this token is being bought and accumulated by institutions.
The way you know Bull Run is about to start is because no Grandmas and Taxi Drivers are talking about it.
I would not believe it myself but here we are.
The way I do this I keep my position running from lows (bought at 107 400) and I am buying LTF ranges for extra 30-40% of existing position and then closing around the same amount on highs of LTF like 15M-30M.
looking for longs, my SL is set for break even.
Good luck.
Trade Idea: Buy NZD/CADWhy NZD?
✅ Strong Exports: NZ posted a $1.2B trade surplus (dairy & goods booming).
✅ Economy Improving: GDP growing at 1.4%, RBNZ supportive.
✅ USD Weakness: NZD rising as the US dollar loses steam.
Why CAD Could Struggle?
⚠️ Oil Dependency: If crude prices drop, CAD suffers.
⚠️ US Trade Risks: Trump tariffs could hurt Canada.
⚠️ High Unemployment: 7% and rising—pressures BoC.
Trade Setup
🔹 Buy NZD/CAD (expect NZD to rise vs CAD).
🔹 Watch: NZ trade data, oil prices, US-Canada trade news.
What Could Go Wrong?
❌ Oil spikes → CAD strengthens.
❌ US-NZ trade issues → NZD weakens.
Verdict: NZD looks stronger short-term—good odds for this trade. 🚀

Why FPT?Starting first looking at what the company is doing.
AI
The buzz word of most news headlines.
$200 Million Investment: FPT has committed to a landmark $200 million investment to build an AI Factory in partnership with global chip giant NVIDIA. The goal is to create a complete ecosystem for AI development, offering not just the raw computing power (GPU infrastructure) but also the software platforms (FPT AI Studio) and expert consulting needed to build and deploy AI solutions.
This one ties AI and chips together:
University Collaboration: FPT University is a strategic asset. They are working directly with NVIDIA and other institutions like the VNU University of Technology to incorporate AI into their curriculum, aiming to help train the 30,000 to 50,000 AI and semiconductor engineers Vietnam needs by 2030.
Chips
FPT is targeting the design aspect of making chips and there is a lot of international demand to cut into China's monopoly. FPT being in Vietnam is already in a strategically significant area. Samsung is Vietnam's single largest foreign investor and happens to be able to fabricate chips. They also have multiple existing partnerships with FPT and are no strangers to working together. Compute is hottest commodity of the modern age. Though compute is the final product I'll go over how we get there.
First stage mine it
Vietnam has an estimated 3.5 million metric tons Rare Earth Reserves. The world's sixth largest reserves. The key challenge is converting this immense potential into actual production and processed materials. In 2024 Vietnam produced 300 metric ton. So there is a lot of room to grow.
Why this matters:
This national ambition is backed by a new, aggressive legal framework. Key policies like Resolution 10-NQ/TW and the new Law on Geology and Minerals (effective July 1, 2025) mandate that raw ores must be processed in-country and explicitly push for Vietnamese companies and their partners to lead the charge. This strategy aims to prevent the export of raw minerals and build a complete high-value supply chain within Vietnam.
While FPT is not a mining company, these laws are designed to create a stable domestic supply of processed rare earths and high-value materials. This is a critical long-term advantage for a company like FPT aiming to build a world-class semiconductor design center, as it ensures future access to a secure, local supply chain.
Stage 2 is processing
Multiple countries are working on doing this. It's very complicated and the struggle seems to be making in cost effective outside of China.
Stage 3 Design
Conceptualizing the chip's architecture. (Fabless companies like NVIDIA do this). This is precisely the high-value role FPT is targeting.
Stage 4 Fabrication
This is mostly TSMC and Samsung. It's why Taiwan and chips is so related. Also worth mentioning Samsung not do fabrication in Vietnam. It does it in South Korea.
Stage 5 Assembly, Test, and Packaging (ATP)
Cutting the finished wafers into individual chips, assembling them into protective packages, and testing them to ensure they work. Companies like Intel and Samsung already do this in Vietnam.
Telecommunications Segment
While its growth is more modest (around +11.3% in 2024), it is highly profitable and provides consistent, predictable cash flow that helps fund the high-growth initiatives in the Technology segment.
Education & Other Investments
The education section has 1 simple con and that's birthrates in Vietnam. Currently below the replacement rate but effort is being made to change that. Other then that it's all good news. Over the last 50 years Vietnam has gone from it being common to have some elementary school education but no high school or university or English. To pumping out highly educated English and Vietnamese speaking students ready to take on global competition. This factory of new skilled workers means both proud parents and a nation about to steal the spotlight on a global stage. Vietnam while a small country by land mass makes up for it in a population of 100 million and a relentless work ethic. It's the definition of hard times make strong people and strong people make good times. The good times are coming. Why this matters to FPT Education? Good education costs money but it also makes $$$. With this new labor force they will be able to afford great education for the next generation. What else? Well when you got great education other people will use it. Looking forward, as Vietnam solidifies its status as a stable, high-tech hub, it's plausible that its top-tier educational institutions, like FPT University, will attract foreign students, creating an entirely new, high-margin revenue stream that is likely not on most investors' radar today.
Price Chart
Price is sitting on the weekly 8 SMA. Waiting for a move above 122000 VND this is the next FIB retracement level. Right now we have a possible low at 106000 VND and possible higher low at 115000 VND . Stoploss at 110 000 VND means that upside potential is way bigger then the downside risk. To be clear the stoploss can't be at 114900 while this might work with low volatility stocks on larger US exchanges. The risk of getting wicked out of a position here on HOSE is way different. My optimistic target right now would be 190 000 VND and FIB retracement projection is 192 500 VND. Most likely I'll take profit before that.
MACD cross
MACD is still bearish there is a chance of a cross in the next few weeks.
Daily saw a nice move up. It's also very close to attempting a cross up. It's bearish but allows for an asymmetric trade when down side stop loss can be small. While upside can be huge. Lose small and win big. I opted for tight stoploss rather then waiting for signals to all line up. Some people might be less aggressive but not waiting here is about identifying in the price favorable conditions for minimal downside. Meaning it's clear where the position become invalid.
RSI
The daily RSI has a really nice double bottom. To me this increases the likelihood of a reversal substantially.
Stoch RSI
With Stochastic RSI continuing to move up we should know soon if this position is correct of not.
Disclaimer:
The information provided in this post is for educational and informational purposes only. It does not constitute financial advice, investment recommendations, or a solicitation to buy or sell any financial instruments. All investments involve risk, and the past performance of a security, market, or trading strategy does not guarantee future results. I am not a financial advisor. Please conduct your own thorough research and consult with a qualified financial professional before making any investment decisions. You are solely responsible for any investment decisions you make.

XAUUSD 02.07.2025 (reentry)+ US data (ISM, JOLTS) Beat
~+ Powell sounded a bit hawkish
~+ Timing: not much time is left until the end of the week because of Independence Day; USD is stretched down - expected profit taking
~- US BB Bill passed
XAUUSD 02.07.2025+ US data (ISM, JOLTS) Beat
~+ Powell sounded a bit hawkish
~+ Timing: not much time is left until the end of the week because of Independence Day; USD is stretched down - expected profit taking
~- US BB Bill passed
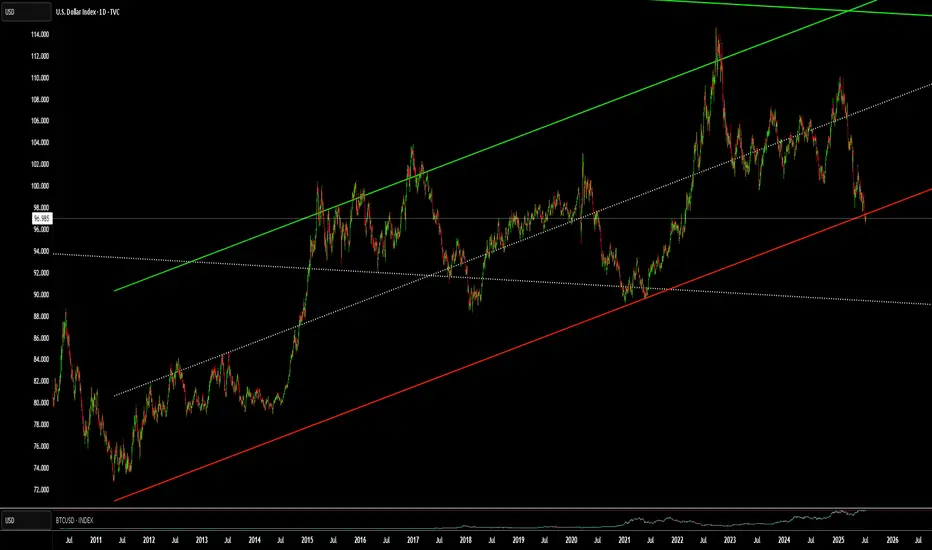
WHy is everyone Freaking out over the DXY !?!?!Here is a chart of the DXY. with a linear regression channel plotted over it. Yes, we are close to the bottom of the channel. But we are no where near an all time low. Far from it. The DXY may be due for a push, but even if it was to drop more it would not be that big of a deal relative to historical patterns.
ETHUSD POTENTIAL LONGETHUSD potential bullish setup ↗️
ETH still showing bullish momentum. Might bounce on the bullish trend line, for now it’s hasn’t done the third touch so expect it go lower to the trendline first. A strong bullish confirmation would be a signal to go LONG. Share your thoughts on this in comment section.


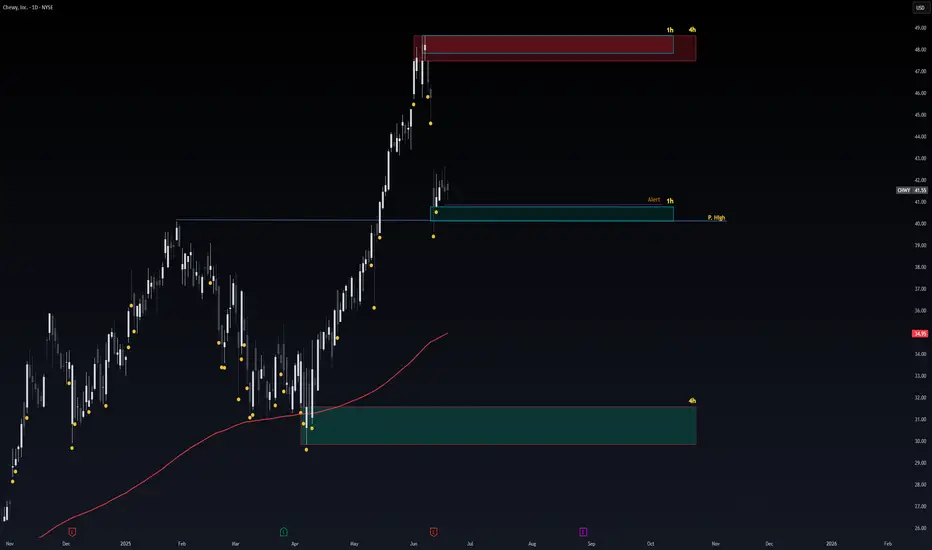
Safe Entry ZoneStock current at Support Level.
P.High's (Previous Highs) acts as good Support and resistance level.
1h & 4h Green Zone Is Buying Zone.
4h Red Zone is Selling Zone.
If No Buying Power at current Price level 4h is safest Entry Zone.
Note: 1- Potentional of Strong Buying Zone:
We have two scenarios must happen at The Mentioned Zone:
Scenarios One: strong buying volume with reversal Candle.
Scenarios Two: Fake Break-Out of The Buying Zone.
Both indicate buyers stepping in strongly. NEVER Join in unless one showed up.
2- How to Buy Stock:
On 15M TF when Marubozu Candle show up which indicate strong buyers stepping-in.
Buy on 0.5 Fibo Level of the Marubozu Candle, because price will always and always re-test the imbalance.
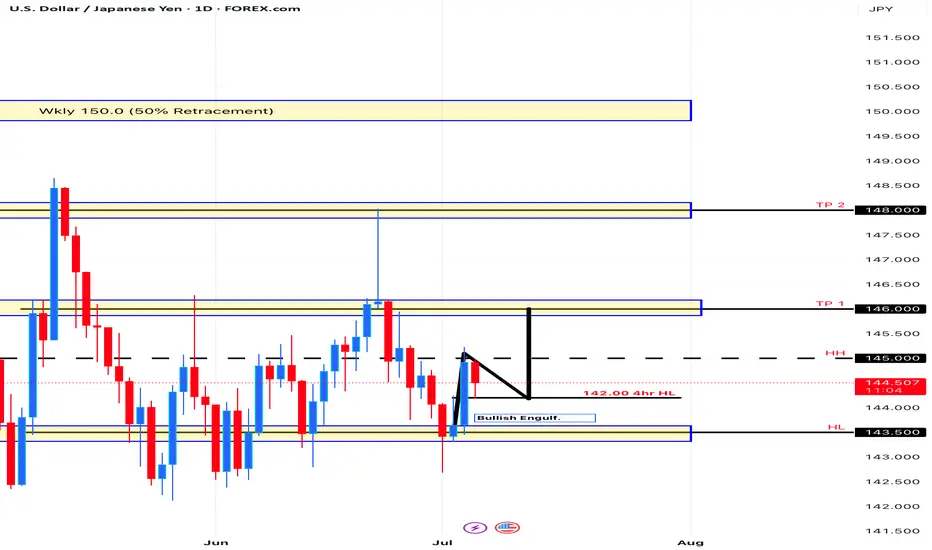
Uptrend USD/JPYDaily - uptrend
4hr- uptrend
Price hit a key level at 145.000
We can possibly see a retrace back to the 4hr HL @ 144.200 then shoot up to the 1st TP @ 146.000
SOL REJECTED AT RESISTANCE SOL with evening star candlestick pattern on 1D, two zones are my areas to watch for next coming days
