USD/CHF - Bearish Flag (24.07.2025)Fundamental Updates :
Dollar falls - New Trade agreement and uncertainties in Market :
President Donald Trump announced a trade deal on Tuesday with Japan, which lowers tariffs on auto imports to 15% in exchange for a $550 billion package of U.S.-bound investment and loans.
The USD/CHF Pair on the M30 timeframe presents a Potential Selling Opportunity due to a recent Formation of a Bearish Flag Pattern. This suggests a shift in momentum towards the downside in the coming hours.
Possible Short Trade:
Entry: Consider Entering A Short Position around Trendline Of The Pattern.
Target Levels:
1st Support – 0.7878
2nd Support – 0.7855
🎁 Please hit the like button and
🎁 Leave a comment to support for My Post !
Your likes and comments are incredibly motivating and will encourage me to share more analysis with you.
Best Regards, KABHI_TA_TRADING
Thank you.
Disclosure: I am part of Trade Nation's Influencer program and receive a monthly fee for using their TradingView charts in my analysis.
Fundamental Analysis

USD/CHF - Bearish Flag (24.07.2025)The USD/CHF Pair on the M30 timeframe presents a Potential Selling Opportunity due to a recent Formation of a Bearish Flag Pattern. This suggests a shift in momentum towards the downside in the coming hours.
Possible Short Trade:
Entry: Consider Entering A Short Position around Trendline Of The Pattern.
Target Levels:
1st Support – 0.7878
2nd Support – 0.7855
🎁 Please hit the like button and
🎁 Leave a comment to support for My Post !
Your likes and comments are incredibly motivating and will encourage me to share more analysis with you.
Best Regards, KABHI_TA_TRADING
Thank you.
Disclosure: I am part of Trade Nation's Influencer program and receive a monthly fee for using their TradingView charts in my analysis.

Some investors take profits. Opportunity to buy gold to 3500?✏️ OANDA:XAUUSD price correction of 50 appeared yesterday. This is obvious to happen in a sustainable uptrend. Today's strategy will look for liquidity sweeps to support to BUY to ATH 3500. Gold's current border zone is limited by the upper and lower trendlines. Be careful not to trade against the trend when breaking the trend zone.
📉 Key Levels
Support: 3375 -3363
Resistance: 3418-3431-3490
Buy trigger: Buyers react at 3375
Buy zone: 3363
Target: 3430; level higher at 3490
Leave your comments on the idea. I am happy to read your views.

From 3,430 USD GOLD falls below 3,400 USD on optimistic newsOANDA:XAUUSD has suffered a sharp sell-off after rising sharply earlier in the week. Media reports said the United States and the European Union were getting closer to reaching a tariff deal, and the news weighed on safe-haven demand.
OANDA:XAUUSD fell below $3,400 an ounce on Wednesday, down more than 1.2%, following news that the United States and the European Union were close to signing a deal similar to the one Washington and Tokyo signed on Tuesday. It is now trading below that key base point.
The European Union and the United States are moving toward a trade deal that could see more EU goods hit with a 15 percent U.S. import tariff, two diplomats said. Earlier, U.S. President Donald Trump reached a trade deal with Japan that would cut auto tariffs to 15 percent.
Optimism about an imminent U.S.-EU trade deal overshadowed a decline in the U.S. dollar. The U.S. dollar index (DXY), which measures the greenback against a basket of six currencies, fell 0.05 percent on the day to 97.160.
U.S. Treasury yields rose, with the 10-year Treasury yield rising to 4.396%. U.S. real yields, calculated by subtracting inflation expectations from nominal yields, rose nearly 4 basis points to 1.994%.
Gold tends to gain in value during times of uncertainty and low-interest-rate environments because gold itself does not generate interest, and in low-interest-rate environments, the opportunity cost of holding gold is relatively low.
U.S., EU near trade deal
The Financial Times reported on Wednesday that the European Union and the United States are close to reaching a trade deal that would impose a 15% tariff on imports from Europe, similar to the one reached between US President Donald Trump and Japan this week.
The Financial Times reported that Brussels is likely to agree to so-called “reciprocal tariffs” to avoid tariffs that Trump has threatened to impose on EU goods of up to 30% from August 1.
“The agreement reached with Japan is clearly extortionate in terms. Most member states are swallowing their anger and are likely to accept the deal,” an EU diplomat said.
The two sides will exempt some products, including aircraft, spirits and medical equipment, from tariffs.
The agreement between the US and Japan has also left Brussels reluctant to accept higher reciprocal tariffs to avoid a damaging trade war, according to the Financial Times.
Technical Outlook Analysis OANDA:XAUUSD
On the daily chart, after gold reached its target at $3,430, it failed to break above this important resistance level and fell slightly. The decline brought gold back to test the support confluence area, which is the location of the 0.236% Fibonacci retracement with the lower edge of the price channel. And with the current position, gold still technically has enough conditions for a possible increase in price.
Specifically, gold is still in/above the supports from the short-term price channel, the long-term rising price channel and the support from the EMA21, as long as gold is still trading above the EMA21, it still has a bullish outlook in the short term. On the other hand, the short-term target is still at 3,430 USD, while once the 3,430 USD level is broken, it will provide the possibility of further upside with the next target at around 3,450 USD in the short term, more than the all-time high.
RSI remains above 50, far from the 80 – 100 area (overbought area). Showing that there is still a lot of room for upside ahead.
During the day, the technical outlook for gold prices continues to favor upside and notable positions will be listed as follows.
Support: 3,371 – 3,350 USD
Resistance: 3,400 – 3,430 – 3,450 USD
SELL XAUUSD PRICE 3421 - 3419⚡️
↠↠ Stop Loss 3425
→Take Profit 1 3413
↨
→Take Profit 2 3407
BUY XAUUSD PRICE 3354 - 3356⚡️
↠↠ Stop Loss 3350
→Take Profit 1 3362
↨
→Take Profit 2 3368
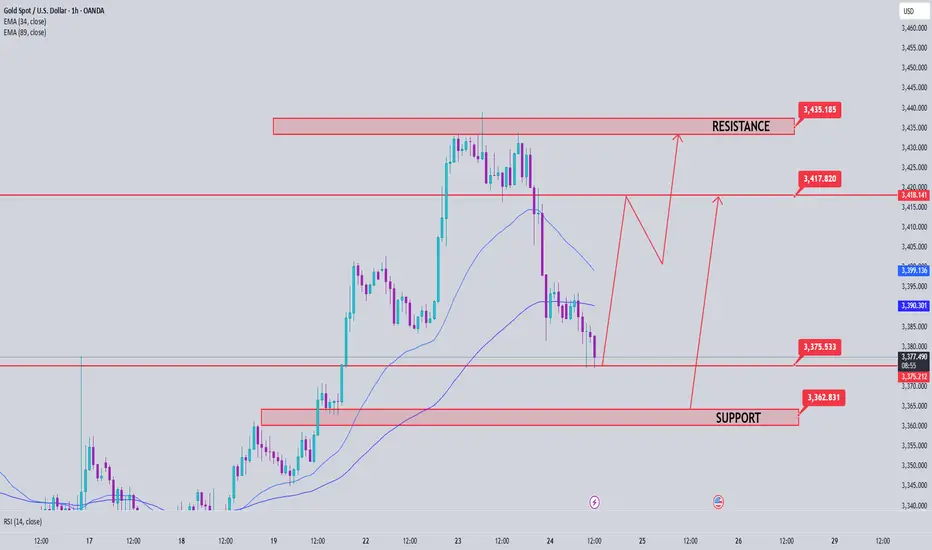
Gold Price Analysis July 24After a correction of about 50 prices in yesterday's session, gold is showing a necessary "breathing" in the long-term uptrend. This is a positive signal, showing that the market is accumulating before continuing its journey towards a new ATH around the 3500 area.
Currently, gold prices are fluctuating within the boundary zone limited by two upper/lower trendlines - creating a clear structure of support and resistance. Avoid trading against the trend if this boundary zone is broken.
📌 Trading plan:
Strategy: Prioritize BUY when price sweeps to support zone
Active buy zone: 3375 (reaction price)
Potential buy zone: 3363 (deep support)
Target: 3431 in the immediate future → further towards 3490
Support: 3375 – 3363
Resistance: 3418 – 3431 – 3490
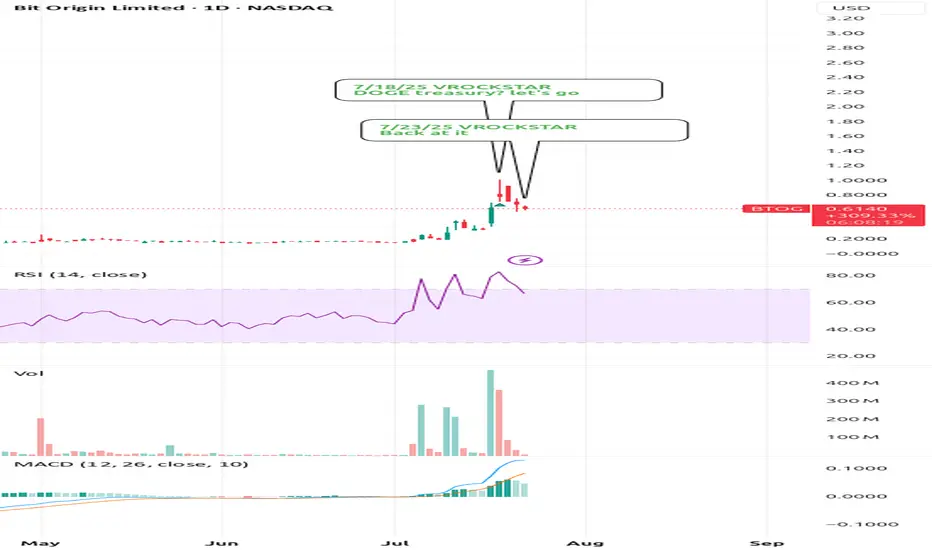
7/23/25 - $btog - Back at it7/23/25 :: VROCKSTAR :: NASDAQ:BTOG
Back at it
- not much to say except this thing holds about 70c worth of CRYPTOCAP:DOGE
- CRYPTOCAP:DOGE < $BTC. let's get that out of the way
- i certainly don't think a "doge" or "eth" or "sol" or whatever crapcoin treasury company is similar to MSTR. again let's get that out of the way
- but you're basically buying the inevitable DOGE ETF here at something like 15% off, (for now spot can always go lower)
- will keep my finger off the trigger if i focus on my NYSE:FI buy today (now up to 20% size from minuscule y day) and now i'm trading this thing (for fun)
V
7/24/25 - $joby - Lol... gl making money here7/24/25 :: VROCKSTAR :: NYSE:JOBY
Lol... gl making money here
- have long followed the evtol "space" which is a bit more quantum-mechanical in nature... because it "is here" and also "not here"
- will be a long wait here
- somehow retail $ has allowed story tellers to write season after season of "wait and trust me bro" and this is no exception
- perhaps they are a winner
- but this valuation doesn't even require an explanation, sorry (heuristics, and i could get into it if anyone is genuinely curious and not going to just write silly short retorts - happy to debate)
- with that being said this will likely find it's way right back to the single digits, sooner vs later
- welcome to the short portfolio JOBY... you're joined with 10 other small positions that should make you feel like part of the club. i keep em small, so emotion stays ice cold, and when i run em big, i will make a comment. but until then. comfy short here, almost a lobotomized position for a hedge to my long book in this whacky tape
V

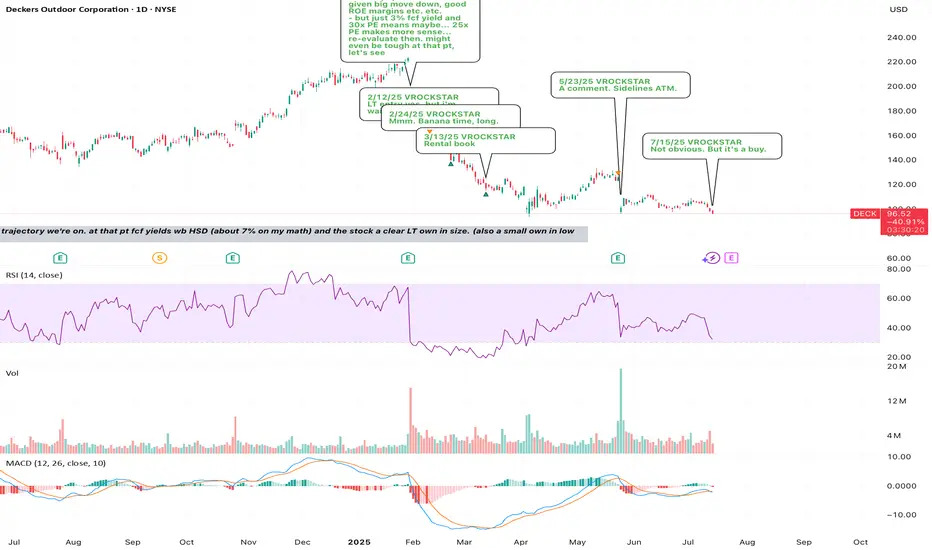
7/15/25 - $deck - Not obvious. But it's a buy.7/15/25 :: VROCKSTAR :: NYSE:DECK
Not obvious. But it's a buy.
- will reiterate that i'm not on tape so closely this week, but will revert w any comment replies by next week; nevertheless i'm checking in here on the tape
- see what T did today on NVDA/ China?
- you think it's easier or harder to resolve some of these discretionary names in the meanwhile vs. nvda H20s to China?
- exactly.
- even NKE put up pretty barfy numbers and the stock was like well... who cares
- i think we're reaching that point with NYSE:DECK here after seeing NYSE:NKE , then reading between the lines on NASDAQ:NVDA ->consumer/discretionary tariffs etc. etc.
- rates will come down, the consumer is tapped out, new fed chair on deck etc. etc.
so the way I'm playing this:
i've bought some ITM calls for aug 15 expiry. why? because it allows me to get proper MSD size (3-4%) but pay only 30-40 bps (10x leverage). the thinking is this... if stock pukes on this result, i'm high conviction that 80% scenario i'd want to load TF up. and if it rips/ or if T has a favorable bowel movement in the meantime... this will rip and off the *extreme* (remember - extreme positioning always gets you the best rewards... but TA doesn't tell you where the bottoms are as much as fundamentals IMVVVHO)... then you get a double whammy and stock is back in the $110s+. so the R/R is v good. but i don't want to get crushed if the stock/ macro work against me and need some wiggle room.
eye'ing LULU too.. but i like valuation and R/R on NYSE:DECK better esp given the NYSE:NKE print and their multiple-brand-multiple-disty strategy vs. say lulu's own-disty strategy.
V

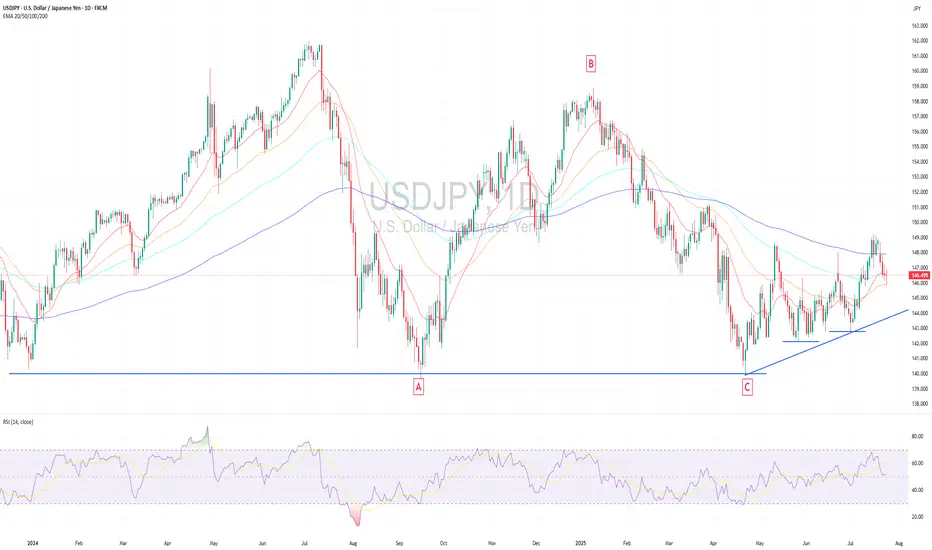
USDJPY may have already found its bottom and is now on a rising USDJPY may have already found its bottom and is now on a rising path
Technical Analysis USDJPY found long-term horizontal support (1.5 yrs) at 140.00 in April and began a slow rebound, forming consistent higher lows—signaling strengthening bullish momentum despite no clear breakout yet.
The EMAs across multiple timeframes are starting to converge after an extended bearish phase for months, indicating a possible bullish reversal as momentum shifts.
From an Elliott Wave perspective, the correction phase appears to have completed a full three-subwave, with Wave C ending at the same level as Wave A—forming a "Regular Flat Corrective Wave." This means USDJPY may now in an early stages of a new bullish impulse wave, signaling potential for extended upside.
If USDJPY can break and close above the previous high near 150.00, it would confirm the bullish reversal and could further strengthen upward momentum.
However, this analysis would be invalidated if the price closes below the key support around 142.00, in particularly if it drops below 140.00, which could signal a significant deeper downside.
Macroeconomic Analysis
In the long term, Japan has already passed its golden era driven by the Baby Boomer workforce and has now in an aging society. This structural demographic shift is reducing Japan's economic dynamic by slowing growth in productivity and overall consumption. As a result, demographic headwinds will likely weigh on Japan’s long-term economic momentum.
Japan’s tech and industrial edge, once dominant in autos and electronics, has eroded under pressure from China and South Korea, weakening long-term competitiveness and weighing on the yen.
On the trade front, Trump’s tariffs have reshaped global trade, hurting Japan’s export-led sectors like steel and autos. This likely reduced Japan’s trade surplus with the U.S., and by economic theory, this will cause the yen to weaken against the dollar. (Although the yen has recently strengthened due to President Trump’s announcement on Wednesday that Washington and Tokyo had reached a trade agreement, this is likely just a short-term market sentiment that will fade.)
In the near term, political uncertainty is also weighing on the yen. The Liberal Democratic Party's loss in the Upper House elections could hinder the government's legislative efforts. Rumors that PM Ishiba plans to resign could further undermine investor confidence in the yen.
Moreover, an uncertain impact of US tariffs on Japan makes it unlikely that the Bank of Japan (BoJ) can raise interest rates soon. This supports the continuation of the Yen Carry Trade, putting additional pressure on the yen.
Japan’s July Manufacturing PMI stayed in contraction at 48.8, while services slightly recovered. Q1 2025 GDP shrank -0.7% QoQ (annualized), reinforcing slowdown concerns and limiting BoJ’s room to hike rates.
Japan needs a new S-curve driver—like a tech revolution—to regain strong growth and restore confidence in the yen. Without it, further yen depreciation is likely.
Analysis by: Krisada Yoonaisil, Financial Markets Strategist at Exness
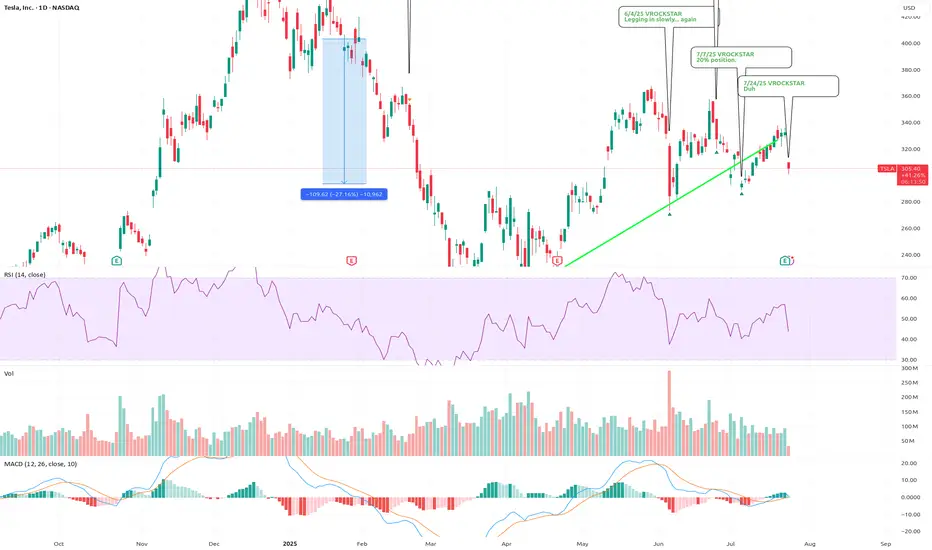
7/24/25 - $tsla - Duh 7/24/25 :: VROCKSTAR :: NASDAQ:TSLA
Duh
- ppl focused on ST FCF (all over X!) is 100% of the reason why when you put the pieces together, you realize that while ST this might not behave like anyone expects... LT, TSLA is v likely going to in, elon's own words, be the largest cap in the history of capital markets
- two leading robots with leadership position in IRL AI
- profitable, is all that matters
- have not yet hit the S-curve
was super lucky to trim some of this last week
now i'm back to sizing into a full position, not yet there like on that silly political dump, but i'm nearly 10% (20% is my max size).
V
7/23/25 - $orly - priced for perfection7/23/25 :: VROCKSTAR :: NASDAQ:ORLY
priced for perfection
- hard to not consider this as a hedge to my NYSE:DECK long (into tmr print)
- stock has had series of weak Q's
- google trends remains meh
- stock not cheap at <3% fcf yield (staples closer to 3.5%+)
- IV on the chain seems lazy... not pricing in much move
- i'd sense that the upside is quite limited and the downside is probably 2-3x the upside
- so while it's not a 9/10 idea (like the push i made on say BOATS:FI after the open this morning - which worked very well and now back to a comfy spot w ITM leaps)... it's a nice filler position on the hedge side, i think
- and honestly it's also a situation where we flip the river card and the stock rips on mediocre restuls... and that tired stock chart just wants to flip bearish, even if it's just a temporary pause before heading higher
- i look at this and i know the personalities that own it
- i'll take under, fam
V

chfjpy (SHORT)
Both CHF and JPY are safe heavens on Market but...
Japan weakens its currency during winter coming close to Summer holidays in Europe to attract more tourist as a cheap holiday destination.
Its summer holidays now

ChatGPT Claims $ADA Is Waking Up – Could $3 Be Back on the TableWith Cardano (ADA) showing renewed momentum, speculation is resurfacing about whether it can approach its $3 all-time high. While ChatGPT-powered analysis highlights early signs of revival, measured expectations and strategic planning are essential.
ADA’s Technical Setup: Signs of Uptick
Whale accumulation: Large wallets are steadily acquiring ADA, hinting at long-term confidence.
EMA crossover: ADA’s 50-day MA recently crossed above the 200-day MA—a bullish omen.
Volume confirmation: Price increases are backed by rising trade volume, strengthening the signal.
This alignment suggests ADA may be entering a steady upward phase.
Ecosystem Growth Driving Optimism
Vasil upgrade legacy: Network throughput improvements and reduced fees remain strengths.
DeFi & NFT traction: Over 30 smart contracts launched recently, signaling healthy usage.
Strategic partnerships: Engagements in green finance and digital identity add real use-case value.
Together, these factors strengthen ADA’s fundamentals and investor sentiment.
Sizing Up the $3 Benchmark
Market cap scale: To reach $3, Cardano’s market cap needs to expand by approximately $90 billion—a significant leap.
Past performance context: ADA flirted with $3 in late 2021 but lacked supporting network activity to sustain it.
Trigger dependency: Institutional adoption, DeFi hubs, or major fiat tie-ins are likely prerequisites for a breakout.
A controlled climb toward $2 seems more realistic, with a push beyond requiring major catalysts.
Investor Considerations
Staggered entry (DCA): Consider accumulating between $1.20–$1.40.
Profit-taking strategy: Partial exits at $2 and $2.50+ help lock in gains while maintaining exposure.
News monitoring: Watch new dApp launches, development updates, and community announcements.
Portfolio balance: ADA is best held alongside BTC, ETH, and select altcoins to mitigate risk.
Final Take
On-chain momentum and ecosystem signals suggest Cardano is moving off the sidelines. However, an overnight surge to $3 is unlikely without significant developments. By combining thoughtful accumulation with active monitoring and disciplined risk management, investors can position themselves to benefit if ADA continues its upward trajectory in 2025.
Best Meme Coins Live News Today: Latest Opportunities & UpdatesIn the fast-paced world of meme coins, today’s market presents fresh opportunities for both new and seasoned investors. With community-driven narratives dominating, identifying the best meme coins means staying updated on project fundamentals, social sentiment, and tokenomics. Here’s a detailed overview of the live scene and emerging opportunities shaping the meme coin landscape in 2025.
1. ShibaX (SHIBX): Riding the Dog-Themed Wave
Why it’s trending:
ShibaX combines the beloved Shiba Inu dog theme with practical features—NFT integration, staking, and cross-chain bridges. These elements have reignited investor interest.
Latest updates:
New staking platform launched on Ethereum and BNB Chain, offering up to 20% APY.
Roadmap reveal includes “ShibaX Arcade,” a gaming platform with meme lore-based mini-games.
DeFi integrations allowing SHIBX to be used as collateral in lending protocols.
Investor take: Strong branding with concrete utility upgrades could offer both hype-driven spikes and sustained growth.
2. BabyDoge Gold (BABYG): Rising from Origins
Why it’s trending:
A spin-off from the original Baby Doge Coin, BabyDoge Gold aims to redefine tokenomics with enhanced burn mechanisms and community engagement.
Latest updates:
Fix for liquidity token bug was addressed within 24 hours—boosting retail confidence.
Marketing campaign “Golden Paw” launched, expanding reach via YouTube and local crypto meetups.
25% token burn event announced to reduce supply and strengthen price over time.
Investor take: While still early-stage, BABYG’s quick fixes and supply-control measures are positive indicators—though caution remains necessary.
3. Floki EDU (FLOKIEDU): Meme Coin with Purpose
Why it’s trending:
Floki EDU differentiates with a strong emphasis on educational initiatives, publishing free courses about token fundamentals, security, and blockchain literacy.
Latest updates:
Partnership with a blockchain academy in India, enabling FLOKIEDU use in classrooms.
Interactive Telegram quiz bots reward users with tokens.
Pending centralized exchange listings, subject to community votes.
Investor take: Combining mission-driven goals with token utility adds long-term resilience beyond hype.
4. ElonDoge (ELDOGE): Fan-Focused Franchise
Why it’s trending:
Capitalizing on Elon Musk’s Dogecoin fandom, ElonDoge remains a cult favorite with its viral campaigns and high-yield staking pools.
Latest updates:
Limited-time pools with 150% APY to attract quick inflows.
Merchandise integration includes NFTs and apparel tied to Elon-themed meme culture.
"Space Chatter" Telegram community holds frequent AMAs, enhancing engagement.
Investor take: High-risk, high-reward dynamics—suitable for short-term momentum traders rather than long-term holders.
Final Thoughts
Despite the chaotic nature of meme coins, coherence between community strength and utility can spell significant returns. Coins like ShibaX and Floki EDU have moved beyond mere novelty, offering real functionality. Meanwhile, BabyDoge Gold and ElonDoge are high-volatility assets rooted in meme culture.
For traders, blending these project types can hedge risks. Stay vigilant, track updates, and always manage positions with discipline—this approach ensures readiness for the next meme market surge.

BTCUSD NEW OUTLOOKBTCUSD market Continuously running in both sides from last couple of days now market will be touch the support zone you have to great chance to go long from
SOPPORT ZONE if you want
TRADE AT YOUR OWN RISK
REGARD ALBERT

XAUUSD Expecting bullish Movement Gold is currently testing a strong demand zone between 3340 to 3335, which previously acted as a support area. The price action indicates potential for a bullish reversal from this zone, supported by oversold conditions and historical reaction levels.
Entry Zone: 3340 to 3335
First Target: 3375
Second Target: 3390
Two potential scenarios are highlighted:
A direct bullish reversal from the 3340–3335 zone
A slight consolidation before continuation to the upside
This setup offers a favorable risk-to-reward opportunity for intraday or short-term swing traders. Monitor price action confirmation signals before entering

XAUUSD
XAUUSD Updated in H1 :
The gold signal is marked on the chart based on the latest price changes and the supply and demand in the market. These points include the entry point, stop loss, and take profit

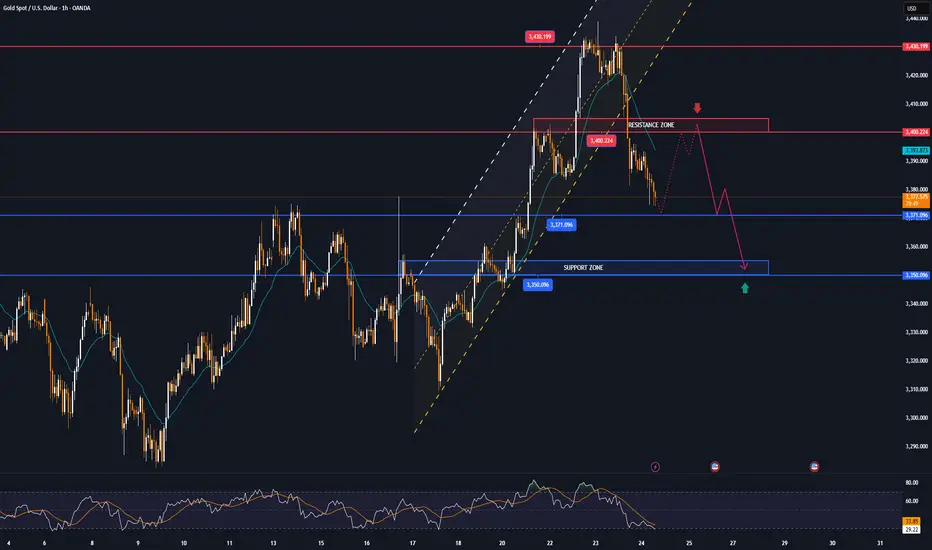
Gold Fails at Resistance, Elliott Wave Signals Deeper CorrectionGold ( OANDA:XAUUSD ) started to rise after the Richmond Manufacturing Index(Actual:-20/Forecast:-2/Previous-7) index was announced, but failed to break the upper line of the ascending channel and the Resistance zone($3,451-$3,406) .
Gold has now broken through the Support lines and is attempting to break through the next Support lines and Support zone($3,394-$3,366) .
In terms of Elliott Wave theory , it appears that the main wave Y has completed above the ascending channel.
I expect that given the momentum of gold's decline , gold will be able to break the Support zone($3,394-$3,366) and Support lines and fall to at least $3,356 . The next target could be the lower line of the ascending channel .
Note: Stop Loss (SL) = $3,423
Gold Analyze (XAUUSD), 1-hour time frame.
Be sure to follow the updated ideas.
Do not forget to put a Stop loss for your positions (For every position you want to open).
Please follow your strategy; this is just my idea, and I will gladly see your ideas in this post.
Please do not forget the ✅ ' like ' ✅ button 🙏😊 & Share it with your friends; thanks, and Trade safe.

I went Short here's why...First of all, I know that this is a risky position to be in, but I decided short anyway.
It is easy to locate past final highs; so, we safely can say that the point of analysis is to find highs in the future.
I might be wrong, but for the period of this week, and maybe the week after, I've decided to go short. But I don't know about after next week.
Shift your Stop-loss according to movements.
Don't put a Take-profit until you're concrete and, don't look back.
Stay responsible and, stay relaxed. 👍🏻

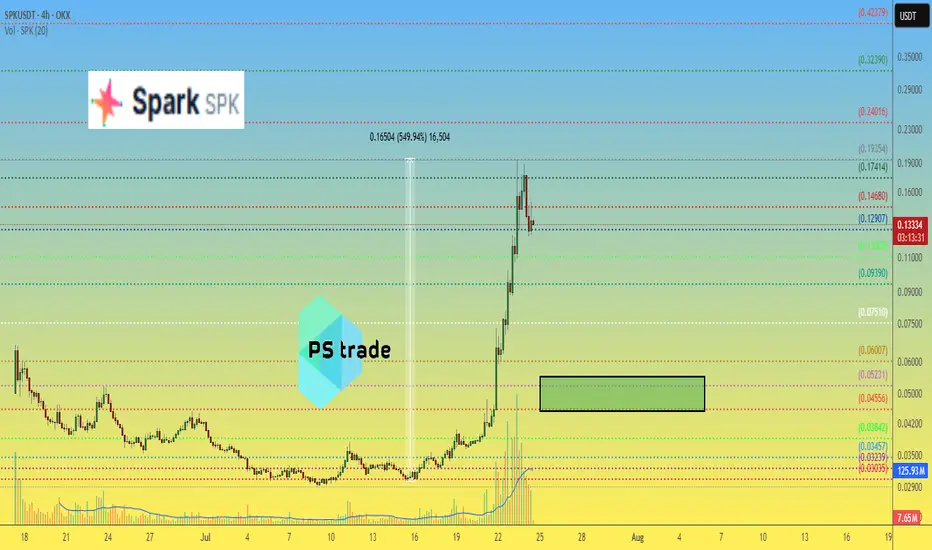
Spark SPK price analysisThis day has come and a new trend-narrative is emerging ?
Instead of memecoins on CRYPTOCAP:SOL , projects from the CRYPTOCAP:ETH ecosystem will now shooting ?)
The #SPK coin has made + 550% in less than 10 days
and the capitalization of the #Spark project is "only" $150 million.
We personally do not feel comfortable buying at the current price of OKX:SPKUSDT
At $0.045-0.055 it would be much more comfortable
But it's definitely worth watching, maybe this narrative will be the same "money" button in the future ?)
What do you think?
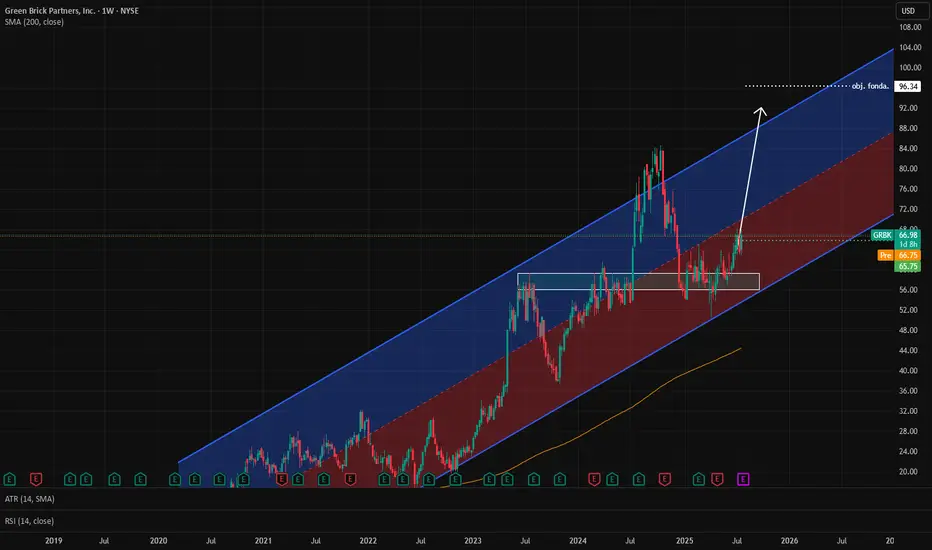
GBRK: Fundamental Analysis +46 %With 2024 revenue of $2.1 billion, Green Brick Partners is the 3rd largest builder of single-family homes in the Florida, Georgia, and Texas regions. EverStock identifies a fundamental revaluation potential of + 46 %.
Valuation at 7.7x net earnings
Currently valued at $2.94 billion, Green Brick Partners posted a profit of $382 million in its latest fiscal year (2024).
Balance sheet and debt
In Green Brick’s latest annual report, tangible net asset value stood at $1.58 billion, giving a market capitalization / tangible net asset value ratio of 1.75.
The gearing ratio is excellent, at 0.24.
Current share price : $66.98
Target price : $97.57
Upside potential : + 46 %
Dividend : $1.44
Yield : 2.15%
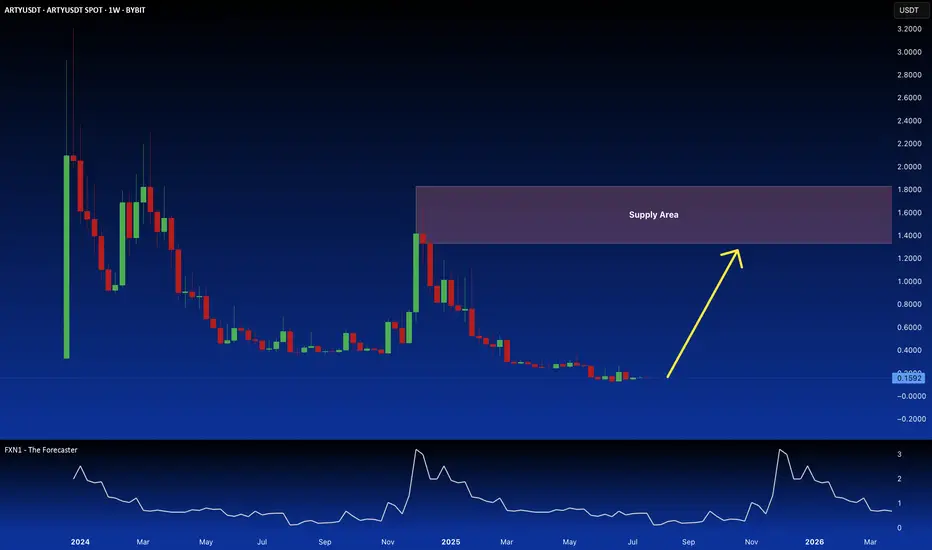
Artyfact: Redefining Gaming Through Cutting-Edge AI InnovationThe gaming industry is undergoing a seismic shift, driven by artificial intelligence—and Artyfact is at the forefront of this revolution. By harnessing the power of AI, Artyfact is not just enhancing gameplay but reimagining how games are created, experienced, and secured.
Transforming Game Development with AI
Artyfact’s groundbreaking AI solutions are setting new standards across multiple aspects of gaming:
AI-Powered NPCs – Gone are the days of predictable enemies. Artyfact’s NPCs learn, adapt, and evolve based on player behavior, delivering unprecedented realism and challenge.
Dynamic Content Generation – Games now craft unique levels, quests, and narratives in real-time, tailored to each player’s style and decisions.
Advanced Cheat Detection – Fair play is ensured through AI-driven anti-cheat systems that detect and neutralize exploits, keeping competition honest.
AI Testing & Optimization – Development cycles are accelerated with automated bug detection, reducing glitches and improving game quality before release.
Player-Experience Modeling – By analyzing behavior patterns, Artyfact’s AI personalizes gameplay, ensuring maximum engagement and satisfaction.
Data-Driven Enhancements – Continuous insights from player analytics refine mechanics, balance gameplay, and shape future updates.
The ARTY Token: Powering the Ecosystem
At the heart of Artyfact’s ecosystem is ARTY, a deflationary cryptocurrency and governance token. Integrated across multiple blockchain-based games, ARTY serves as both in-game currency and a tool for community-driven decision-making, empowering players and developers alike.
Major Catalyst: Play-and-Earn Mode Goes Live
Artyfact recently launched its first Play-and-Earn mode, a game-changer that is expected to attract hundreds of thousands of new players. This innovative model allows gamers to earn rewards while playing, creating a surge in demand for ARTY—since players can only purchase in-game NFTs using ARTY tokens.
This development is set to:
Boost liquidity and trading volume for ARTY as more players buy and hold the token.
Increase scarcity and value due to heightened utility within the ecosystem.
Drive long-term adoption as the Play-and-Earn model gains traction.
Market Potential & Strategic Opportunity
Currently priced at $0.1600 USDT, ARTY presents an intriguing opportunity. Recent developments indicate a potential upward trend:
Early investors who staked ARTY for three years are now exiting, reducing sell pressure.
The Play-and-Earn launch will drive organic demand, creating a bullish scenario for ARTY’s price.
Given its innovative AI applications, strong ecosystem fundamentals, and the explosive growth potential from Play-and-Earn, we have taken a position in ARTY and see it as a high-potential investment at its current valuation.
Artyfact isn’t just shaping the future of gaming—it’s rewriting the rules.
(Disclaimer: This is not financial advice. Always conduct your own research before investing.)