btc vs. ethBitcoin vs. Ethereum 🔃
It is obvious that Ethereum has not yet made a real run compared to other cycles compared to Bitcoin, and I think that the current correlation gap will close in the coming period.
Fundamental Analysis

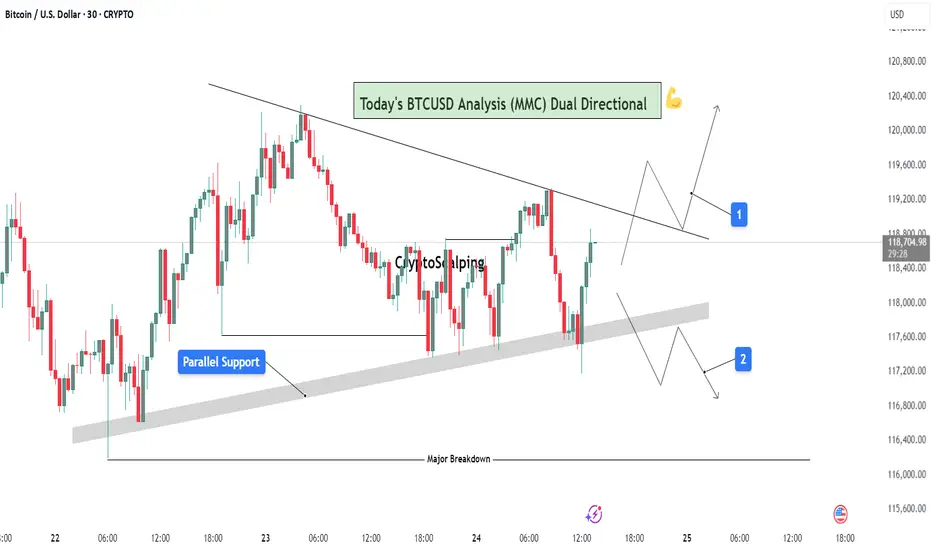
BTCUSD Analysis (MMC) : Dual Directional Outlook let's See🔍 1. Overview of Structure & Context:
On the 30-minute timeframe, BTCUSD is consolidating between two strong technical zones:
A descending trendline acting as resistance
A parallel rising support forming a compression zone
This wedge-like formation signals a potential high-impact move in either direction — a dual-directional outlook. Price is currently testing the midpoint between resistance and support, offering two reactive trade scenarios.
🟦 2. Key Zones Highlighted on Chart:
🔹 A. Parallel Support Zone (Dynamic Support):
A grey-shaded rising support has been tested multiple times.
Each bounce suggests buying strength near this diagonal zone.
This zone represents smart money accumulation potential under MMC concepts.
As price approaches this zone again, bulls are expected to step in if momentum aligns.
🔹 B. Descending Resistance Line (Supply Line):
The market is facing lower highs, a sign of bearish control at higher levels.
Each retest of this line has led to a rejection.
This line also acts as a liquidity magnet — price may spike above it to trap buyers before dropping (false breakout potential).
🧭 3. Scenarios and Trade Possibilities (Dual Directional Path):
✅ Scenario 1: Bullish Breakout – (Marked as Path 1)
If BTC breaks above the descending trendline with strong bullish volume, this confirms a structural breakout.
This setup targets:
First level: $119,600
Second level: $120,200
Once broken, the trendline can flip into support.
Ideal confirmation:
Bullish engulfing candle on breakout
Retest of broken resistance turning into support
Volume surge or momentum indicators turning bullish
⚠️ Scenario 2: Bearish Rejection & Breakdown – (Marked as Path 2)
If BTC fails to break resistance and breaks below the parallel support zone, it opens a bearish scenario.
Price may fall back to:
First level: $117,200
Final key support: $116,400 (Major Breakdown Zone)
This is a typical MMC-style mirror move: a structure break leading to liquidity run toward a previous demand zone.
Bearish confirmation:
Close below grey zone
Lower high formation near resistance
Increasing bearish volume / weak bounce
📐 4. Strategy & Trading Tips (MMC Application):
Under the Mirror Market Concepts (MMC), these zones are not just technical levels — they represent emotional price memory of both institutional and retail players.
Wait for the reaction, not prediction.
Use confluence tools (RSI divergence, volume, candle patterns).
Avoid trading inside the wedge — it's a trap zone.
Ideal entries are at breakout with retest confirmation or rejection from major zones.
📊 Risk Management Plan:
Entry Type Trigger Level SL Suggestion TP Range
Long Trade Break & retest above $118.8K Below $118.2K $119.6K → $120.2K
Short Trade Breakdown below $117.8K Above $118.2K $117.2K → $116.4K
🧠 Conclusion:
BTC is in a decision-making zone between a downward pressure line and strong support. A breakout could lead to a clean trend continuation, while a breakdown would trigger bearish momentum. The chart reflects precision MMC logic, offering a tactical map for day traders and scalpers to follow the smart money — not the noise.
Let the market decide direction. We just need to be prepared, not predictive.
Gold - Week of 21st JulyWelcome to a new trading week. Price is compressing within a premium structure, boxed between clean supply and demand zones. While the overall trend remains bullish, momentum is clearly fading — so structure takes priority this week.
🟨 Weekly Bias: Neutral | Range-Bound Conditions
There’s no clear directional conviction on the weekly timeframe — we’re in a consolidation phase.
📊 Technical Overview & Strategy
We’re currently range-locked between:
Main Supply: 3380–3405
Main Demand: 3275–3250
Until either breaks decisively, we treat this as a two-sided market.
🔹 Weekly Key Zones
🔸 3365–3390 (Primary Supply)
Why it matters: Price was rejected cleanly from a previous weekly high (3377), aligning with a fresh Order Block (OB) and Fair Value Gap (FVG) from June.
Context: No bullish Break of Structure (BOS) above 3375. Repeated wick rejections indicate strong supply.
Game plan: If price returns, monitor M15–H1 for reaction. Consider shorts only if there's no BOS above 3390.
🔸 3430–3450 (Final Supply Barrier)
Why it matters: Unmitigated OB from a macro swing high — the final ceiling before bullish continuation.
Context: A clean BOS through this zone flips the larger structure bullish again.
🔸 3285–3260 (Key Demand Base)
Why it matters: Last untouched bullish OB + FVG combo from early July.
Context: No downside BOS yet. If price pulls back sharply, this zone offers a potential clean long from discount.
🔹 HTF Structure Summary
Trend: Still bullish (no BOS down), but compression under key resistance
Structure Range: 3390–3260
EMA Flow: Bullish, but extended — watch for pullbacks
RSI: Bearish divergence above 3350 — potential retracement brewing
🕯️ Daily Zones
🔸 Supply Zones
3380–3405 – Main Daily Supply / Liquidity Pool
Top of current range. Multiple upper wicks = rejection zone. Unless we get a daily close above 3405, this remains a trap for breakout buyers.
3355–3375 – Internal Supply / Inducement Block
Acted as a consistent ceiling post-CPI. Often triggers fake breakouts and quick reversals — ideal for fading strength.
🟢 Demand Zones
3312–3300 – Mid-Range Internal Demand
Reactive level post-CPI and NY session. Often used for stop hunts and intraday bounces.
3275–3250 – Main Daily Demand
Held firm as support all month. Every dip here has resulted in strong rallies. A daily break below flips the HTF bearish.
⏱ H1 Execution Map
🚩 SELL ZONES
3358–3370 – Primary Intraday Supply
Site of last week’s failed breakout. If price taps this and shows M15/M5 bearish momentum — it’s a sniper entry short.
3380–3395 – Upper Liquidity Trap
Classic fakeout zone. If breakout fails with a sharp reversal, it’s prime territory for “fade and dump” trades.
⚪ DECISION ZONE (Neutral / Pivot)
3335–3345:
A choppy, indecisive area. No clear OB or FVG. Avoid trading here — only observe and wait for clean setups on the edges.
🟢 BUY ZONES
3326–3332 – Primary Intraday Demand
Strong evidence of absorption + sharp reversals. Look for clean M15/M5 snapbacks — a reactive long setup.
3311–3320 – Deep Demand / Fear Zone
Sits below recent lows — ripe for liquidity sweeps. Only consider longs if a strong impulsive bounce follows. High risk, high reward.
Disclaimer: For educational context only.
Ethereum is Trending HigherSince April trough, Ethereum has risen by 179%, delivering a higher rate of return than Bitcoin at 66%. But most of our attention is on Bitcoin, breaking above the 120,000 level.
Why is Ethereum quietly gaining ground —and what does the future hold for Ethereum?
Mirco Bitcoin Futures and Options
Ticker: MET
Minimum fluctuation:
$0.50 per ether = $0.05 per contract
Disclaimer:
• What presented here is not a recommendation, please consult your licensed broker.
• Our mission is to create lateral thinking skills for every investor and trader, knowing when to take a calculated risk with market uncertainty and a bolder risk when opportunity arises.
CME Real-time Market Data help identify trading set-ups in real-time and express my market views. If you have futures in your trading portfolio, you can check out on CME Group data plans available that suit your trading needs www.tradingview.com

Trading Divergences With Wedges in ForexTrading Divergences With Wedges in Forex
Divergence trading in forex is a powerful technique for analysing market movements, as is observing rising and falling wedges. This article explores the synergy between divergence trading and wedges in forex, offering insights into how traders can leverage these signals. From the basics to advanced strategies, learn how you could utilise this approach effectively, potentially enhancing your trading skills in the dynamic forex market.
Understanding Divergences
In forex trading, the concept of divergence plays a pivotal role in identifying potential market shifts. A divergence in forex, meaning a situation where price action and a technical indicator like the Relative Strength Index (RSI) or Moving Average Convergence Divergence (MACD) move in opposite directions, often signals a weakening trend. This discrepancy is a valuable tool in divergence chart trading, as it may indicate a possible reversal or continuation of the current trend.
There are two primary types of divergence in forex—regular and hidden. Regular divergence occurs when the price makes higher highs or lower lows while the indicator does the opposite, often signalling a reversal. Hidden divergence, on the other hand, happens when the price makes lower highs or higher lows while the indicator shows higher highs or lower lows, typically suggesting a continuation of the current trend.
Trading Rising and Falling Wedges
Rising and falling wedges are significant patterns in forex trading, often signalling potential trend reversals. A rising wedge, formed by converging upward trendlines, often indicates a bearish reversal if it appears in an uptrend. Conversely, a falling wedge, characterised by converging downward trendlines, typically reflects a bullish reversal if it occurs in a downtrend.
Traders often look for a breakout from these patterns as a signal to enter trades. For rising wedges, a downward breakout can be seen as a sell signal, while an upward breakout from a falling wedge is often interpreted as a buy signal. When combined with divergences, this chart pattern can add confirmation and precede strong movements.
Best Practices for Trading Divergences
Trading divergence patterns in forex requires a keen eye for detail and a disciplined, holistic approach. Here are key practices for effective trading:
- Comprehensive Analysis: Before trading on divergence and wedges, be sure to analyse overall market conditions.
- Selecting the Right Indicator: Choose a forex divergence indicator that suits your trading style. Common choices include RSI, MACD, and Stochastic.
- Confirmation Is Key: It’s best to watch for additional confirmation from price action or other technical tools before entering a trade.
- Risk Management: Traders always set stop-loss orders to manage risk effectively. Divergence trading isn't foolproof; protecting your capital is crucial.
- Patience in Entry and Exit: Be patient as the divergence develops and confirm with your chosen indicators before entering or exiting a trade.
Strategy 1: RSI and Wedge Divergence
Traders focus on regular divergence patterns when the RSI is above 70 (overbought) or below 30 (oversold), combined with a rising or falling wedge pattern. The strategy hinges on identifying highs or lows within these RSI extremes. It's not crucial if the RSI remains consistently overbought or oversold, or if it fluctuates in and out of these zones.
Entry
- Traders may observe a regular divergence where both the price highs/lows and RSI readings are above 70 or below 30.
- After the formation of a lower high (in an overbought zone) or a higher low (in an oversold zone) in the RSI, traders typically watch as the RSI crosses back below 70 or above 30. This is accompanied by a breakout from a rising or falling wedge, acting as a potential signal to enter.
Stop Loss
- Stop losses might be set just beyond the high or low of the wedge.
Take Profit
- Profit targets may be established at suitable support/resistance levels.
- Another potential approach is to exit when the RSI crosses back into the opposite overbought/oversold territory.
Strategy 2: MACD and Wedge Divergence
Regarded as one of the best divergence trading strategies, MACD divergence focuses on the discrepancy between price action and the MACD histogram. The strategy is particularly potent when combined with a rising or falling wedge pattern in price.
Entry
- Traders typically observe for the MACD histogram to diverge from the price. This divergence manifests as the price reaching new highs or lows while the MACD histogram fails to do the same.
- The strategy involves waiting for the MACD signal line to cross over the MACD line in the direction of the anticipated reversal. This crossover should coincide with a breakout from the rising or falling wedge.
- After these conditions are met, traders may consider entering a trade in anticipation of a trend reversal.
Stop Loss
- Stop losses may be set beyond the high or low of the wedge, which may help traders manage risk by identifying a clear exit point if the anticipated reversal does not materialise.
Take Profit
- Profit targets might be established at nearby support or resistance levels, allowing traders to capitalise on the expected move while managing potential downside.
Strategy 3: Stochastic and Wedge Divergence
Stochastic divergence is a key technique for divergence day trading in forex, especially useful for identifying potential trend reversals. This strategy typically employs the Stochastic Oscillator with settings of 14, 3, 3.
Entry
- Traders may look for divergence scenarios where the Stochastic readings are above 80 or below 20, mirroring the RSI approach.
- This divergence is observed in conjunction with price action, forming a rising or falling wedge.
- Entry may be considered following a breakout from the wedge, which signals a potential shift in market direction.
Stop Loss
- Setting stop losses just beyond the high or low of the wedge might be an effective approach.
Take Profit
- Profit targets may be set at key support/resistance levels.
The Bottom Line
Divergence trading, coupled with the analysis of rising and falling wedges, offers a comprehensive approach to navigating the forex market. By integrating the discussed strategies with sound risk management and market analysis, traders may potentially enhance their ability to make informed decisions in the dynamic world of forex.
This article represents the opinion of the Companies operating under the FXOpen brand only. It is not to be construed as an offer, solicitation, or recommendation with respect to products and services provided by the Companies operating under the FXOpen brand, nor is it to be considered financial advice.

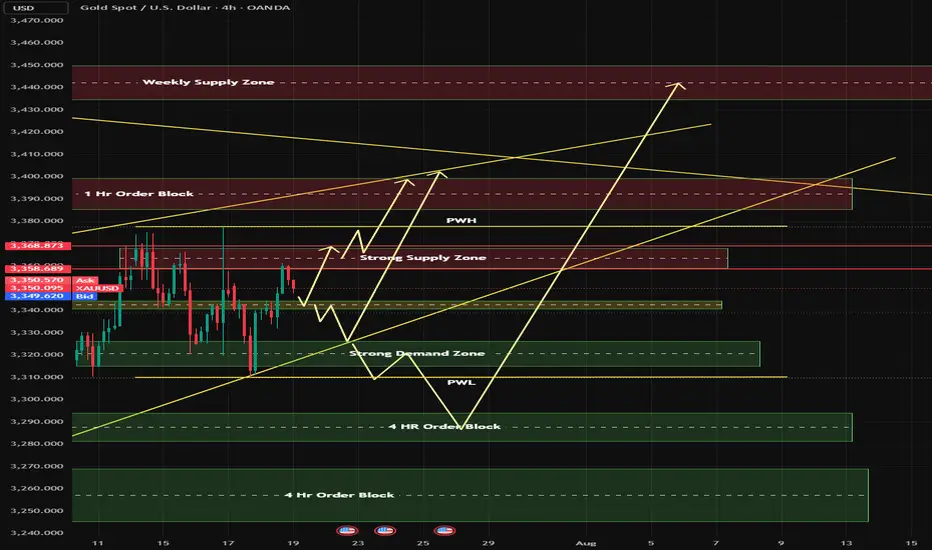
Trading Idea XAUUSD 🎯 Trade Ideas Based on Structure
1. Long Reversal Play (Buy)
📍 Entry: If price retests the support zone around 3,356–3,366 and shows bullish confirmation (e.g. bullish engulfing, pin bar)
🎯 Target: 3,390–3,402 (resistance zone)
🛡️ Stop Loss: Just below 3,355
💡 Why? Buying into support with confirmation aligns with the projected rebound idea
2. Sell into Resistance
📍 Entry: If price rallies to 3,390–3,402 and stalls with weak candles or bearish divergence
🎯 Target: Back to support zone (~3,366 or lower)
🛡️ Stop Loss: Above 3,405
💡 Why? Fading into resistance follows the broader trend while using the shaded zone for timing
3. Breakout Trade (Buy)
📍 Trigger: If price breaks cleanly above 3,402 and closes with strong momentum
🎯 Target: Look toward next resistance (~3,410+)
🛡️ Stop Loss: Below breakout candle (~3,390)
💡 Why? Signals a trend shift or strong bullish move against the recent downtrend
🧠 Smart Trading Tips
Let the candles lead the decision—watch for confirmation before jumping in
Stick to the higher probability zones and avoid overtrading in the middle
Use volume or RSI to filter false breakouts or weak entries

XAUUSD
XAUUSD Updated in H1 :
The gold signal is marked on the chart based on the latest price changes and the supply and demand in the market. These points include the entry point, stop loss, and take profit

XRP CRYPTOCAP:XRP price discovery will be there sooner or later
2021 I think the current accumulation process on the ath price will be the trigger for an upward movement

Comprehensive Analysis: SHORT Signal on XRPUSDT1. News Analysis (Market Sentiment)
The news actually reflects a strongly positive sentiment for XRP’s long-term fundamentals:
"Brazil's VERT Debuts Tokenized Credit Platform on XRP Ledger With $130M Issuance" : This is a very bullish piece of news. It highlights real-world adoption of the XRP Ledger (XRPL) for high-value transactions.
"VERT Launches Blockchain Platform on XRPL for $130M Deal" : This is the same news reported by a different source, confirming the significance of this adoption.
Bridging the Analysis:
Here lies the crucial difference between investors and traders. As long-term investors, this kind of news would motivate us to buy and hold XRP. But as day traders, we understand the common market behavior of “Buy the Rumor, Sell the News.”
The massive price rally before this announcement might indicate the market already anticipated this news. Now that the news is official, early buyers may begin taking profits, triggering selling pressure.
Sentiment Conclusion:
While the news is fundamentally positive, it could strengthen the case for a SHORT position in the short term. This “sell on good news” reaction is a common phenomenon in trading.
2. Technical Analysis (Chart Structure)
The daily chart of XRPUSDT supports a SHORT position even more convincingly:
Climactic Top Rejection : A sharp price rally ends with a long upper wick candle around the $3.60 area. This is a classic sign of buyer exhaustion and aggressive seller entry.
Short-Term Bearish Structure : A large red candle formed after the top, signaling that sellers have taken control. The current price is trading well below that top, confirming the rejection was valid.
Room for Correction : Below the current price, there’s a clear “gap” or market inefficiency. The first logical target for a correction is around $2.80 - $2.90, where the 50 EMA meets the upper edge of the Fair Value Gap (green box). This gives us a clean profit target.
Combined Conclusion:
Yes, based on a combination of “Sell the News” sentiment and clear bearish technical structure, the argument for a SHORT position on XRPUSDT is very valid. We are going against the positive headlines, but following price action signals.
Trading Plan: SHORT Operation on XRPUSDT
Position: SHORT
Asset: XRPUSDT (Perpetual Contract)
Current Status: ENTRY
Entry Reason:
We’re entering based on short-term bearish momentum after a strong rejection from the supply zone, expecting the price to fill the inefficiency below.
Entry Type: Market Order
Why: The bearish move is in progress. We want to catch it now before the price drops further and skips our limit order. We'll execute at the current market price (~$3.01).
Stop Loss (SL): $3.62
Why: Placed slightly above the previous swing high. If price breaks this level, our SHORT thesis is invalid, and we exit to prevent further losses.
Take Profit (TP) Targets & Risk/Reward:
We'll scale out profits in phases to lock in gains.
TP1: $2.85
Why: Confluence of 50 EMA and top of Fair Value Gap
Risk/Reward: ~1:2.8 (Risking $0.61 to gain $1.75 — very healthy ratio)
TP2: $2.55
Why: Mid-point of the Fair Value Gap — a common magnet for price
TP3: $2.25
Why: Full gap fill + retest of prior support/resistance area
TP4: $1.85
Why: Ambitious target — filling the second, deeper Fair Value Gap. Possible in a panic-driven selloff.
Position Management:
Once TP1 is hit:
Move SL to Entry ($3.01) to secure a risk-free trade on the remaining position.
We’ll continue to monitor the price and adjust the trailing stop loss as each TP level is reached.

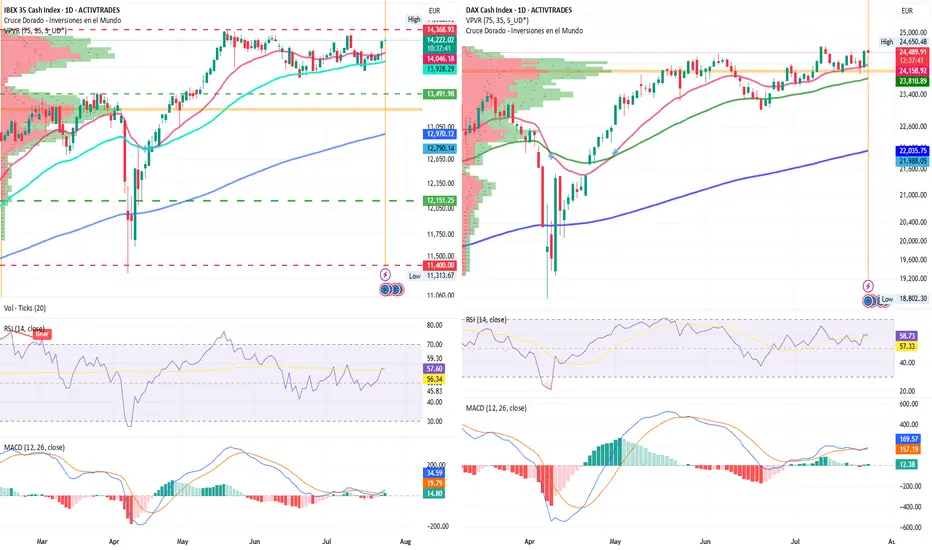
IBEX 35 Leads European Gains, DAX Enters Price Discovery ModeIBEX 35 lider of european bullish advances in the tariff agreements
By Ion Jauregui – Analyst at ActivTrades
European markets kick off the day with strong gains, driven by renewed optimism over trade negotiations between the United States and China. In this context, IBEX 35 futures surge by 1.52% to 14,273 points, positioning the index as one of the top performers in Europe. Meanwhile, Germany’s DAX 40 also rises 1.34% to 24,635 points.
News of potential tariff agreements, combined with growing expectations of a more accommodative stance from the European Central Bank (ECB), are pushing major European indices higher. The French CAC 40 climbs 1.56%, while the EuroStoxx 50 gains 1.33%, reflecting renewed risk appetite across the board.
Global Context: Asian Rebound and Moderate Commodities Euphoria
The upbeat tone isn’t limited to Europe. In Asia, major indices closed in the green, and the Australian dollar hit an eight-month high, reflecting investor optimism around global trade and corporate earnings. Oil prices are also rising, supported by a larger-than-expected drop in U.S. crude inventories and expectations of stronger global demand.
All Eyes on the ECB
Today’s highlight is the ECB meeting, where a decision on interest rates will be announced. While no major surprises are expected, investors will be watching closely for clues on the timing of future rate cuts—especially in light of recent inflation and activity data.
Additional key data scheduled for release today:
Unemployment and PPI in Spain
Composite PMIs for Germany, France, the Eurozone, and the U.S.
U.S. housing data and jobless claims
Corporate Outlook: IBEX Boosted by Strong Earnings
Several IBEX 35 companies are in the spotlight due to positive developments:
Banco Sabadell targets a 16% return on equity by 2027, supported by a €6.3 billion shareholder payout plan.
Indra nearly doubles profits, fueled by operational gains and revaluation of its stake in TESS.
ACS acquires Segade to strengthen its position in the data center sector.
Telefónica is in talks with AXA to join its fiber joint venture with Vodafone.
Santander makes a €1 billion bid for Mercedes’ leasing division.
Technical Analysis – IBEX 35: Key Zone at 14,300 Points
The IBEX 35 shows a clear structure of higher lows since the beginning of the month. Breaking above the 14,200-point level, an intermediate resistance, reinforces its short-term bullish outlook. The index is now approaching the 14,300–14,350 zone, which has acted as a ceiling since May.
This is a pivotal area; a failure to break through could form a triple top pattern, potentially triggering a correction toward support at 13,698 or even lower toward the control area near 13,491. A consolidation above 14,350, however, could set the stage for a new upward leg toward 14,500 points, provided the ECB maintains a dovish tone.
Momentum indicators support the move, although they are nearing overbought levels. RSI stands at 57.89%, while the MACD remains positive and climbing above the histogram.
Technical Analysis – DAX 40: Eyeing a Break Above 24,700
The DAX 40 is also benefiting from global bullish momentum. After consolidating above 24,300, a breakout above the 24,650 resistance could trigger a move toward the 24,700–24,800 zone, pushing the index beyond its all-time highs recorded in June.
A daily close above 24,800 would place the German index firmly in price discovery mode, with the next psychological target at 25,000 points. The RSI remains strong at 58.84%, with no immediate signs of exhaustion, while the MACD confirms the bullish signal from last week, expanding well above the histogram—though momentum appears moderate.
Conclusion
Progress in trade negotiations and expectations of a dovish ECB are setting the stage for a bullish session in European markets. The IBEX 35 leads the rally, supported by strong corporate results and technical strength, while the DAX 40 continues its upward trend, with potential for new all-time highs. Today’s ECB decision could be a turning point if it confirms the accommodative stance the market is anticipating.
*******************************************************************************************
The information provided does not constitute investment research. The material has not been prepared in accordance with the legal requirements designed to promote the independence of investment research and such should be considered a marketing communication.
All information has been prepared by ActivTrades ("AT"). The information does not contain a record of AT's prices, or an offer of or solicitation for a transaction in any financial instrument. No representation or warranty is given as to the accuracy or completeness of this information.
Any material provided does not have regard to the specific investment objective and financial situation of any person who may receive it. Past performance and forecasting are not a synonym of a reliable indicator of future performance. AT provides an execution-only service. Consequently, any person acting on the information provided does so at their own risk. Political risk is unpredictable. Central bank actions can vary. Platform tools do not guarantee success.
DXY 1D – Tipping Point: News or Price Action?Hey Guys,
The DXY index is currently moving within a downtrend. This trend is unlikely to reverse unless it breaks above the 98.950 level.
Sure, key fundamental data could shift the trend, but without those news catalysts, a reversal at this point doesn’t seem realistic.
Don’t forget—98.950 is a critical threshold for the DXY.
I meticulously prepare these analyses for you, and I sincerely appreciate your support through likes. Every like from you is my biggest motivation to continue sharing my analyses.
I’m truly grateful for each of you—love to all my followers💙💙💙

Gold Market Completes Bullish Wedge at 3439Gold market lures to 3439, completing the bullish wedge formation as anticipated.
A retracement is now setting in, with price action expected to sweep through 3391—a key zone that may determine the next leg of the trend.
Watch closely for confirmation at this level for a potential bullish continuation or deeper correction. follow for more insight , comment and boost idea
Gold Market Shorts to 3370's, Eyes Pullback to 3400'sGold market initiates a short move down to 3370's, reacting to short-term resistance.
A pullback stance is now forming, targeting a potential retracement back through to the 3400's, follow for more insights , comment and boost idea


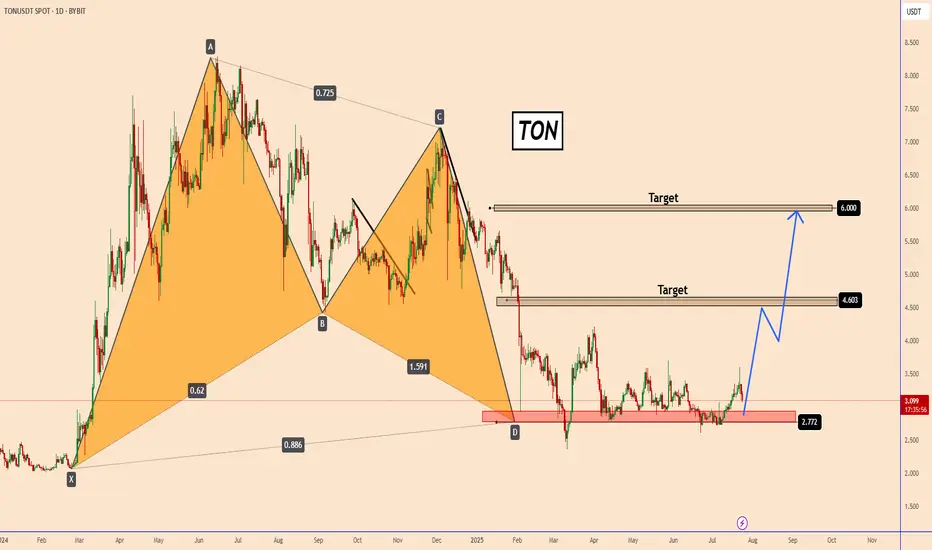
TON: The Bullish harmonic pattern could push TON back upTON: The Bullish harmonic pattern could push TON back up
On the Daily Chart, TON completed a strong harmonic upward move near 2.7500.
The price has been holding in this area since early February 2025.
It looks like this was the end and the price is rallying before making another upward move.
I am looking for two targets.
The first is near 4.60 which also corresponds to a strong structure area and the second is near 6 where the price spent a long time around this area.
You may find more details in the chart!
Thank you and Good Luck!
PS: Please support with a like or comment if you find this analysis useful for your trading day
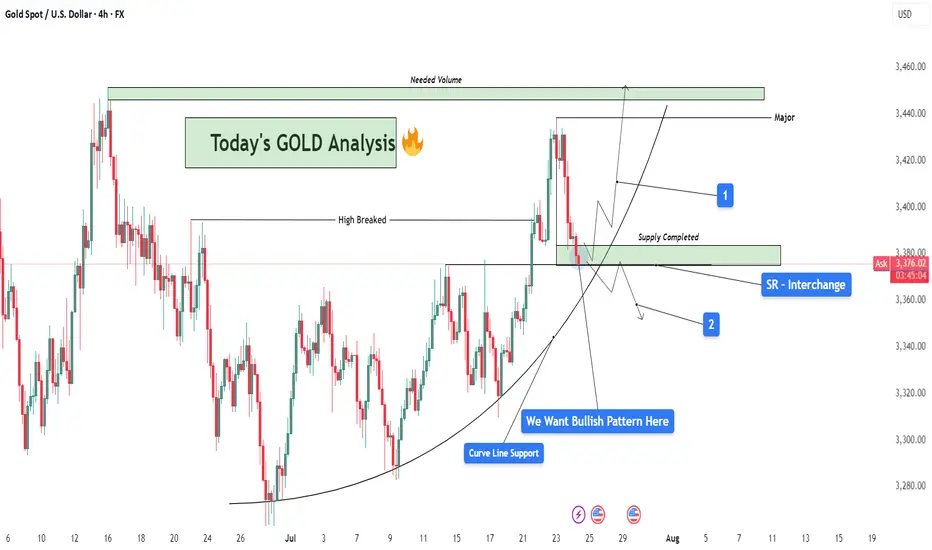
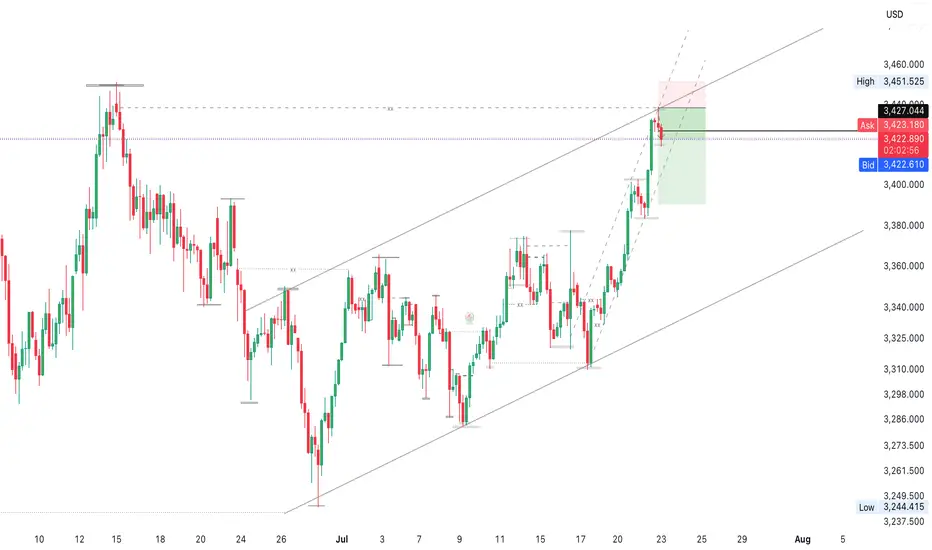
GOLD Analysis : SR Interchange , Reversal Zone + High Break🧠 Market Context & Structural Overview:
Gold has been trading within a clearly defined bullish structure after forming a rounded base pattern in early July, indicating accumulation by smart money. The market recently broke through a key horizontal resistance (previous swing high), marking a potential bullish continuation phase. However, we are now witnessing a pullback — a healthy corrective phase — that is currently testing multiple high-probability confluences.
🧱 Key Technical Zones Explained:
🔹 1. SR Interchange Zone – High Probability Reversal Area:
This area (roughly between $3,360 and $3,380) acted as previous resistance (supply) and has now flipped into support.
This is a textbook Support-Resistance Interchange (SR Flip) — a concept where prior resistance becomes new support.
Traders often look for entries here, especially when it aligns with other technical factors.
🔹 2. Curve Line Support – Dynamic Buyer Strength Indicator:
A curved trendline, often referred to as a parabolic support, has been respecting price structure for over two weeks.
Price is now sitting exactly on this support, signaling potential for another impulsive bullish leg if momentum builds.
🔹 3. Supply Zone Completed – Correction Phase Active:
The supply zone above (approx. $3,420–$3,440) has already been tapped and respected by the market.
This “completed” supply may now act as resistance unless broken with strong volume — we now watch how price reacts at the current pullback zone.
📊 What the Candles Are Telling Us:
The latest candles show some hesitation from sellers — wick rejections and smaller body candles hint at buyer interest at this level. However, confirmation is crucial. We want to see a bullish reversal pattern such as:
Bullish engulfing
Morning star
Pin bar (hammer)
Break and retest of minor resistance inside the SR zone
🔮 Scenarios to Watch:
✅ Scenario 1 – Bullish Continuation (Ideal Setup):
If a bullish reversal forms at this support zone:
Expect a potential rally back to the $3,420–$3,440 resistance area.
If this zone breaks with high volume, price could target the major supply zone near $3,465+, where we’ll need “Needed Volume” for a decisive break.
⚠️ Scenario 2 – Bearish Breakdown (Alternative View):
If the curve support and SR zone fail to hold:
Expect a drop towards $3,345 – $3,320 — where next structural support lies.
This would suggest a deeper retracement or range formation before bulls can regroup.
🧩 Strategy & Psychology:
“We want bullish pattern here.”
You’ve highlighted the importance of not entering impulsively. This is about trading with confirmation, not prediction. Waiting for a valid bullish pattern reduces risk and increases probability.
This is where smart traders win — waiting patiently for confirmation at a zone of confluence.
🧠 Learning Mindset – Why This Zone Matters:
Combines horizontal support, curved trendline, and broken structure retest.
This zone is the battleground between bulls and bears — whoever wins here will likely control short-term momentum.
Newer traders can study this as a classic example of multi-confluence trading, which combines price action, market structure, and dynamic trendlines.