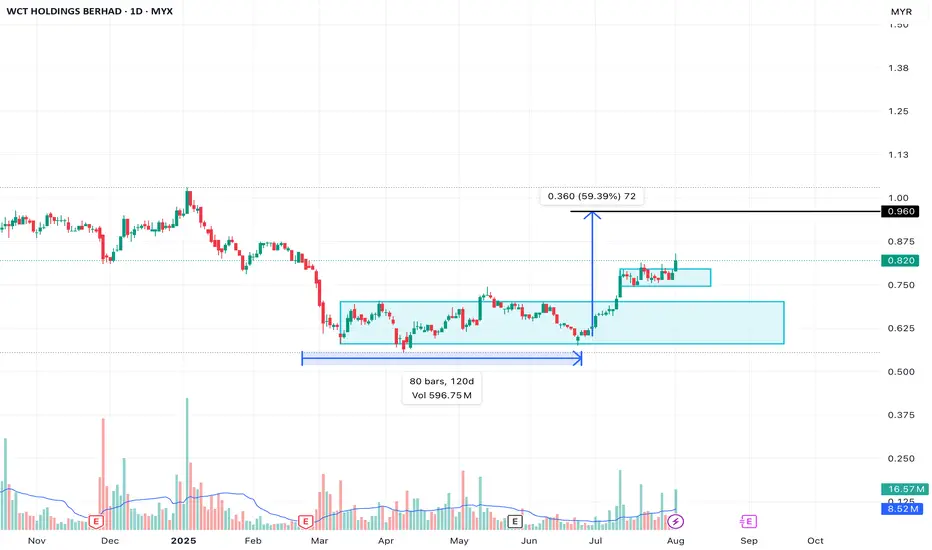
WCT, front runner of ECRL-Port Klang extension.C : Front runner of ECRL-Port Klang extension.
E : Masih dalam fasa keuntungan + AR lepas increasing. Order book forcasted to be increasing this year.
V : FV analysts minima RM0.96, MIDF. RM1 ke atas other banks. PE kasar 4.7.
W : Breaking out from BUA.
I : Currently ada. Tapi tak dapat cari transaction yg latest.
T : Buy BO BUA, cut loss bila price invalidate the structure.
Fundamental Analysis
The Great Trap: How Billionaires Are Winning, and You're Not!The Great Crypto Trap: How Billionaires Are Winning—And You're Not
The ETFs, Saylor, and all of Trump's billionaire friends are getting richer—thanks to crypto.
Meanwhile, most retail traders are just trying to stay above water. Leverage trades are wiped out, charts feel rigged, and the market makes you feel like you're swimming against a riptide.
Why?
Because these rich guys have a plan: manipulate you and take your money. That’s how they stay rich.
Understanding their strategy is the first step to stop being their exit liquidity.
🧠 The New Battlefield
Crypto is no longer a playground for cypherpunks and tech rebels. It’s fully institutional now. We're not just trading against whales—we're fighting the same entities that own the media, control Wall Street, and write the rules.
So forget the old ways of thinking. The tables have turned.
🗓 The Sunday Rekt Routine
To maximize destruction, they need to avoid friendly fire. So they pump on the weekend when retail is free and optimistic, then dump on Monday to close the CME gap—like clockwork.
The playbook:
Weekend: Pump. Trap your long.
Monday: Dump. “Fill the gap.” Liquidate everyone.
Response:
Don’t fall for weekend FOMO. Exit Sunday afternoon. Wait until Tuesday to re-enter, once Monday’s high and low are set. Trade smart, not emotional.
📈 Top-of-the-Market FOMO
You’ve seen it before. Just before the crash, the media frenzy begins. Influencers say “Don’t miss this pump!” or “99% will miss the next big move!” The ETF gods hint at new inflows. It's a setup.
They're not hyping it for your benefit—they're offloading their bags in your face.
Just look at the charts:
BlackRock bought billions to drive BTC to 121K.
Then, in 72 hours, they dumped billions.
Saylor? Silent. No new buys. That’s not coincidence—it’s coordination.
Response:
Check the MACD, RSI, and Stochastic RSI on daily or weekly timeframes. If they're maxed out and the influencers are screaming green—it’s probably too late.
When they stop buying, the dump is already planned.
🧰 How to Outsmart Them
Watch the MACD for crossovers and divergence.
Monitor RSI zones—don’t long into extreme overbought conditions.
Use Stoch RSI to anticipate momentum shifts.
Rule: When everything is overheated, and FOMO is peaking—step back. Let them dump into each other. You’ll get your entry later, cleaner and cheaper.
⚔️ This Is War
Make no mistake: this is a war for your money.
They want yours. You want theirs.
Only the smart survive.
To be continued.
DYOR.

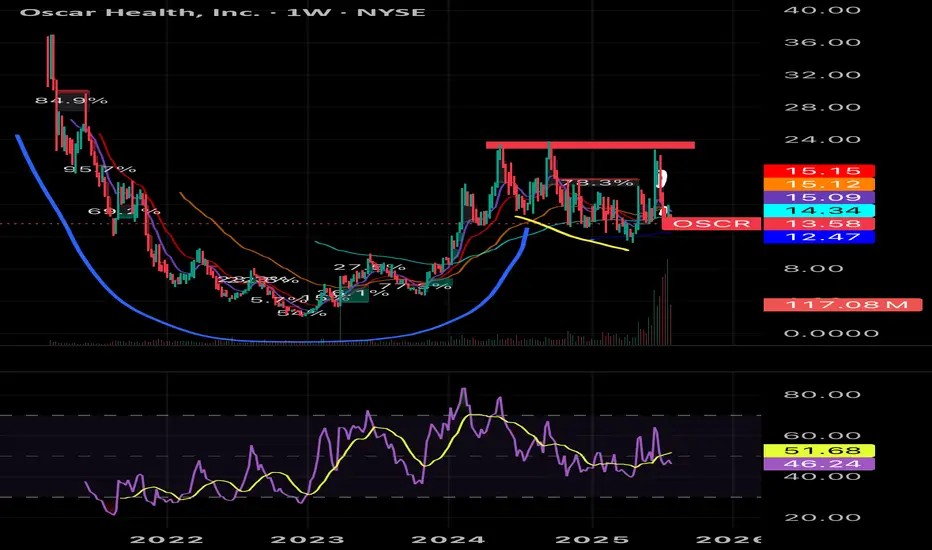
OSCR LONGI know some love and some hate the stock, but from a fundamental standpoint, it's got a lot of potential. Cup and handle. Gaps to fill above. Resistance at 22-24 as of recent. Good Revenue, lots of cash on hand, classic profitable business model, low PE ratio and more all indicate a 30-50 dollar future for Oscar, though the current period will be rocky with the ACA and political climate. Sector is rocky right now and Earnings will also be key as it may drop the stock, but I like shares long personally. Nfa
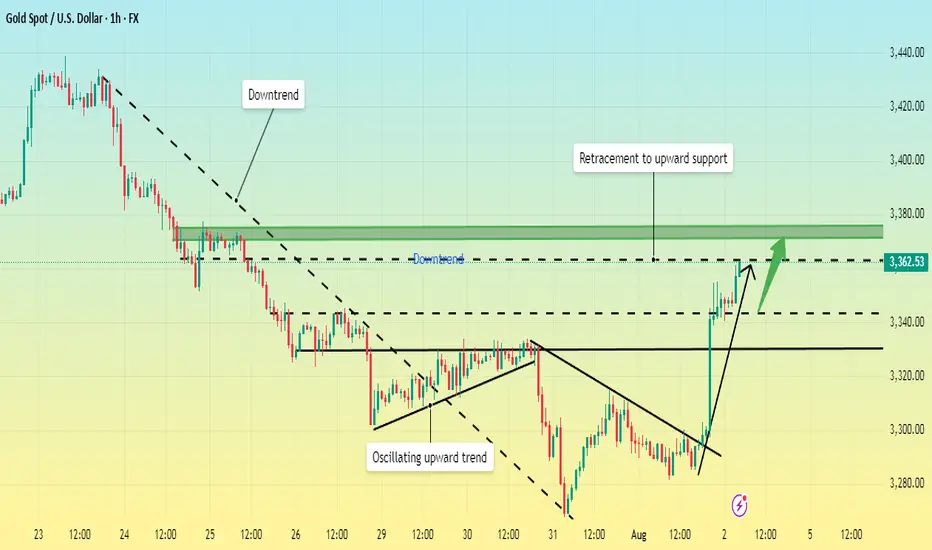
Will prices stage a comeback? Continue their upward trend?Information Summary:
Market participants currently expect the Federal Reserve to cut interest rates twice before the end of the year, starting in September. Earlier this week, the Fed maintained interest rates at 4.25%-4.50%. Powell stated that it was too early to determine whether a September rate cut would occur, citing the need to monitor inflation and employment data.
Market Analysis:
Looking at the 4-hour and 1-hour charts, gold's Bollinger Bands are showing signs of opening upward after Friday's sharp rise. However, it's important to note that a surge-like top opening typically lacks sustainability, and the Bollinger Bands will close again after returning to technical levels. Currently, prices are trading above the upper band, which is not conducive to a direct rise.
The 1-hour chart shows a blunting of the moving averages, and the upper Bollinger Band is about to close. Overall, while gold is strong, it's not appropriate to be overly bullish. Focus on shorting opportunities next Monday, and then consider a bullish outlook after a price correction.
In the short term, focus on resistance in the 3375-3385 range above, and support in the 3345-3335 range below, followed by support near 3315.
Trading Strategy:
Short around 3365-3375, stop loss at 3385, profit range 3345-3335-3315;
Go long on a pullback to 3335-3340, stop loss at 3325, profit range 3350-3360;

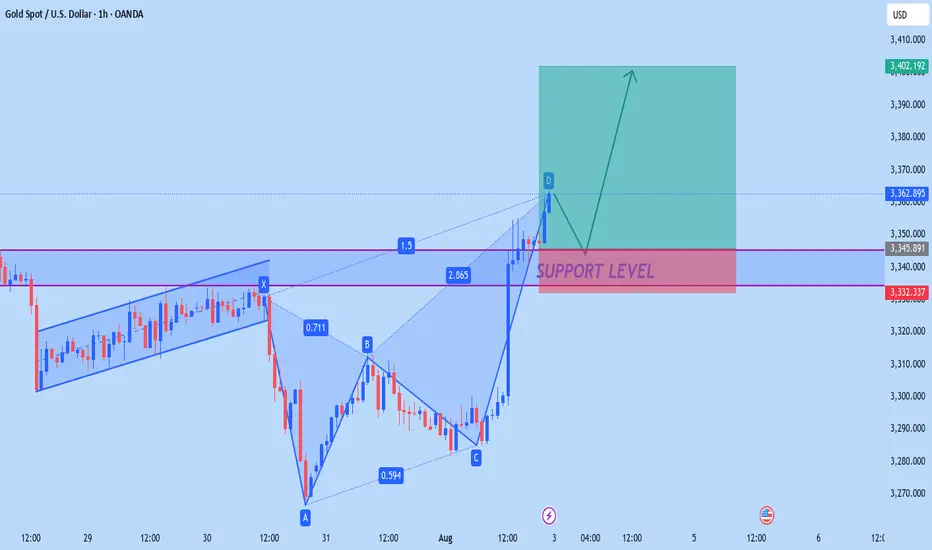
XAUUSD NEW OUTLOOKAccording to H1 analysis gold market going in buying pressure from last 2 day
now market break the resistance zone and make it RBS (RESISTANCE BECOME SUPPORT) so now market close at support level market will touch the Support zone IF you want to buy gold then you have to best chance to buy from SUPPORT level dont be greedy use money management
TRADE AT YOUR OWN RISK
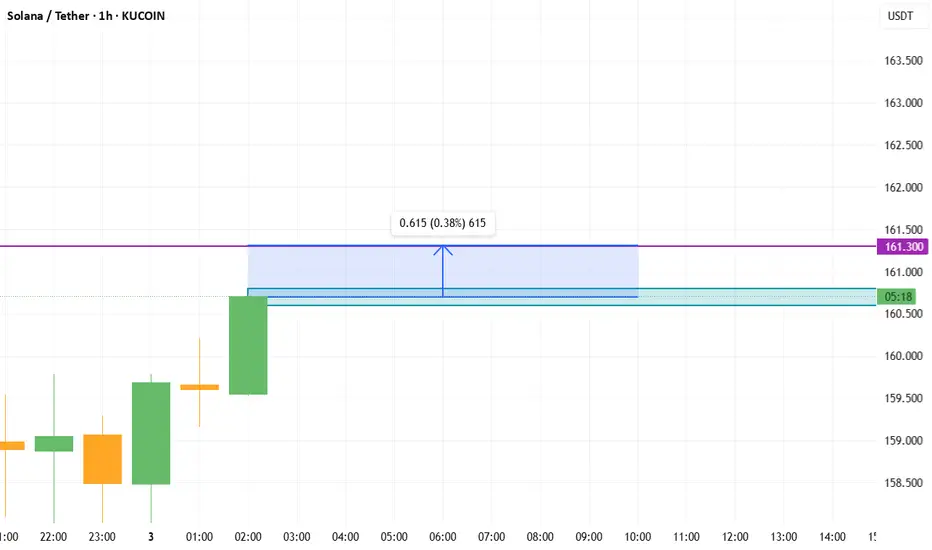
SOLUSDT Direction of operation: Long (Buy)Entry Points: 160.60 ~ 160.80 USDT Batch Pending Order Entry
Take Profit Target: 161.40 ~ 161.60 USDT Interval Gradual Take Profit
-Close all positions if you reach the take-profit limit, and don't get attached to the battle.-
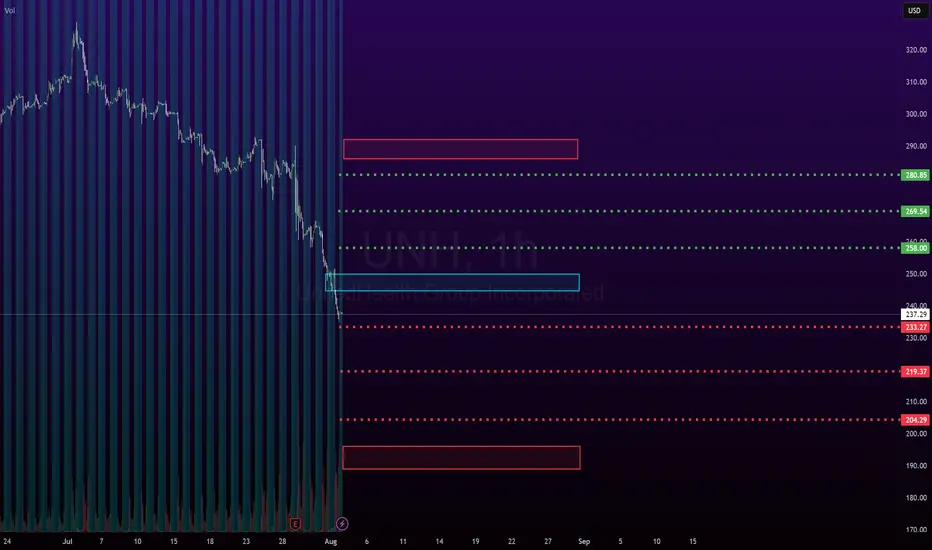
UNH: Monthly outlook UNH is an interesting case study, fundamentals vs technicals vs math.
If you were sleeping, here are the cliff notes on UNH:
UNH is alleged to have commited the following violations/criminal offences
Medicare Overbilling: The U.S. Department of Justice has accused UNH of overcharging Medicare by more than $2.1 billion, allegedly by manipulating diagnosis codes to inflate payments.
Securities Fraud: A class action lawsuit claims UNH misled investors by denying coverage to boost profits, which allegedly contributed to a sharp drop in stock value.
Undisclosed Payments: Reports suggest UNH made secret payments to nursing homes to reduce hospital transfers, potentially compromising patient care.
How did it come to light, you ask?
From whistleblowers, investigative journalists and a DOJ probe (department of justice).
While the investigation is ongoing, if they are found guilty of any or all of these allegations, the penalties could be:
Billions in fines
Civil damages
Criminal charges
Sanctions that can fundamentally interfere with how they do/conduct business
With that out of the way, ask yourself: Am I buying this while there is an ongoing criminal investigation that could very well result in the insolvency of an organization?
I know a lot of people think the charts tell the news, but something this serious unfortunately can't be foretold by a chart, in my opinion.
But let's humour the fallacy that these traders have, and entertain whether or not UNH could theoretically be a buy.
Technicals:
Oversold, obviously.
No clear bottom pattern.
No clear chart pattern at all.
Massive investor exodus, with the current selling volume being almost as much as the flash crash we had the beginning of this year and the third highest in UNH's long, long life on the NYSE.
Math:
While UNH is below is quadratic mean, it has not triggered a bullish mean reversion signal yet.
Forecast into next week is bullish with some upside bouncing expected.
Mid term forecast (over the next month) has it coming down to 220.
The math levels are posted in the chart and 220 is actually the second low target on the month, so that's interesting.
This will go lower obviously if guilt is found or damming evidence comes forth in the media over the next days. I say this because UNH popped up on my sweep alerts. Four (4) very large option orders have popped up on my order flow screener for UNH, totaling over 7 million in short premiums (puts).
First is the 480 put strike expiry 08-15 of this year with 4.2 million in premiums bought.
Second is the 530 put strike, expiry 09-19 of this year with 634 k in premiums bought.
Third is the 540 put strike, expiry 09-19 with 815 k of premiums bought.
Last is the 600 put strike, expiry 01-16-2026 with 554 k of premiums bought.
This obviously has me interested that someone knows something about stuff.
But this is not advice, just reporting what I see.
Safe trades everyone!
BHP holds steady as copper cracksCopper has been on a rollercoaster in 2025. It broke above US$5/lb in May, driven by strong demand signals from China and clean energy projects. Then came the reversal. US tariffs on Chinese copper goods triggered a sharp selloff. Futures dropped more than 20% in days.
Traders reacted to headlines. But the long-term story remains intact.
BHP, one of the world’s largest copper miners, just delivered record output—over 2 million tonnes in FY25, up 8% year-on-year. Its Escondida and Spence mines are performing strongly. Copper is becoming a key pillar of BHP’s future production and revenue.
The stock is currently trading on the ASX near its 200-day moving average, around AU$39. This is a technical and psychological level that often acts as support in long-term trends. It’s a point where value investors typically step in.
The investment case for copper hasn’t changed. Electrification, energy transition, and AI-driven infrastructure will need vast amounts of copper. Supply remains constrained. New projects are few, and development timelines are long.
Short-term shocks create long-term opportunities. The tariff-driven selloff may shake out weak hands, but it doesn’t weaken the structural demand for copper.
BHP offers a cleaner way to invest in the copper story. It has scale, operational discipline, and a strong dividend yield. Investors get exposure to copper without the risks that come with smaller miners or speculative plays.
We believe this pullback is an entry point. BHP near its long-term average, with strong fundamentals, looks attractive for medium to long-term investors.
Copper may stay volatile. But the direction is clear. BHP is well-placed to ride the next leg higher.
The forecasts provided herein are intended for informational purposes only and should not be construed as guarantees of future performance. This is an example only to enhance a consumer's understanding of the strategy being described above and is not to be taken as Blueberry Markets providing personal advice.

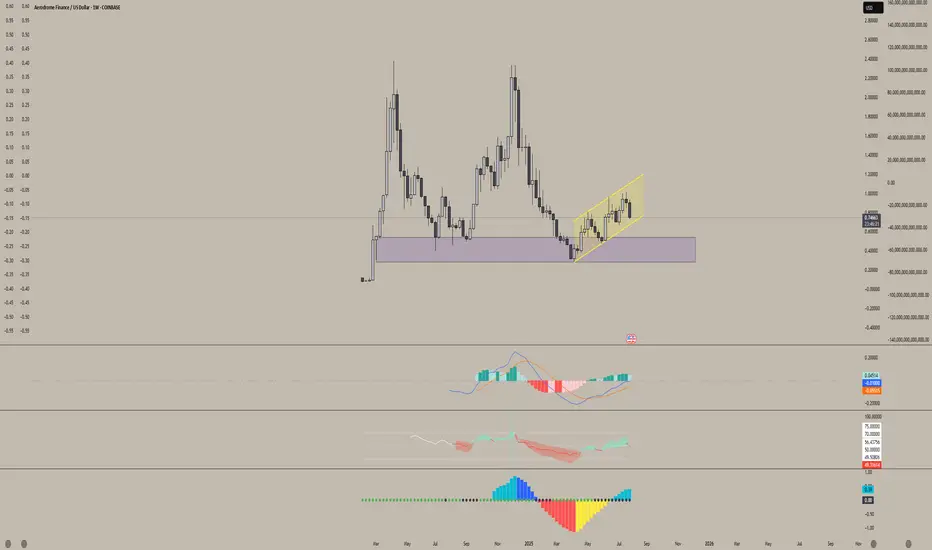
Aerodrome Finance (AERO)Aerodrome (AERO) is showing strong signs of accumulation.
We've been trading within this parallel channel for nearly three months, and it's repeatedly respected both the upper and lower bounds. As we approach the bottom of this range again, it looks like an ideal accumulation zone for long-term holders.
I'm very bullish on this project. Aerodrome is the leading DEX on Base — Coinbase’s Layer 2 network — and with no native Base token currently, AERO is in a prime position to claim that top spot. There's a vacant throne on Base, and AERO is well-positioned to sit on it.

XAUUSD | Weekly Fakeout → Wedge Breakout | Targeting 3508+🔔 Summary:
Reclaimed liquidity, broke wedge structure with strength, and printed continuation signs.
Expecting bullish move toward 3,508 on higher timeframe if breakout holds.
Will reassess if price closes below 3,314 (invalidates short-term momentum).
🔔 Long Version:
📝 Description:
📆 Date: 2nd August 2025
📊 Timeframe: Weekly → Multi-TF Analysis
📈 Bias: Bullish
🧠 Setup: High-volume breakout from descending wedge + weekly fakeout/liquidity sweep.
⸻
🧱 Structure
• Weekly fakeout below trendline rejected with strength
• 4H bullish engulfing candle broke through EMA stack and wedge resistance
• Price retested previous Fair Value Gap (FVG) and confirmed buyer strength
• Strong volume spike and MACD momentum shift confirmed breakout conviction
📊 Indicators
• EMAs: Price above 20/50/100/200 on H1 & 4H
• MACD: 4H flipping bullish, Weekly still holding green
• Volume: Significant bullish breakout candle, multi-timeframe confluence

PSX: Systems Limited IdeaTrade Plan for Systems Ltd (SYS) — Monthly Chart
✅ Trade Type: Swing Trade (Position trade with multiple months’ holding horizon)
⚙️ Technical Setup Summary:
Price is in a bullish breakout structure after testing key Fibonacci levels.
Break above 0.618 Fibonacci retracement (128.55 PKR) confirms bullish momentum.
Price currently retesting the 0.786 Fib level (138.34 PKR).
Clear trendline support.
Bullish price action and increasing volume confirm accumulation.
🔸 Entry Plan
Entry Zone: Between 128.50 – 133.50 PKR
Ideal scenario: Entry on a bullish reversal from the purple support box (~128.50 area), near the 0.618 Fib level.
Alternatively: Add partially now, and scale into position if the price dips toward support.
🛑 Stop Loss (SL)
SL Level: 121.60 PKR
Below the recent support structure and 0.5 Fib retracement level.
Protects against trend reversal and false breakout.
Tight but logical based on structure.
🎯 Take Profit (TP) Targets
TP1: 150.80 PKR (1.0 Fibonacci Extension)
TP2: 170.00 PKR (1.414 - 1.618 Fib Extension Zone)
⚖️ Risk-to-Reward Ratio (RRR)
RR: ~1:3
SL = ~12 PKR
TP1 = ~17 PKR gain
TP2 = ~37 PKR gain
🔍 Trade Justification
Price action broke key resistance near 128.50 with volume.
Monthly candle structure shows strength; previous resistance now acting as support.
Long-term trendline intact.
Fibonacci cluster and historical price action align for confluence.
Positive momentum with potential continuation toward TP2.
🧠 Trade Management
Partial Profit: Take 50% at TP1, trail SL to break-even.
Trail Remainder: Use monthly candle lows or 20 EMA as dynamic trailing stop.
Re-evaluation: If price consolidates between 138–145 for several weeks, reassess risk and possible breakout re-entry.
🗓️ Time Horizon
Expected Holding Period: 2 to 6 months
Review price action on weekly closes for confirmation or exit signs.

Has a bull market started? In-depth analysis.Friday's non-farm payroll report was unexpectedly disappointing, sending gold soaring.
Data released by the U.S. Department of Labor on Friday showed that non-farm payrolls added only 73,000 jobs in July, far below market expectations of 100,000. The weak employment report quickly shifted market sentiment regarding the Federal Reserve's policy path. Market expectations for a September rate cut have soared to 75%, with another cut expected before the end of the year.
This shift has provided strong support for gold prices. Amidst persistent inflationary pressures and disappointing employment data, a Fed rate cut would be a substantial boon for gold.
Friday's data triggered a sharp rise in gold prices on the daily chart, reversing a week-long decline. This is the first sign of a pattern that breaks a weak downward trend. Following consecutive declines, the daily chart began to rise, directly reversing a week's losses. This pattern is likely to continue next week, forming a bullish pattern, with a potential second leg higher. Therefore, next week will be crucial for bullish sentiment, with key focus on whether it can break through the highs and the continuity of the bullish trend.
The bullish trend is likely to continue next week. It's also important to note that Friday's pullback to around 3340 marked an inflection point, a watershed between bulls and bears and a secondary bullish level. Since Friday's close was near resistance, it's important to watch whether the market will surge directly next week or retreat before rising again. If the rally isn't sustained in the early Asian session, a correction is likely to occur, accumulating upward momentum.
LitecoinLtc usdt daily analysis
Time frame hourly
Risk rewards ratio >2.7👈👌
Short position
Target 100.5 $

JPY SHORT TERM BULLIn my past video on YouTube, ive mentioned that JPY will be short-term bullish. Price took SSL and the run for the buy side. im hoping for the price to retrace to its weekly 50% Av, making its cross pair go lower like AUDJPY & EURJPY.

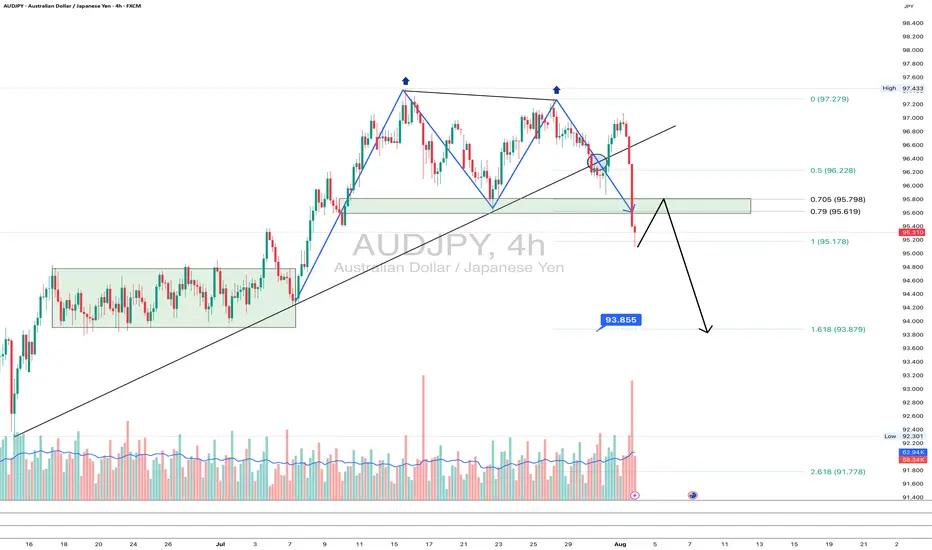
AUDJPY: goodbye uptrend?On the 4H chart, AUDJPY has printed a textbook double top pattern, breaking the rising trendline and diving below the 95.6–95.78 support zone - now acting as resistance. The pair is currently retesting this zone from below, which often provides a clean re-entry point for bears.
This area also aligns with the 0.705–0.79 Fibonacci retracement, reinforcing it as a key resistance. If the price rejects this zone, the next target is 93.85 (1.618 Fibo projection), followed by 93.25 and potentially 91.71 if momentum strengthens.
Fundamentally, the yen gains strength on risk-off flows and diverging rate expectations, while the Australian dollar is pressured by falling commodity prices and a likely pause from the RBA. This widens the rate differential and weakens AUD.
As long as price remains below 95.78, sellers are in control. Watch for a rejection from this retest zone.
close to receiving grantsWith 19 utility patents close to receiving grants, there is a possibility that Fibrobiologics' shares will suddenly jump at any moment with the news.

XRPUSDT - range projection Measures the possible price projection for XRP x0 . The large whale of over 1 billion in volume makes a good case that someone with smarts knows that this asset has a bright future. the platform where the exchange was made couldn't fill quick enough. Generally a whale or even a mini whale will be expecting to double their investment to take money off the table and that usually happens at the last resistance, so if the last solid resistance was a $ 3:00 you can expect a buy price of around $ 1:50...... anything lower than that is a bonus to stay on top of any possible draw down.

USDCHF Short term bullish?As dxy looks like it wants to run higher, USDCHF will likely also go higher for a short-term buying for a retracement to then continue its down trend. this pair looks good.

My USDCAD bullish senarioAs dxy looks like it wants to retrace higher, I would expect the same outcome with USDCAD . Ive outlined what im looking for as price retrace from a key area back into 50% of daily fib to look for long side buys. Let's see how this pans out

08/1/25 Trade Journal, and ES_F Stock Market analysis EOD accountability report: +440
Sleep: 6 hours
Overall health: Good
VX Algo System Signals from (9:30am to 2pm)
— 9:30 AM Market Structure flipped bearish on VX Algo X3!
— 10:12 AM VXAlgo ES X1 Buy signal
— 10:20 AM VXAlgo NQ X1 Buy Signal
—12:30 PM Market Structure flipped bullish on VX Algo X3!
— 1:00 PM Market Structure flipped bearish on VX Algo X3!
— 1:50 PM VXAlgo ES X1 Buy signal,
— 3:00 PM Market Structure flipped bullish on VX Algo X3!**
What’s are some news or takeaway from today? and What major news or event impacted the market today?
Market range expanded a lot today, we dropped over 100 points today and sometimes i forget to adjust my bracket orders to go for 10 -15 points take profits when the volatility is so high. But overall, it was a good day, I knew to be patient as market was wild and sometimes you want to just snipe a few trades and call it a day before you get caught on the wrong side.
The great thing about big moves is that it will eventually hit a major level and it will react really well, you just have to wait for it.
a great question is will the market recover? Or is going back down to April prices?
News
*STOCKS TUMBLE TO END THE WEEK, VIX SPIKES AS SOFT JOBS DATA STOKE ECONOMIC JITTERS
What are the critical support levels to watch?
--> Above 6330= Bullish, Under 6310= Bearish

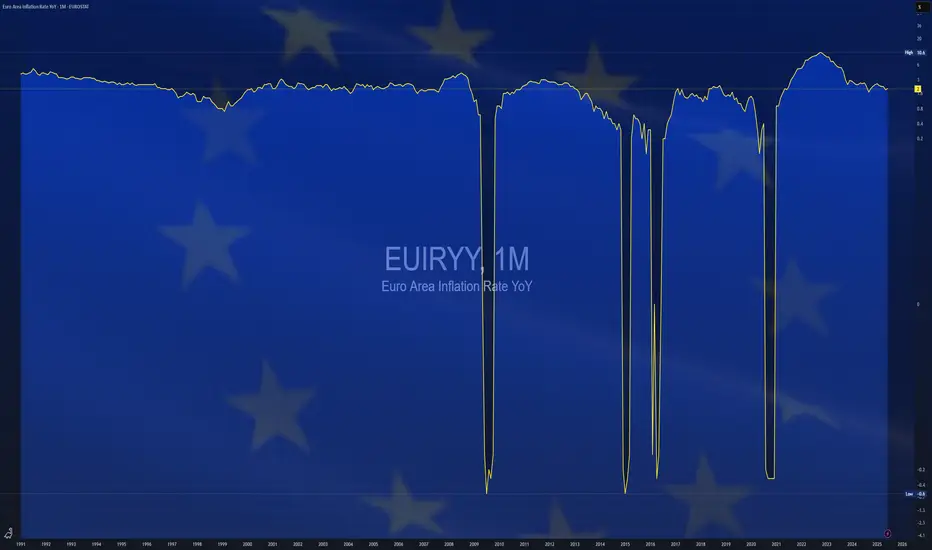
$EUIRYY -Europe CPI (July/2025)ECONOMICS:EUIRYY
July/2025
source: EUROSTAT
- Eurozone consumer price inflation held steady at 2.0% year-on-year in July 2025, unchanged from June but slightly above market expectations of 1.9%, according to preliminary estimates.
This marks the second consecutive month that inflation has aligned with the European Central Bank’s official target.
A slowdown in services inflation (3.1% vs 3.3% in June) helped offset faster price increases in food, alcohol & tobacco (3.3% vs 3.1%) and non-energy industrial goods (0.8% vs 0.5%).
Energy prices continued to decline, falling by 2.5% following a 2.6% drop in June.
Meanwhile, core inflation—which excludes energy, food, alcohol, and tobacco—remained unchanged at 2.3%, its lowest level since January 2022.
MSTR....Free FallingMSTR looks like it is nosediving straight down. When one is bullish on BTC, it is important to also understand that volatility is a big part of the game - a very costly game with many losers! BTC has past several key TAs and we only just started - crossing $300 is in the horizon. Always do your own due diligence, and received ultrabear signal earlier to exit, and cut your losses soon.
