APLD 0DTE TRADE IDEA (AUG 1, 2025)
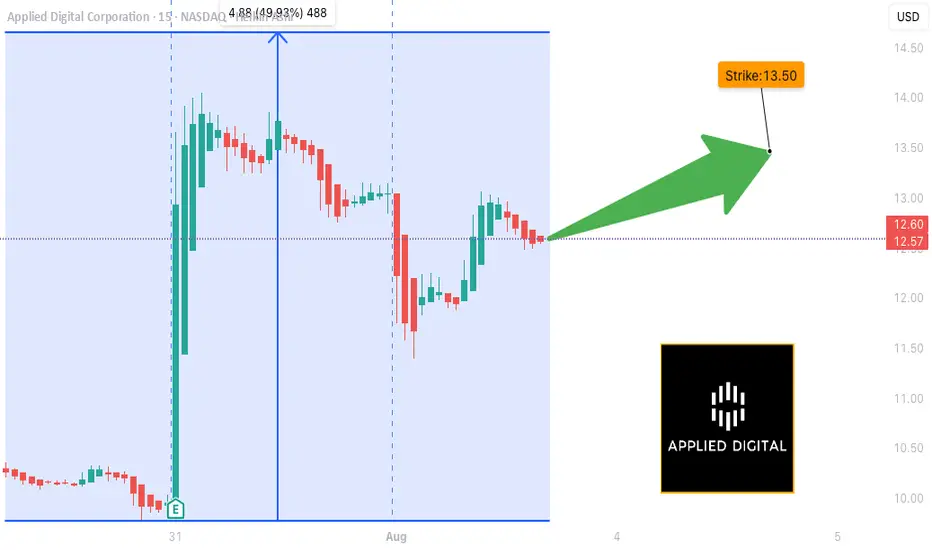
## 🔥 APLD 0DTE TRADE IDEA (AUG 1, 2025)
**💡 Multi-AI Model Consensus | High Risk-Reward | Gamma Alert**
### 🧠 AI Model Summary
✔️ **Bullish Momentum** confirmed across all models
📉 **Volume Weakness** = key caution signal
⚠️ **Gamma Risk HIGH** → Most recommend entry *next session* (Monday)
---
### 🛠 TRADE SETUP (Based on Consensus Call)
| Field | Value |
| -------------- | ------------------------------ |
| 📈 Direction | **CALL (Bullish)** |
| 🎯 Strike | **\$13.50** |
| ⏰ Expiry | **Aug 1 (0DTE)** |
| 💰 Entry Price | **\$0.23** (ask) |
| 🎯 Target | **\$0.35** |
| 🛑 Stop Loss | **\$0.12** |
| 🔁 Size | 1 Contract |
| 📊 Confidence | **75%** |
| 🕒 Entry Time | **Next session OPEN (Monday)** |
---
### 🔍 Key Model Insights
* 📊 **Call/Put Ratio Bullish** across all platforms
* 📉 **Weak Volume** warns of unsustainable moves
* 🧨 **High Gamma Sensitivity** → rapid profit/loss shifts
* 🧠 **Claude / Grok / DeepSeek** all flag for rapid exit if entered today
---
### 📌 TradingView Viral Caption
> ⚠️ \ NASDAQ:APLD 0DTE 🔥
> Models agree: 🚀 bullish trend, 💀 dangerous gamma
> ✅ \$13.50 CALL @ \$0.23 → Target: \$0.35
> ⏱️ Most say: **WAIT ‘til Monday open**
> 🔍 Risk tight. Exit fast. Volume light.
> \#APLD #OptionsTrading #0DTE #FlowTrading #AIModels #GammaSqueeze #FridayTrades #TradingViewIdeas
Fundamental Analysis
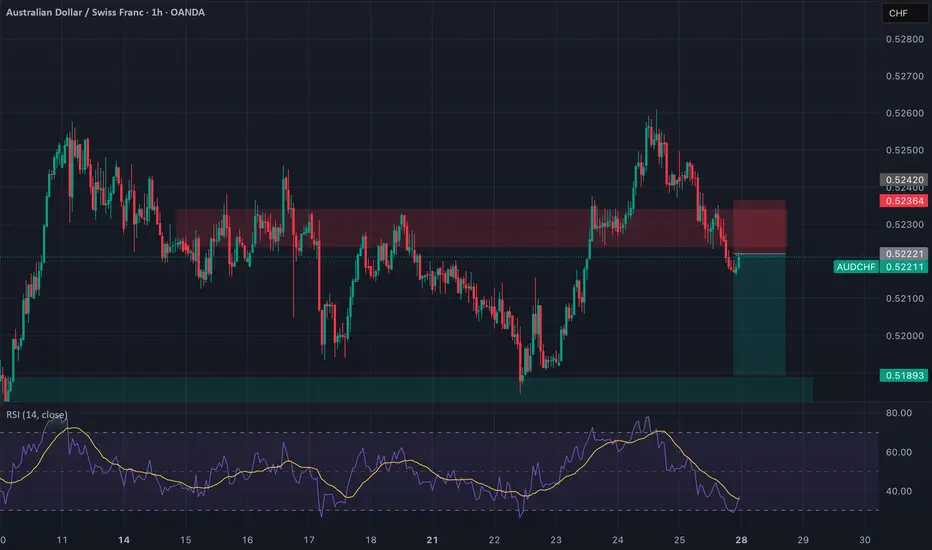
AUDCHF: Broken Support, Bearish Flow In Play Timeframe: 1H
Bias: Bearish
Type: Support Turncoat → Breakdown Play
📊 Technical Setup
AUDCHF previously broke the 4H resistance (0.5236) which flipped to support. However, price has now broken below this support, confirming it as a failed demand zone.
• Entry: Market execution or retest of 0.5236
• SL: Above 0.5245
• TP: 0.5189
• RR: ~1:2
• RSI: Below 50 and heading lower = momentum supports downside
📉 Macro & Fundamental Confluence
• AUD Weakness: RBA dovish, conditional score declining, bearish seasonality
• CHF Slightly Less Weak: Despite SNB dovish stance, CHF is outperforming AUD
• COT + Sentiment: AUD CFTC weakening, CHF holding steady
• Risk Sentiment: RISK ON environment reduces CHF demand but AUD still underperforms
🧭 Gameplan
“Support failed to hold. Bearish pressure intensifies. Target previous swing low zone.”
🔔 Watch for retest of 0.5236 for better RR setup before continuing short.
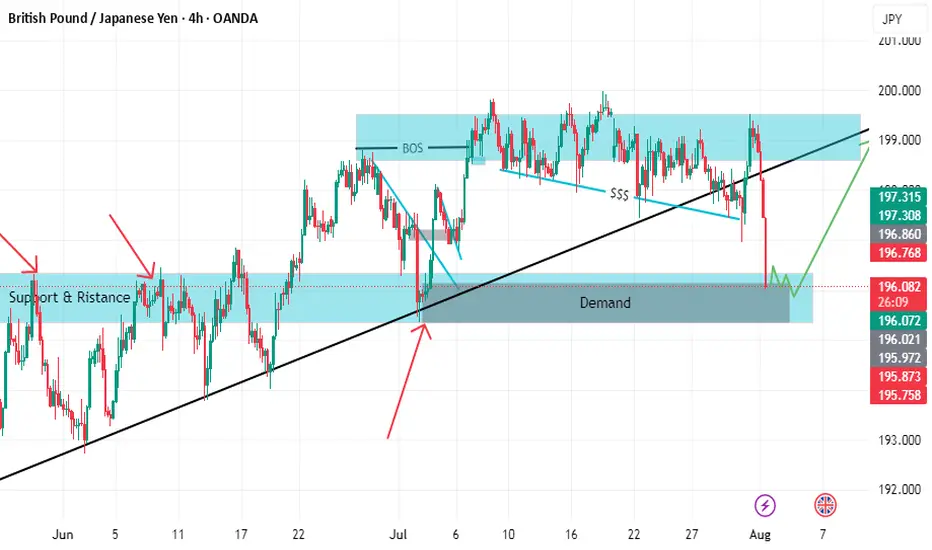
GBPJPY BUY SETUP LOOOOOOOOOOOOONGWELCOME TO YOU
we have support which is strong with retest
and we have demand and before it imbalance if you focus on photo
and the price make bos and take liquidity so i will buy with you .but prefer to be there conformation for buying
Microsoft (MSFT)–Watching for Pullback Entry After $4T MilestoneMicrosoft Corp. NASDAQ:MSFT has become the second company after Nvidia to cross the $4 trillion market cap, powered by strong AI and cloud demand.
Azure revenue grew 34% to $75B in 2024, with a $30B AI infrastructure investment fueling future growth. Q4 EPS came in at $3.65 on $76.4B revenue, showing strong fundamentals.
We are looking for a pullback to key support for a long entry:
Trade Plan:
Entry Zone: $515 – $518
Take Profit: $536, $555
Stop Loss: $502
#Microsoft #MSFT #Stocks #Trading #StockMarket #TechnicalAnalysis #AI #Cloud #BigTech #NASDAQ

Quantum's Missed IWM Short 8/1/25Well had a moment where I backed out of a A+++ setup. IWM had a ton of -gex pull down to 206. Would have been a massive short to end the week. I canceled my order instantly for no reason at all and missed it. Overall had a great day but this is what separates the elite from the average trader. Will work on this next week.

WEAK NFP EFFECTS FOR USA AND DOLLAR#NFP not as expected weakens dollar and shows weaker USA economy growth
Other Currencies and Gold Rising.
Big green candle at 6pm IST exactly when nfp data came
#EURUSD #XAUUSD #USEconomy

MAG Silver – A Pure-Play Winner in the Precious Metals RallyCompany Snapshot:
AMEX:MAG Silver is uniquely positioned as a high-beta play on silver and gold, with nearly all revenue tied to precious metals exposure—making it a standout in the current macro-driven metals bull run.
Key Catalysts:
High Leverage to Silver 🌐
With almost all income derived from silver and gold sales, MAG offers direct upside as investors flock to safe-haven assets amid inflation, rate uncertainty, and geopolitical risk.
Juanicipio Growth Engine ⛏️
Operated by top-tier partner Fresnillo, the Juanicipio project continues to scale efficiently, tapping into new high-grade zones that will further boost output and margins.
Financial Strength 💰
A debt-light balance sheet and healthy cash reserves give MAG financial flexibility, minimizing dilution risk and providing insulation during volatile market cycles.
Investment Outlook:
Bullish Entry Zone: Above $18.00–$19.00
Upside Target: $28.00–$29.00, driven by silver tailwinds, project scalability, and financial discipline.
🥇 MAG Silver stands out as a low-risk, high-reward name for investors seeking direct exposure to silver’s breakout.
#SilverStocks #Gold #MAGSilver #SafeHaven #PreciousMetals #Juanicipio #Fresnillo #CommodityRally #HardAssets #MiningStocks #InflationHedge #Geopolitics #MetalBulls

XAUUSD Short ProjectHi guys...😎
It's time to do a Short Project on XAUUSD with 3 key reasons:
1. Price Drivers: institutional shorting
2. Trend: down
3. Momentum: bearish
Action: waiting for entry on the intraday timeframe (entry will be published further)
Ocean Pal, Inc $OP going to .01 centThis one will soon be at .01 cent. Why? Outstanding shares went from 7 million to over 170 million as of a July 31st filing! OceanPal is based is Greece (not known for their financial accountability). There are others posting about an upswing to $3 based on TECHNICAL analysis. However, they are ignoring the fundamentals. Short this one if you can!

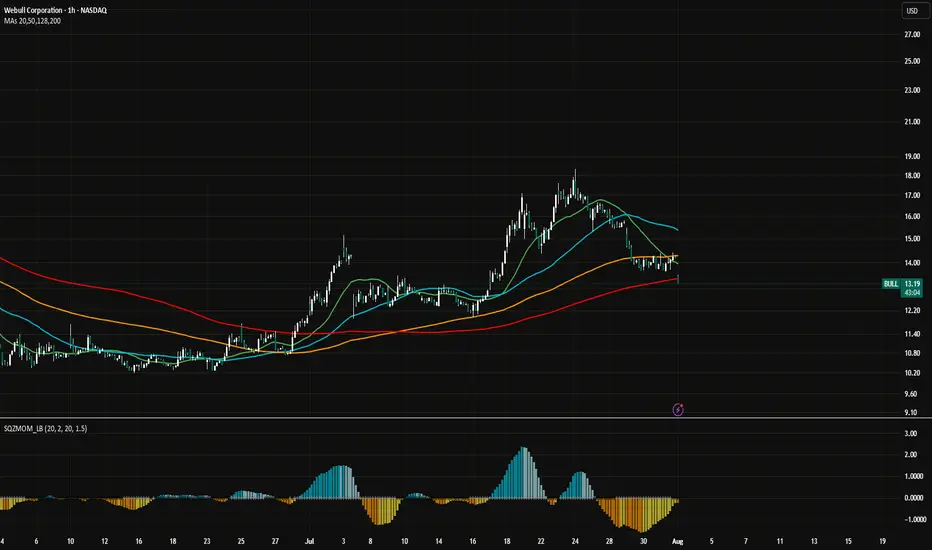
WeBull Look Ahead $BULLRecently took a look at WeBull and I believe there is a huge arbitrage opportunity from NASDAQ:HOOD to $Bull.
Although RobinHood is building something much much bigger than anticipated, including banking, I think WeBull can take some of $HOODS market share depending on their direction.
-Webull's total revenues grew 32% year-over-year to $117 million in the first quarter of 2025, according to SEC filings
-Customer assets increased 45% year-over-year, reaching $12.6 billion at the end of Q1 2025, according to Webull
-The number of registered users grew by 17% year-over-year, according to Webull
-Partnership with prediction market Kalshi will grow profits for WeBull exponentially.
www.nasdaq.com
This Might be the best price to get in today depending on WeBull's Success.
VIX will save you! Learn how to trade itHave been trading the VIX for years and it is absolutely gorgeous how well it performs when everything else tanks! Check out monthly spikes, it's trend, and cycles going back over 30 years. For details DM on the ABCs of using leverage without taking on any directly yourself and trading entry / exits with backtesting algorithmic support!
Soon we will get to the 20s and then it's when the fun begins....30s and 40s is very much a real scenario and the economy is doing far worse than people think. Most stocks are trailing below SMA 200 and only a dozen companies are holding the ship afloat. This is not sustainable!
The S&P is highly correlated, most in 5 years, which means that diversification has less impact. VIX has a beta of 0.1! Let that sink in, use it to your advantage before the massive correction happens. Not financial advise, always do your own due diligence, but have beaten the market multiple times over :)

GBP/USD | SMC Roadmap – Clinton Scalper POV🧠 Institutional Structure Overview
GU has been aggressively distributed from the 1.358xx premium zone, creating a strong downward market structure. We now observe:
A clean internal BOS confirming bearish intent
Major liquidity voids left behind
Price currently resting around discount levels (0.236–0.0 zone)
This sets the stage for a "fake recovery" trap before deeper markdown.
📉 Anticipated Smart Money Playbook
🔹 Scenario 1 – Short-Term Internal Rally (Liquidity Grab)
Price may engineer liquidity by forming a corrective retracement toward:
→ First Rejection Zone: ~1.33747 (aligned with fib 0.5 & diagonal internal trendline)
→ Extended Trap Zone: 1.34893 (near fib 0.705 + previous unmitigated OB)
This will allow Smart Money to unload positions before continuation lower. Expect a sharp sell-off post-liquidity sweep.
🔹 Scenario 2 – Continuation Without Full Retrace
If price fails to climb above 1.325xx, we could see an early breakdown after a minor internal rally. Key level to watch:
→ Support-to-Sell Zone: 1.31622
A clean break + retest here opens the way for a bearish expansion toward mid-July lows.
🎯 Key Levels to Monitor
Support Zone: 1.31622 → Valid for potential internal bounce
Short-Term Target if rally forms:
→ 1.33747 → Liquidity Cluster
→ 1.34893 → Final Trap Zone before HTF selloff
Mid-Term Target if breakdown confirmed:
→ 1.3050 → Old demand + final downside imbalance
→ Below 1.30 → Long-term liquidity void
🔍 SMC Takeaways
Premium Zone = Distribution, especially when price is beneath BOS
Discount Zone = Trap/Reload, but not always for bullish continuation
Market seeks efficiency, so every imbalance is eventually filled
True entry is not at key levels, but at confirmations within them (M5/M15 shift after sweep)
🎯 Trade Smart. Think Like Liquidity.
📌 Follow @ClintonScalper for more SMC breakdowns with precision.

XAUUSD
XAUUSD Updated in 30M :
The gold signal is marked on the chart based on the latest price changes and the supply and demand in the market. These points include the entry point, stop loss, and take profit.

Possible Gold Reaction Scenarios to Today's Jobs ReportMarket expectations for today's nonfarm payrolls change to be 104k, with the unemployment rate projected to rise to 4.2% from 4.1%. The divergence between payroll growth and the unemployment rate is mainly due to the birth-death model used in payroll calculations and expectations for either a halt or rebound in the labor force participation rate.
Fed Chair Powell recently stated that the "main number to watch" is the unemployment rate, which raises its importance in today’s data release. If the participation rate rises sharply, the unemployment rate could even increase to 4.3%, which may put a cap on the recent rally in the dollar index.
There is also a risk that a very strong payrolls number could be released alongside a rise in the unemployment rate. This combination may trigger a volatile and uncertain market reaction with multiple direction changes.
In similar past scenarios, markets typically reacted first to the payrolls data, then shifted focus to the unemployment rate shortly after.
For gold, look for 3310 and 3288 as pivot levels that could open the door to 3342 on the bullish case and 3270 on the bearish case.

Gold Market Rejected at 3310 as Bearish Channel HoldsGold market faced rejection at 3310, failing to break above the bearish channel, as DXY strength continues to weigh on price action. The inability to sustain above key levels reflects ongoing bearish pressure, unless a clear break occurs.
🔍 Key Insight:
3310 acts as a short-term ceiling
DXY strength supports the bearish stance, follow for more insights coment and boost idea .

Nonfarm Pay Attention Zone✏️ OANDA:XAUUSD is recovering and increasing towards the resistance zone of yesterday's US session. The 3315 zone is considered a strategic zone for Nonfarm today. A sweep up and then collapse to the liquidity zone of 3250 will be scenario 1 for Nonfarm today. If this important price zone is broken, we will not implement SELL strategies but wait for retests to BUY. It is very possible that when breaking 3315, it will create a DOW wave with the continuation of wave 3 when breaking the peak of wave 1.
📉 Key Levels
SELL trigger: Reject resistance 3315.
Target 3250
BUY Trigger: Break out and retest resistance 3315
Leave your comments on the idea. I am happy to read your views.

Gold’s Glitter Fades: Why $3,250 Is the Next Big Drop🧠 Fundamental Analysis
Despite recent bullish momentum, several macroeconomic and policy-driven headwinds could pressure gold prices lower toward the $3,250 mark:
1. **Fed Policy Shifts (Higher for Longer):**
The Fed’s persistent “higher-for-longer” stance on interest rates has kept real yields elevated. With the U.S. economy still showing resilience (strong labor market, consumer spending), markets are pricing out aggressive rate cuts. Higher real yields reduce gold’s appeal as a non-yielding asset.
2. **Strengthening U.S. Dollar (DXY):**
Renewed dollar strength, driven by global risk aversion and higher U.S. yields, is acting as a headwind for gold. Since gold is priced in dollars, a rising DXY typically puts downward pressure on bullion.
3. **China & India Demand Weakness:**
Physical gold demand in key markets like China and India has been softening. High local prices, subdued consumer sentiment, and tighter liquidity conditions in China are dampening jewelry and investment demand.
4. **Geopolitical Easing:**
As geopolitical tensions (e.g., Middle East or Ukraine) show signs of stabilization, the fear premium embedded in gold could start to unwind.
---
## 📉 Technical Analysis – Bearish Setup to $3,250
From a chartist’s view, gold shows early signs of technical exhaustion and potential reversal:
1. **Rising Wedge Breakdown:**
Gold recently broke down from a **rising wedge pattern** on the daily timeframe—a classic bearish continuation setup. Price failed to hold the breakout above \$2,450 and is now forming lower highs.
2. **Bearish Divergence (RSI & MACD):**
Both RSI and MACD are flashing **bearish divergence** on the weekly chart. While price made new highs, momentum indicators did not confirm—suggesting weakening buying pressure.
3. **Fibonacci Retracement Targets:**
A pullback toward the **50% retracement** of the March–July rally aligns closely with the \$3,250 level. This would be a logical technical correction zone.
4. **Volume Profile Gaps:**
The VPVR (Volume Profile Visible Range) shows a low-volume node around $3,250, implying weak support. If price breaches the $3,400 psychological level, a swift drop to $3,250 is plausible.
5. **Elliott Wave Perspective:**
If the recent top was wave 5 of a larger impulsive structure, we may now be entering an **ABC corrective wave**, with Wave C potentially targeting the $3,250 area.
---
## 📍 Key Levels to Watch
* **Resistance:** $3,420 $3,500
* **Support:** $3,400 → $3,250 → $3,000
* **Trigger Point:** Break below $3,400 with volume confirmation
---
## 📊 Strategy Notes
* **Short Bias**: Watching for rallies to short near \$3,400–\$3,450 with tight stops.
* **Risk Management**: Be cautious around key macro events (NFP, CPI, FOMC).
* **Confluence is Key**: Look for alignment between macro headwinds and chart setups.
---
📌 **Conclusion:**
While gold’s long-term bull thesis remains intact, a medium-term correction to $3,250 appears increasingly likely due to weakening fundamentals, overbought technical conditions, and waning momentum. Traders should prepare for volatility and focus on disciplined execution around key support zones.


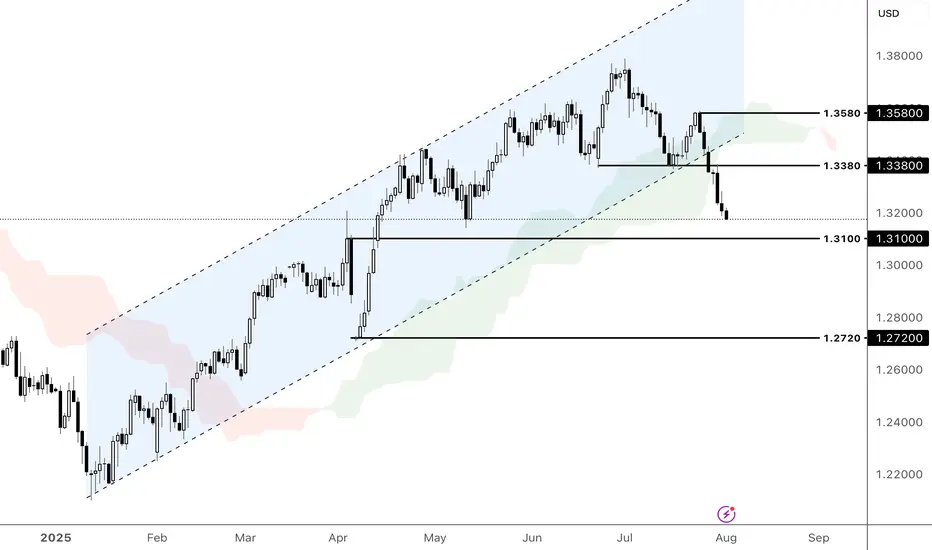
Could GBPUSD break the support at 1.3100?The pound extended its decline amid a stronger dollar and softening UK labour market, which fueled BoE rate cut expectations. From a technical perspective, GBPUSD broke out of the ascending channel and closed below the Ichimoku Cloud. If GBPUSD extends its decline and breaks the support at 1.3100, the price could approach the following swing low at 1.2720. Conversely, a rebound from the support at 1.3100 could prompt a retest of the resistance at 1.3380.
By Li Xing Gan, Financial Markets Strategist Consultant to Exness
Waiting for non-farm payroll dataGold prices (XAU/USD) remained under pressure in Asian trading on Friday, trading below $3,300, not far from the January low reached earlier this week. Gold failed to extend its modest overnight rebound, primarily due to the strong US dollar.
The Federal Reserve's latest hawkish tone has prompted a reassessment of the timeline for interest rate cuts, boosting demand for the US dollar and weighing on the non-interest-bearing asset, gold.
The US dollar index rose for the seventh consecutive day, reaching a new high since late May, further weakening gold's appeal. Key to the dollar's momentum lies in the latest inflation data: the US PCE price index rose to 2.6% year-on-year in June, while the core index remained stable at 2.8%, exceeding market expectations and reinforcing the view of persistent inflation.
"Both inflation data and GDP data suggest the US economy remains resilient, giving the Fed little reason to rush into easing," said a Fed observer. "This limits gold's near-term potential as a hedge."
Meanwhile, US President Trump signed an executive order on Thursday imposing import tariffs ranging from 10% to 41% on several trading partners, including Asian countries. Countries with trade deficits will face tariffs of at least 15%. This move has heightened global trade concerns, boosted market demand for safe-haven assets, and provided some support for gold.
Despite this, gold prices remain mired in a downward trend. Investors are generally maintaining a wait-and-see approach, awaiting Friday's release of the US July non-farm payroll report. This data is seen as a key indicator of economic resilience and the interest rate outlook. Expectations suggest an increase of 110,000 jobs and a slight rise in the unemployment rate to 4.2%.
The daily gold chart shows that prices are in a weak consolidation phase, capped by key resistance near $3,320. If gold prices fail to break through this area, there is a risk of further decline in the short term. Stronger resistance lies above $3,350. A breakout on strong volume could trigger a rebound towards the $3,380 area, potentially pushing the price above $3,400.
As for downside support, the 100-day moving average provides initial support near $3,270. A break below this could trigger further downward pressure, targeting the $3,240 area, the June low. A further break below this level would target the psychologically important $3,200 level.
In terms of indicators, the MACD death cross continues, with a shortening red bar, indicating weakening bearish momentum but no reversal. The RSI remains in neutral to weak territory, not clearly oversold.
The current gold trend is characterized by a "structurally bearish, sentimentally supportive" pattern. Despite the trade war and heightened global risk aversion, the Federal Reserve's caution about inflation and the strong dollar are exerting significant pressure.
If the July non-farm payroll data is strong, gold could test further technical support. Conversely, weak data or a pullback in the dollar could trigger a technical rebound. PEPPERSTONE:XAUUSD ACTIVTRADES:GOLD VANTAGE:XAUUSD FOREXCOM:GOLD EIGHTCAP:XAUUSD FOREXCOM:GOLD
USDJPY Analysis : Key Reversal Zone After Parabolic Rally🧠 Market Psychology & Structure
The USDJPY 4-hour chart reveals a classic parabolic curve pattern signifying an acceleration phase in bullish momentum. This phase typically occurs during the final stages of a bullish move, where price action becomes increasingly steep due to aggressive buyer participation.
The rounded curve drawn on the chart reflects momentum compression—where pullbacks become shallower, and higher highs are formed rapidly. However, this pattern often ends in a blow-off top or a sharp correction, especially when approaching key supply zones.
🧩 Key Technical Highlights
Major Break Zone: The previous resistance around 148.80–149.00 (now flipped to support) was clearly broken with strong bullish candles, confirming trend continuation.
Break Out Demand : Price retested the breakout zone (around 149.80–150.00) before launching higher, validating this level as a new demand zone.
Current Price Action: The pair is currently hovering around 150.50 after a powerful rally, showing early signs of exhaustion with smaller bullish candles and slight upper wicks.
🔍 Target Area – Next Reversal Zone (151.80–152.30)
The green highlighted zone marks a strong supply area / reversal zone, identified from:
Previous price rejections in historical data.
Overbought conditions due to vertical rally.
Completion of the parabolic structure (climax zone).
We can expect price to reach this zone in the coming sessions, where it may:
Face strong selling pressure.
Trigger short positions from institutional sellers.
Lead to distribution or reversal back toward the demand area near 150.00.
🔄 Forecast & Trade Plan
Scenario 1 (High Probability): Price taps into 151.80–152.30, forms bearish engulfing or rejection wick, then pulls back to 150.00 or lower.
Scenario 2 (Invalidation): Strong breakout above 152.30 with momentum—bullish continuation towards 153.00+ possible.
🧠 Trader’s Mindset (MMC Insight)
This chart suggests a matured bullish trend nearing exhaustion. As smart traders, we anticipate rather than react. Wait for the price to reach the supply zone, then observe for confirmation (bearish structure, divergence, candlestick pattern) before shorting.
Avoid chasing longs at these highs—risk-to-reward is no longer favorable. Patience will offer a much cleaner entry if the reversal unfolds as expected.

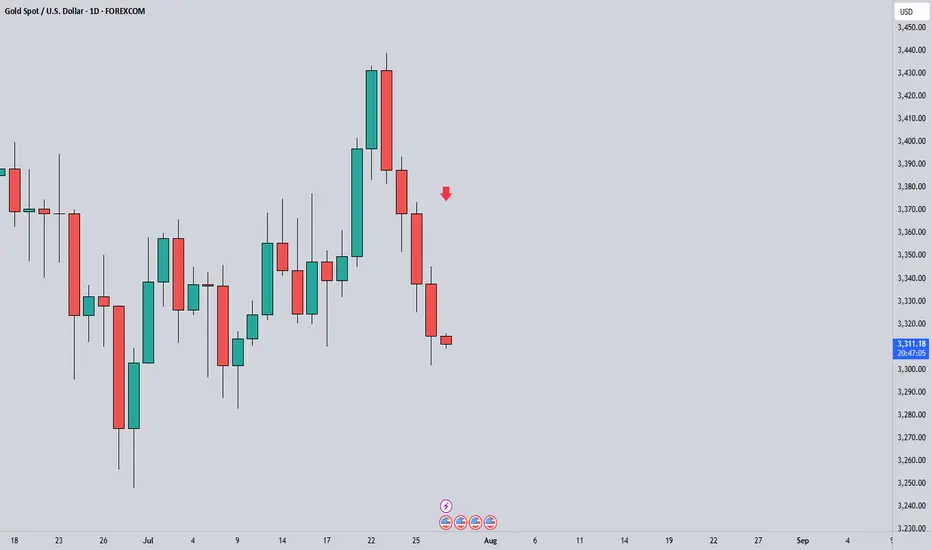
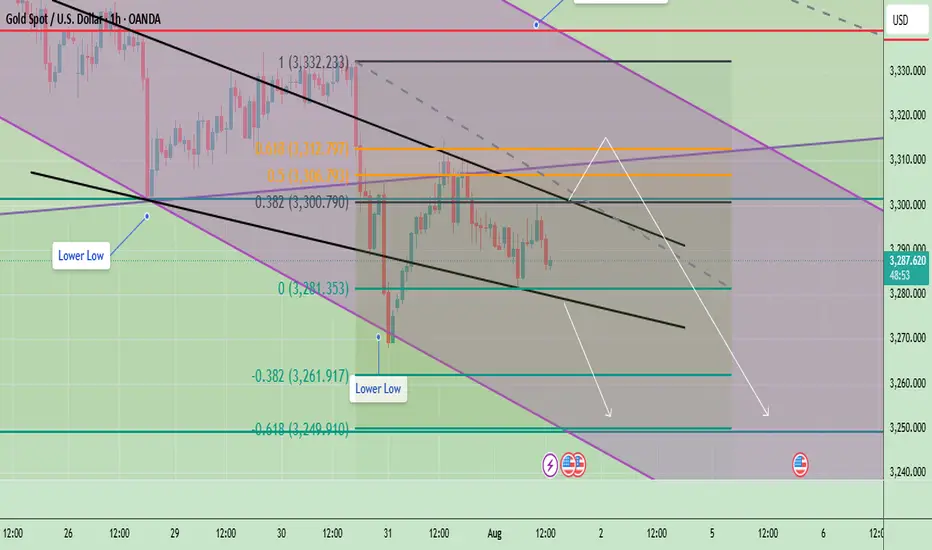
Gold Price Consolidates in Symmetrical Triangle, Breakout Ahead?Gold shows a clear bearish trend within a well-defined downward channel. Price action continues to form lower highs and lower lows, reinforcing the ongoing downtrend. The recent rejection from $3,312 suggests that bulls are struggling to regain control, and the market remains pressured by selling momentum. The price is currently hovering near $3,287 just above horizontal support zone.
📉 Potential Scenarios
- Bearish Continuation (Most Likely)
- If price continues to stay below $3,300 and breaks below $3,281, it may aim for $3,261 and $3,249.
- A close below $3,281 would confirm further bearish pressure and signal downside continuation toward the $3,240s range.
- Short-Term Bullish Retracement
- If price holds above $3,281 and breaks above $3,300–$3,312, a relief rally may occur at first resistance: $3,306 and second resistance: $3,312.
- However, unless gold breaks above $3,332 (previous swing high), this would still be considered a bear market rally.
- Range-bound Movement
- A third scenario is sideways price action between $3,281 and $3,312, where neither bulls nor bears take control immediately. This would represent market indecision or awaiting external catalysts (e.g., economic data, Fed policy).
🔍 Trend Outlook
- Short-Term Trend: Bearish
- Medium-Term Trend: Bearish, unless price breaks and sustains above $3,312
- Long-Term Trend: Neutral-to-bullish, as long as price holds above the macro support zone near $3,240
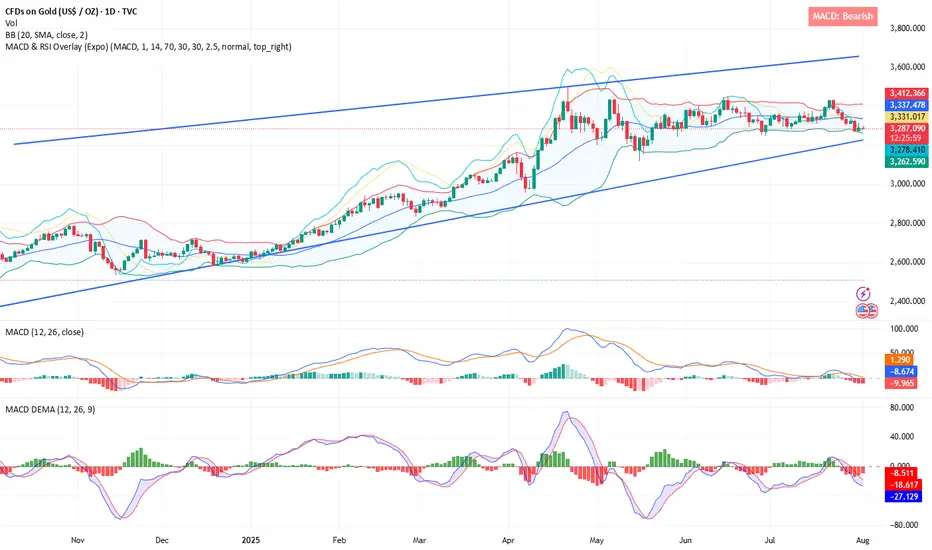
1D Chart Long Term Possible Scenario
The price is currently trading around $3,285, sitting just above the triangle’s ascending trendline support and within a key horizontal demand zone around $3,250–$3,300, which has held multiple times in the past.
If bulls manage to push the price above $3,360–$3,400, it could confirm a breakout and open the door toward the next major resistance at $3,450. However, if price fails to hold above the current ascending trendline, a breakdown could retest the base support near $3,248 or even lower toward $3,150
Gold is currently in a neutral consolidation phase within a symmetrical triangle, with both bullish and bearish breakout scenarios possible. The breakout direction from this pattern—expected in the coming weeks, will likely set the tone for gold's medium-term trend.
Note
Please risk management in trading is a Key so use your money accordingly. If you like the idea then please like and boost. Thank you and Good Luck!
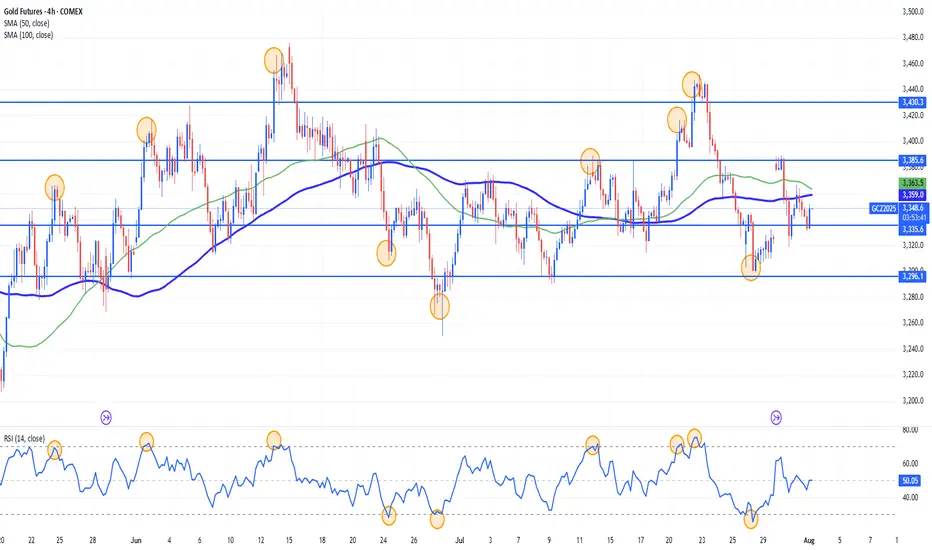
Gold Range-Bound and Ripe for Mean Reversion Plays?Gold has been locked in a sideways, range-bound regime for months, largely oscillating between the 3400 and 3160 levels. This lack of clear directional trend stems from conflicting fundamental forces: on one hand, sticky inflation and resilient U.S. data have bolstered the U.S. dollar and yields, weighing on gold. On the other, global growth concerns and geopolitical tensions continue to underpin demand for the metal as a safe haven. The push and pull of these opposing themes has created an environment of indecision and choppy price action.
While long-term investors may find this frustrating, range traders and mean reversion strategies are thriving. With technical boundaries so well-defined, short-term oscillations within the range are offering repeated opportunities for disciplined entry and exit.
Currently, XAUUSD is trading just under the 3296 level after a recent rejection from the 3350s. The bearish structure suggests a potential leg down toward the 3160–3180 support zone. However, absent any major economic surprises or geopolitical shocks, this could merely be another deviation from the mean rather than a true breakdown. Indicators like RSI and Stochastic Oscillator are already hinting at early signs of bullish divergence.
If price holds above or near 3160, the setup for another mean-reversion trade back toward the mid-range (around 3296 or higher) could unfold. In the current environment, fading extremes rather than chasing trends remains a strategy of edge, as depicted by the 14 period RSI.