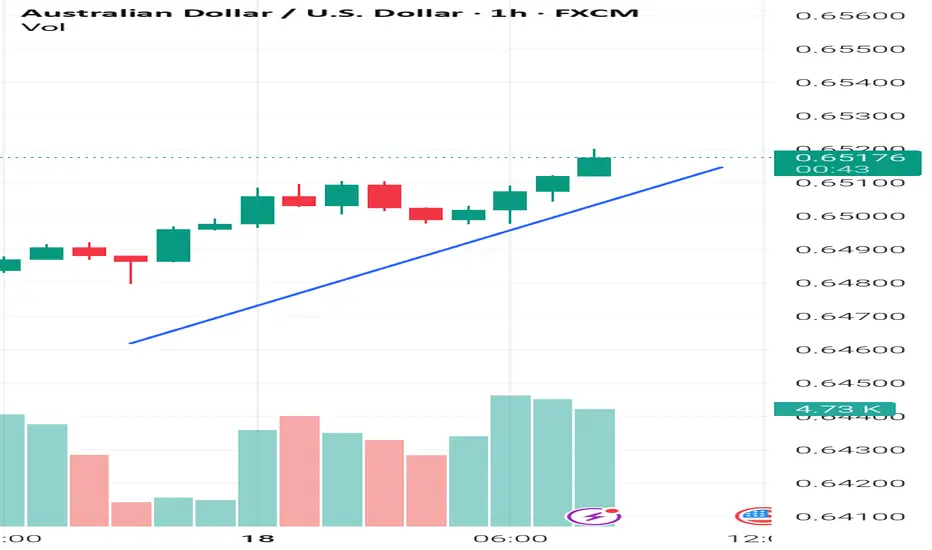
AUD USD long to close out the week? With the S&P pushing new highs, the VIX below 17 and recent dovish comments from WALLER. I feel the stage could be set for a positive end to the week. The WALLER comments having moved the needle towards USD weakness into the weekend.
I've left the JPY alone due to potentially strange movent ahead of weekend elections.
The trade is a 20 pip stop loss with a 25 pip profit target.
I've chosen the AUD to long because at the time of placing the trade, it's the currency that has momentum against the other currencies.
It sounds simple but the risk to the trade is USD strength.
If it's ongoing, I will close the trade before end of day to avoid weekend risk.
Fundamental Analysis
USDCAD bearish structureprice action, you gotta love structure thou. 🧭 Current Sentiment
Bias: Neutral to Bearish (subject to change based on upcoming U.S. data and oil prices)
Market Context: Consolidating in a tight range after recent USD weakness & steady CAD support from oil prices.

A possible trend change after a 3-year slideEAND has been in a downtrend since April 2022, but we could be witnessing the start of a reversal into an uptrend. Price has been consolidating since the beginning of 2025 and now shows signs of a breakout, supported by a strong recent earnings report.
Key Highlights
✔️ Robust earnings growth
✔️ Strong balance sheet
✔️ Technical setup showing breakout potential
✔️ Positive sentiment returning to the sector
This could be a turning point for EAND, a break above key resistance may signal further upside.
Do your own research and manage risk accordingly.

XAUUSD
XAUUSD Updated in 15M :
The gold signal is marked on the chart based on the latest price changes and the supply and demand in the market. These points include the entry point, stop loss, and take profit

Investment cum Trading IdeaDELHIVERY LTP 330 Tgt:370/430/470 🤞🏻🤞🏻🤞🏻 Purely long-term investment may add on dips or hold calmly Will Review at price range of 480-500 for further move

Fundamental Market Analysis for July 18, 2025 GBPUSDSterling is stabilising near 1.34400 after an extended sell‑off, aided by robust labour‑market data: average weekly earnings including bonuses grew 6.1 % y/y and unemployment held at 4 %. The Bank of England signalled that policy easing will be discussed only if employment cools markedly, effectively shutting the door on immediate rate cuts and supporting the pound.
Exclusive for our readers – a 202% bonus on deposits of $202 or more! Give the promo code BTC202 to customer support and start trading with TRIPLED capital.
The external backdrop also favours further gains. Uncertainty over US tariff plans could weaken near‑term dollar demand if Washington misses its 1 August deadline for bilateral agreements. Meanwhile, London is promoting a tech‑and‑defence partnership with the US, reducing pressure on UK exporters and attracting inflows into GBP‑denominated assets.
The 10‑year Gilt‑UST yield gap has narrowed to –75 bp, well above the January trough (‑95 bp), improving the relative appeal of UK bonds. A close above 1.35000 would trigger hedge‑fund demand, and lingering dollar softness, hinted at in the latest FOMC minutes, leaves scope for a run towards 1.35750. A protective stop is placed at 1.33800, just below last week’s intraday pivot.
Trade idea: BUY 1.34400, SL 1.33800, TP 1.35750

GBPJPY long outlook Looks like we just broke resistance area now heading up to next resistance area level.
I have set some support and resistance lines to project my outlook .
What do you it’s think?

Avax to 33$ ?It really amaze me how simmillar it moves comparing to BTC when it was at 22k , fun thing is that it's starting its uptrend from 15$ just like BTC that started it's move at 15k , I have a feeling that this one will outperform most alts when an alt rally starts
Overall it's in a very good spot to buy, it's in lower section of a big macro downtrend , almost done 50% correction from it's previous move , lots of room to the upside and positive news like Fifa using it

Gold Market Reacts to 3377 Mitigation — Eyes on 3388 Amid Job DaGold market mitigated the 3377 level, pushing price down to sweep imbalance at 3320’s. With the daily demand candle formation holding, a rejection here could ignite a push to take out full liquidity at 3388.
As we approach the unemployment claims release (forecast: 233k), market sentiment leans toward a hawkish gold reaction—should data indicate more jobs are needed, the bullish pressure on gold could intensify. follow for more insights, comment , and boost idea

Aegean: The cheapest airline in Europe?Aegean is flying high, but the stock remains grounded at -71.5% – The market values it at just 28.5% of its real worth: The cheapest airline in Europe?
Aegean: Time for the Market to Wake Up
We’ve said a lot about Aegean. About its stock going nowhere, about how it's been ignored by the market, about how it just refuses to move. Sure, some of that skepticism is understandable—geopolitical risk, a volatile global landscape, travel disruptions. But at some point, we need to look at the numbers.
Because this isn’t just another airline stock. Aegean is sitting on assets worth over €4 billion. And its current market cap? Just €1.14 billion.
Do the math: that's a 71.5% discount — the stock is trading at only 28.5% of what the company is worth on paper.
If that’s not undervalued, what is?
60 Aircraft, €4 Billion in Investment
This isn’t hype — it's hard investment. Aegean has committed to 60 Airbus A320/321neo aircraft by 2031, with a total fleet investment reaching $4 billion. The two newest additions, the A321neo XLRs, have a flight range of over 10 hours. That opens the door to long-haul destinations far beyond Europe — like India, the Maldives, Nairobi, and more.
In fact, direct flights to India are already scheduled to start in March 2026, ahead of the original plan. This isn’t about just growing the fleet — it’s a shift in scale, reach, and ambition.
Meanwhile, Aegean has already received 36 of the 60 aircraft. The buildout is real. And it’s happening now.
An Airline Investing in Itself
Aegean isn't just growing in the air — it’s building on the ground. It has launched maintenance and training facilities, is servicing third-party aircraft, and is investing heavily in talent and education.
From 1,878 employees in 2013 to nearly 4,000 today. Dozens of scholarships. A full ecosystem of aviation infrastructure is taking shape — one that positions Aegean not just as an airline, but as a regional aviation hub.
How is all of that still being missed on the board?
The Market Is Rallying – Aegean Is Not
While the Athens Stock Exchange hits 15-year highs, and large caps are breaking records, Aegean’s stock is standing still.
It’s one of the few big names that hasn’t made a move — and that makes it a prime candidate for a snap revaluation.
All it needs is a spark — a catalyst. A major deal. A re-rating. A surprise quarter. Something to jolt the market awake. And when that happens, it won’t be slow or gradual. It’ll be violent and vertical.
Geopolitics? Sure. But Everyone’s Facing It
Yes, global tensions are high. Wars, inflation, airspace closures, unpredictability. But every airline is in the same storm. What matters is how you build resilience. And Aegean has done that.
It emerged from the COVID crisis leaner, stronger, more focused. While others pulled back, Aegean doubled down. That’s not weakness — that’s conviction.
Why the Discount Still Exists
The short answer: the market hasn't connected the dots.
The new fleet hasn’t been fully priced in.
The strategic expansion hasn’t registered.
The infrastructure buildout hasn’t translated into market value.
Investors are still judging it on short-term P&Ls — not on what it’s quietly turning into.
Time for That to Change
It’s time for the market to take another look. To see the €4 billion in assets not as a future maybe — but as a real foundation for growth. To recognize the international pivot. To price in the hidden strength.
Aegean has the fundamentals. It has the vision. It has the operational edge.
What it doesn’t have — yet — is the recognition on the board.
But that’s coming. And when it comes, the move won’t be subtle.
Aegean is undervalued. Not just theoretically, but blatantly — with a 71.5% discount staring everyone in the face. The business is solid. The growth is real. The investments are in motion.
The market will catch up. The only question is: will you be in before it does?

EUR/USD long: The Fed Chair debacle is getting spicyHello traders
My previous EUR/USD long did not pan out but I am swinging again. My entry order at 1.0563 was filled by the skinny skin of my teeth but so far so good. I'll use a trailing stop for this trade.
The pressure on Fed Chair Powell is being ramped up by Trump's attack dogs with allegations of mismanaging Federal funds(gasp :) ) during the FOMC headquarters.
We all saw the result of the rumor that Powell was fired/is considering resigning yesterday and as much as I am sure it pained DJT, he had to refute the rumor, no doubt on advice from Bessent.
In addition, FOMC board member Waller publicly dissented today and suggested a rate cut at the July meeting.
On the economic calendar we have the ECB rate decision, JOLTS, ADP and finally FOMC over the next two weeks.
This is purely a technical play but I am keeping a close eye on the bond markets, the
CME FedWatch tool and as for trade and tariffs, who cares...
I mentioned the Federal Court of Appeals case regarding the IEEPA court decision starting on 7/31/2025. For anyone interested in the court's decision,
www.cafc.uscourts.gov
More importantly, you can sign up for a notification at courtlistener.com which is a free service.
I have used it in the past and not only is it free but I also received the notification in a very timely manner.
www.courtlistener.com
Best of luck.

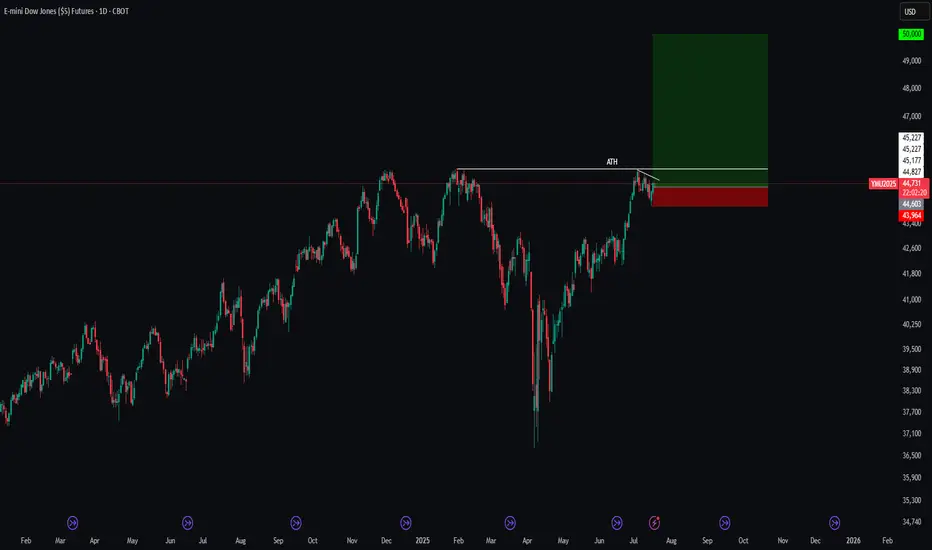
[YM] Dow Jones ATH explorationHere is my point of view on SEED_CRYPTOSLATE_VANTAGEPOINT:YM for the next weeks/months. I want to see the bullflag break to go through the ATH and print even more. Great investment opportunity on this one for the long play.
Great Trade !
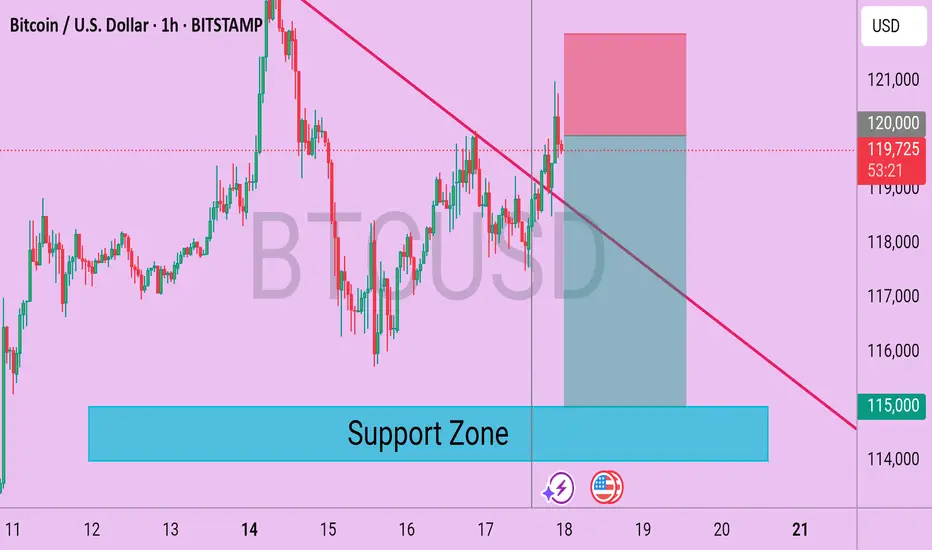
Bitcoin (BTC/USD) 1H Technical Analysis – Breakout in ProgressBitcoin is showing bullish intent after breaking above a descending trendline resistance on the 1-hour chart. The breakout occurred with decent bullish momentum, suggesting buyers are regaining control in the short term.
📈 Chart Observations:
Descending Trendline Broken: Price has successfully broken above a well-respected descending trendline, which acted as resistance over the past few sessions. This breakout may signal a shift in short-term market structure.
Support Zone: The marked support zone around $115,000 continues to act as a critical demand area. Price has rebounded multiple times from this zone, reinforcing its significance.
Current Price Action: BTC is currently trading near $119,800, just under the round-level resistance of $120,000. A clean hourly close above this level could open room for further bullish continuation.
📊 Key Levels:
Resistance: $120,000 (Psychological level)
Immediate Support: $118,000
Major Support Zone: $115,000–$114,000
📉 Bearish Scenario:
If BTC fails to hold above the broken trendline and slips back below $118,000, a revisit of the support zone near $115,000 becomes likely. Bears may step in again if the price fails to sustain higher highs.
✅ Conclusion:
BTC is showing potential for a short-term bullish reversal after breaking out of its descending pattern. Traders should monitor for confirmation through price continuation above $120,000. However, a cautious approach is advised near resistance levels, and invalidation below $118,000 could favor sellers once again.
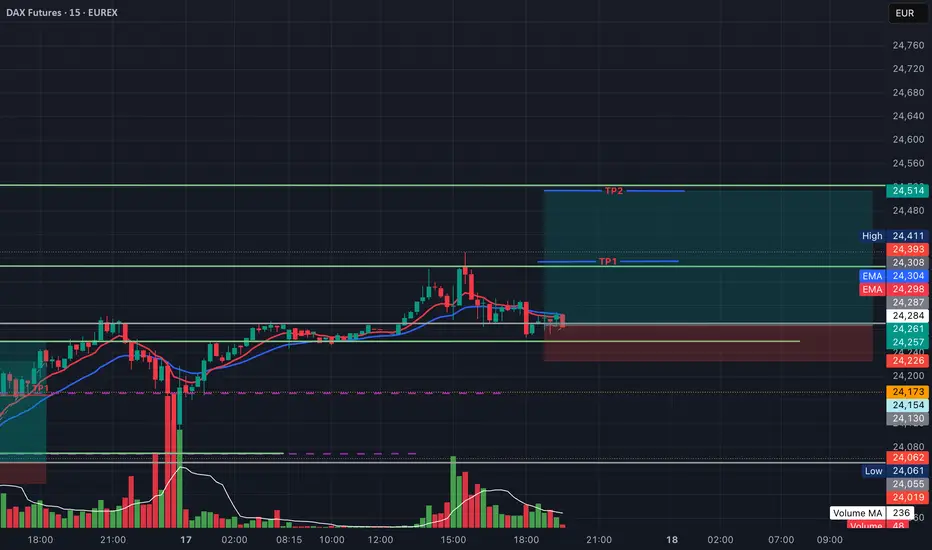
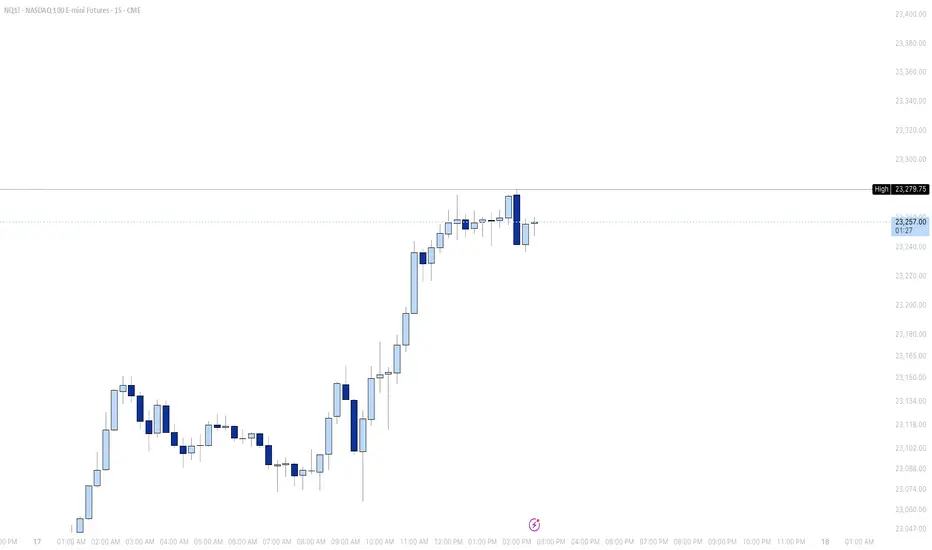
DAX Futures (FDAX1!) – Intraday Long Setup from Support with TP1Instrument: FDAX1! (DAX Futures – EUREX)
Chart: 15 mins
Type: Intraday / Day Trade
DAX Futures is holding support near 24,259 after a recent pullback. Watching for a potential bounce if price remains above this level, with a move toward intraday highs as a possible target.
This setup is valid until tomorrow's session.
📌 Not financial advice – for educational purposes only.
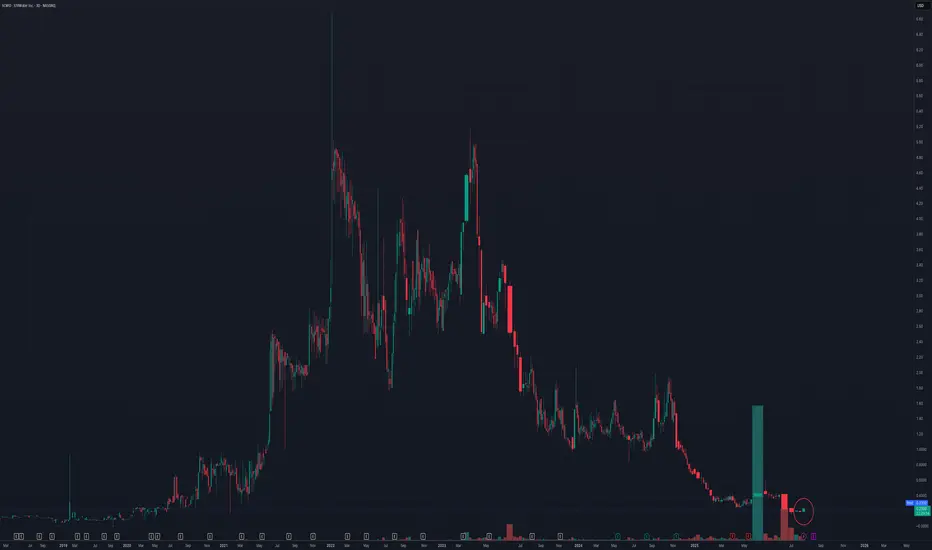
SCWO: High Risk, Big Potential374Water Inc. (NASDAQ: SCWO) is a U.S.-based environmental technology company specializing in waste management solutions. Their flagship innovation, AirSCWO™, utilizes supercritical water oxidation to effectively destroy organic waste, including PFAS and other contaminants. This technology is particularly relevant for municipal, industrial, and military applications.  
⸻
📈 Bullish Catalysts
1. Government Contracts & DoD Engagement: 374Water’s AirSCWO™ technology has been deployed in a Department of Defense Environmental Security Technology Certification Program (ESTCP) project, highlighting its potential in federal applications. 
2. Analyst Optimism: Analyst projections suggest a significant upside, with some forecasts estimating the stock could reach $2.55 within the next 12 months, representing over a 1,100% increase from current levels. 
3. Insider Ownership: Approximately 20.3% of the company’s stock is held by insiders, indicating a strong belief in the company’s future prospects. 
4. Revenue Growth Potential: Projections indicate a substantial increase in revenue, with expectations of $26.93 million this year and $55.69 million the following year, up from $0.45 million. 
⸻
📊 Technical Analysis
As of July 17, 2025, SCWO is trading at $0.23. Technical indicators present a mixed picture: 
• Moving Averages: Short-term moving averages (MA5 to MA50) suggest a bullish trend, while longer-term averages (MA100 and MA200) indicate bearishness. 
• Momentum Indicators: The Relative Strength Index (RSI) is at 72.6, suggesting the stock is overbought. The MACD is positive, indicating upward momentum. 
• Volatility: The Average True Range (ATR) is 0.0083, reflecting high volatility. 
⸻
🔮 Price Prediction
Analyst forecasts for SCWO vary:()
• Short-Term: Some models predict a modest increase to $0.50 by the end of 2025. 
• Long-Term: Optimistic projections estimate the stock could reach $2.55 within 12 months. 
⸻
⚠️ Risk Considerations
Despite the bullish catalysts, investors should be cautious due to the company’s current financial metrics:()
• Negative Earnings: The company has a negative net income of -$12.43 million and a net profit margin of -2,791.39%. 
• High Volatility: The stock exhibits significant price fluctuations, which may not be suitable for all investors.()
• Market Sentiment: Technical indicators suggest the stock is currently overbought, which could lead to a price correction.()
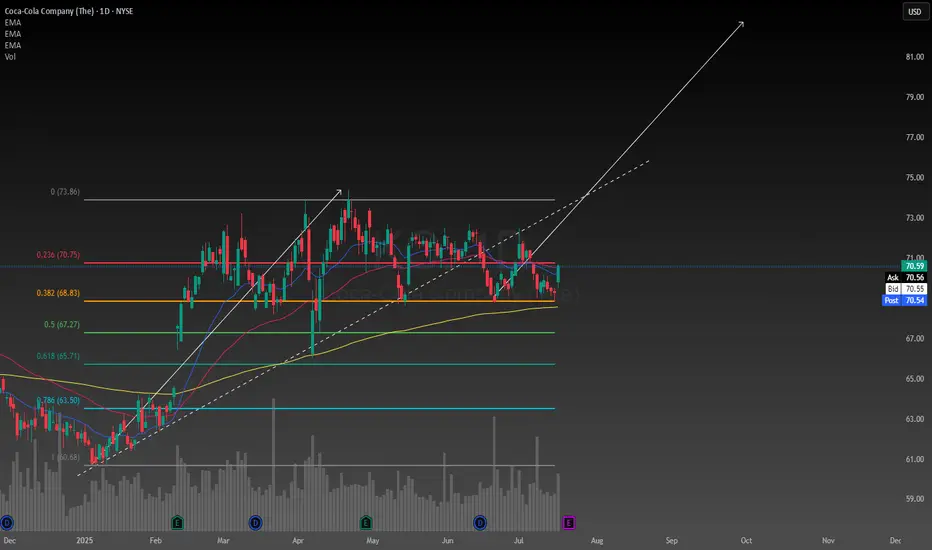
Coca Cola to protect my portfolio and help it growOne of the most important things we must try to determine as investors is what company is the best at what they do in their field. In my opinion Coca Cola is and has always been the number one soft drink manufacturer, always finding new yet subtle ways to stay ahead of their competition.
The reason I have allocated a decent amount of my portfolio to Coca Cola is a combination between their reliable track record of creating value, and paying dividends. People love junk food so it gives me high conviction to hold the stock long term. The company also demonstrates consistent, and reliable methods of generating organic revenue, and constantly finding new ways to cut costs and improve their profit margins.
Despite what some other critics may claim about the stock being over valued, the intrinsic value of the stock happens to be $77 with a range between $48-$180. According to technical analysis it is over valued. I have too much respect for Coca Cola to trust technical analysis in my decision to hold the stock, I am rely solely on fundamentals. According to my perspective on the company it is in fact undervalued.
Another positive catalyst I have noticed was when President Trump said he thinks Coca Cola should be made with cane sugar in the US, I think that would be a great idea, not only would it be healthier the soda would also taste better. Coca Cola looks like its going to stay ahead of the game for the foreseeable future.
Coinbase Premium indicates High Risk on BTCThe Coinbase Premium Indictor shows the CBP risk is high. The previous times the CBP premium has reached these levels, CRYPTOCAP:BTC generally started a range or downtrend.

Good setup to short USDJPYRecently the risk emotions caused by the White House and inflation worries it produced drives long term US Treasury yields rising, with 20-yr yield cross up to 5% once again.
Yet, you can see that the yield difference are still at a dropping trend. Moreover, the Fed is expected to cut 125 bps in the next 15 months according to the swap market.
Combined with the techincal levels, it's a good price to get into a short position of USDJPY. I don't know about you guys. I'm in

This is my main template for Futures and ForexThis is my main template for Futures and Forex! It is optimized specially for the strategy "Momentum Mastery".
It includes all the necessary tools and indicators needed for the strat.
All setings are READY!!!
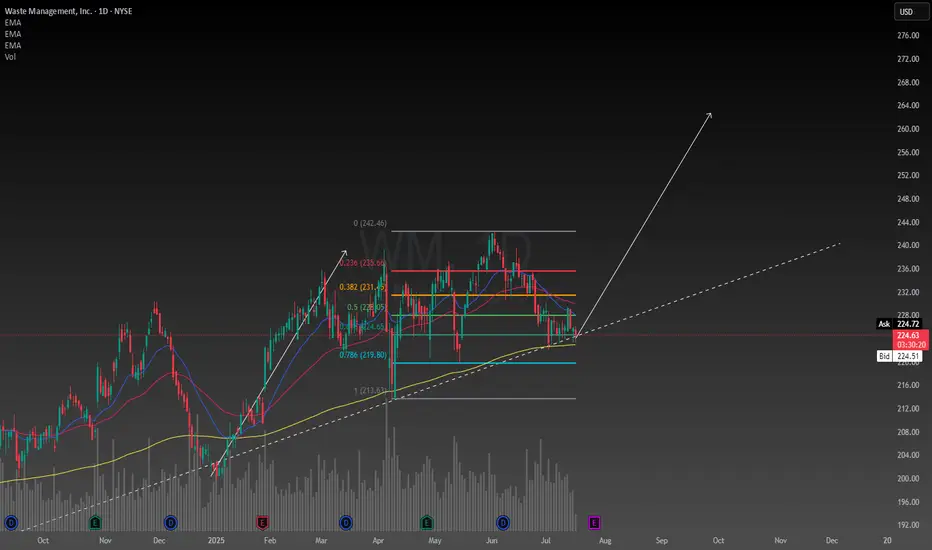
Waste Management confluencesFirst of all fundamentally the company is basically essential to our survival so I have no reason to believe they will go out of business any time soon. Earnings report soon should bring about some volatility. I was foolish enough to buy the top a couple months ago and deciding today I will add the the position because I like this price. Even though I bought the top, it was still below the intrinsic value at the time so it was a reasonable decision.
With my simple trendline and rudimentary use of a Fibonacci I am able to set a price target of $260 depicted by my drawing of a potential new leg up. This is backed up by the absolutely fundamental usage of a calculation of the intrinsic value, which by my calculation is $280, and has a range between $170-$640 however these numbers may need to be adjusted after the earnings report. The value is now well below the intrinsic value so I am seeing this stock as a really good deal now.
Despite any uncertainty in the economy Waste Management has seemed to outperform during these times so it is in my portfolio defensively. This stock is strong when it needs to be, which is why I like it.
EURCHF Sell nowEURCHF amazing Selling Point based on LS on Potential PRZ , and other measures. Expecting to touch atleast 50% of Target :) however we can always rider along if its working for us :) what are your thoughts?

Oolong news stirs up gold market trend analysisWe decisively prompted support and arranged long orders near 3320. While the bottom stabilized, Trump suddenly released a smoke bomb, saying that he was considering whether to fire Fed Chairman Powell. The risk aversion sentiment exploded instantly, and gold soared in the short term, hitting the target of 3340-3345 in a few minutes, and the highest rose to 3377! But then Trump denied the relevant plan, and the risk aversion sentiment quickly cooled down. The gold price immediately fell from a high level, and the market returned to a volatile pattern. At present, the risk aversion drive has been falsified. In the short term, we need to focus on the trend opportunities after the high and fall. Considering that the news is still uncertain, it is recommended to wait and see first, and wait for the situation to become clearer before entering the market.
🔍Technical observation: The 1-hour chart of gold shows an obvious high and fall pattern, accompanied by a long upper shadow line closing. If there is no new risk aversion stimulus, the short-term momentum for another attack is limited.
📉Operational suggestions: Maintain the main idea of rebound short selling, pay attention to the short-term pressure in the 3365-3370 range, and choose to arrange short orders. ⚠️It should be noted that news has a great impact on the market. Transactions need to be executed decisively, but be careful not to be led by short-term fluctuations. Strict implementation of trading plans is the key.

JAPAN as a HERO? UP! GOKU Last Fight! JAPAN is the last one to join the party! The final fight for the #BlowoffTop.
Why is this so important? If you look at correlations with BTC, global liquidity, China, the Fed’s interest rates, and more, Japan plays a key role. After China, Japan is the next to wake up and give the final push to this Bull Market.
The last time the Nikkei dropped more than 25% was during the COVID crash. What happened next? It rallied 26% in the first 52 days and extended its Bull Market to over 88% from the bottom.
With the current Carry Trade crisis (still unresolved), the TVC:NI225 has dropped more than 25% again, and guess what? It’s up 26% in the first 52 days... History doesn’t repeat, but it often rhymes.
It’s feeling like 2017 all over again... What do you think? 🚀📈
