NZDUSD BUYSNZDUSD is expected to buy to complete the crab pattern around 0.61200 psychological level BOUNCING FROM A 1HR FVG(Fair value Gap). we saw an expected rate cut of NZD interest rate at 25 basis point(0.25%) was was a dovish stand by the central bank. with investment sentiment still high on risk-on assets, I expect nzd to bully the green-back which is struggling with low interest rate figures as a result of declining inflation figures nearing its 2024 inflation target of 2% and global trade wars.
Fundamentalanalsysis

WHAT'S THE FATE OF INTEL CORPORATION STOCK?From the perspective of technical analysis, INTC is approaching a key psychological level at $19. In addition, it's in a downtrend. If the key level should hold by pushing price higher, leading to a break out of the downtrend line and closing with a strong bullish candle above the down trend line and resistance level around $22, this will indicate a strong bullish signal. Likewise, this is supported by a bullish divergence signal from the awesome oscillator. Otherwise, a failure of the psychological level of $19 may lead to price dropping further.
Furthermore, we need to look beyond technical analysis. Fundamental analysis also has some insights for our decisions.
Fundamentals for INTC established a bearish bias. The summary is as follows:
Financial Health:
• Negative EPS (-$4.47): Intel is losing money.
• High Debt ($50B): This can limit growth and increase risk.
• Declining Revenue: Sales dropped from $80B (2021) to $51B (2024).
Valuation:
• Cheap P/S (1.66x), but no P/E (due to negative earnings).
• Dividend yield (2.56%) is at risk of being cut.
Sentiment:
Stock price fell from $56 to $19.55 (65% drop). Institutional investors may be wary.
Fundamentally, INTC is weak — best suited for speculative, long-term bets (if you believe in a turnaround).
Strategy for Traders:
1. Conservative Approach:
- Wait for:
- Break out of downtrend line and resistance around $22 and positive earnings/news.
- Rising volume to confirm momentum.
- Target: $27–$30
- Stop-loss: Below $17 (apply proper risk management).
2. Aggressive Approach:
- Buy near $18–$19 with tight stop-loss ($16).
- Target resistance level at $22.
3. Avoid If:
- You’re risk-averse or prefer stable companies.
- Intel’s debt/revenue trends worsen.
Note:
- Short-Term Trade: Only if breakout confirms ($22+). High risk, but possible 20% bounce.
- Long-Term Investment: Avoid unless Intel shows profit/debt improvement.
Always use stop-losses —Intel’s fundamentals make it volatile.
Disclaimer: This is not a financial advice. The outcome maybe different from the projection. Don't take the signal if you can't accept the risk.

WHAT'S THE FAITH OF INTEL CORPORATION STOCK? From the perspective of technical analysis, INTC is approaching a key psychological level at $19. In addition, it's in a downtrend. If the key level should hold by pushing price higher, leading to a break out of the downtrend line and closing with a strong bullish candle above the down trend line and resistance level around $22, this will indicate a strong bullish signal. Likewise, this is supported by a bullish divergence signal from the awesome oscillator. Otherwise, a failure of the psychological level of $19 may lead to price dropping further.
Furthermore, we need to look beyond technical analysis. Fundamental analysis also has some insights for our decisions.
Fundamentals for INTC established a bearish bias. The summary is as follows:
Financial Health :
• Negative EPS (-$4.47): Intel is losing money.
• High Debt ($50B): This can limit growth and increase risk.
• Declining Revenue: Sales dropped from $80B (2021) to $51B (2024).
Valuation:
• Cheap P/S (1.66x), but no P/E (due to negative earnings).
• Dividend yield (2.56%) is at risk of being cut.
Sentiment:
Stock price fell from $56 to $19.55 (65% drop). Institutional investors may be wary.
Fundamentally, INTC is weak — best suited for speculative, long-term bets (if you believe in a turnaround).
Strategy for Traders:
1. Conservative Approach:
- Wait for:
- Break out of downtrend line and resistance around $22 and positive earnings/news.
- Rising volume to confirm momentum.
- Target: $27–$30
- Stop-loss: Below $17 (apply proper risk management).
2. Aggressive Approach:
- Buy near $18–$19 with tight stop-loss ($16).
- Target resistance level at $22.
3. Avoid If:
- You’re risk-averse or prefer stable companies.
- Intel’s debt/revenue trends worsen.
Note:
- Short-Term Trade: Only if breakout confirms ($22+). High risk, but possible 20% bounce.
- Long-Term Investment: Avoid unless Intel shows profit/debt improvement.
Always use stop-losses —Intel’s fundamentals make it volatile.
Disclaimer: This is not a financial advice. The outcome maybe different from the projection. Don't take the signal if you can't accept the risk.

EGX30 Increases by 0.62%EGX30 stock has jumped to an upper region, and it's apparent that this has been a gradual upward trend due to a mutual connection between positive fundamental news and the technical candlestick analysis. It has already breached the resistance line of 32,621.248 and reached the maximum at 32,695.736 points. On a personal level, I expect it to rebound not because of any negative news but because of taking into consideration the short-term history patterns. In case of rebounding, it may reach the support line 32,536.119, the support line 32,408.426, then the support line 32,376.503. In conclusion, EGX30 is increasing in the pink region by 0.62%.

USDCAD Short Setup – Support Broken, More Downside Ahead?Bias: ✅ Strong Sell
Timeframe: 4H
Pair: USDCAD
Week: 26–30 May 2025
⸻
🔍 Technical Setup:
USDCAD just broke a major support zone around 1.3732, opening the door for continued downside into the next demand zone.
• Entry: Break and retest or continuation below 1.3732
• Stop Loss: Above resistance at 1.3813
• Take Profit: Next support near 1.3467
• Risk-Reward Ratio: ~3.9R
• Structure: Lower highs, clean breakdown, bearish momentum
⸻
🧠 Macro Confluence:
• 📉 USD Weakness: Dovish Fed, weak macro outlook (Investogenie Score 1.8 ↓)
• 🇨🇦 CAD Recovery: Hawkish BoC, conditional score surged from 2 → 10
• 📊 Seasonals: CAD favored
• 🧾 COT: Net bearish shift in USD, CAD corrective phase expected
• ⚠️ News Risk: CAD GDP & US GDP this week could accelerate the move
⸻
⚠️ Risk Notes:
• Watch for FOMC and GDP reports before scaling positions
• Break & close confirmed – trail stops on lower timeframe
⸻
📌 Momentum is in favor – ride the breakdown, but stay data-aware.
Share setups or feedback below 👇

USDJPY Short Setup – Bearish Breakout WatchBias: ✅ Strong Sell
Timeframe: 4H
Pair: USDJPY
Week: 26–30 May 2025
🔍 Technical Setup:
USDJPY is sitting on a critical support zone around 142.55. A decisive break and 4H close below this level would confirm a bearish continuation.
Entry: Break below 142.55
Stop Loss: Above resistance at 142.80
Take Profit: Major support around 140.05
Risk-Reward Ratio: ~4R
Structure: Lower highs, pressure on demand – momentum building
🧠 Macro Confluence:
📉 USD Weakness: Dovish Fed, worsening macro (Investogenie Score 1.8 ↓)
💴 JPY Strength: Seasonal bias, bullish COT positioning, risk-off sentiment
🧾 COT: JPY net long positions at 92% RSI
📊 Conditional Scores: JPY ↑, USD ↓
⚠️ Risk Sentiment: VIX 22.68 – risk-off favors JPY
⚠️ Risk Notes:
Wait for confirmation candle before entry
Watch FOMC + GDP (USD) for volatility spikes
Consider scaling in on retest of broken support
📌 Let the level break before jumping in. Precision matters.
Share your thoughts or charts below 👇

Fundamental Market Analysis for May 22, 2025 USDJPYEvents to pay attention to today:
15:30 EET. USD - Unemployment Claims
16:45 EET. USD - Services PMI
USDJPY:
The Japanese Yen (JPY) demonstrated resilience by rebounding from an early decline during the Asian trading session. This recovery was largely influenced by positive machinery orders data from Japan, which effectively quashed recession fears and significantly bolstered expectations of an economic recovery. This occurred in anticipation of the Bank of Japan (BoJ) potentially raising interest rates again in 2025, which would have been a positive development for the JPY. Furthermore, flight to safety is identified as a contributing factor to the strengthening of the yen.
The proposed tax bill introduced by US President Donald Trump has led to concerns regarding the financial stability of the US government. This, in addition to the resurgence of tensions between the US and China, is exerting downward pressure on global risk sentiment and prompting investors to seek refuge in traditional safe haven assets, including the yen. This, coupled with the prevailing US Dollar (USD) selling bias, has led to the USD/JPY pair reaching a two-week low, approaching the round figure of 143.00 on Thursday.
Trade recommendation: SELL 143.100, SL 143.700, TP 142.350

Gold : Sell or Wait for Pullback to buy?Price is approaching a strong Sell Zone (3320–3345), which aligns with Daily & Weekly Resistance.
🔻 Sell Idea:
Entry: 3325–3330
🟢 Buy Idea (if pullback):
Entry: 3245–3255
I will update SL and TP once trade is activated.
Watching for rejection in the Sell Zone or a retest of the Buy Zone before entering.
Share your opinion below. Trade safe! 💥

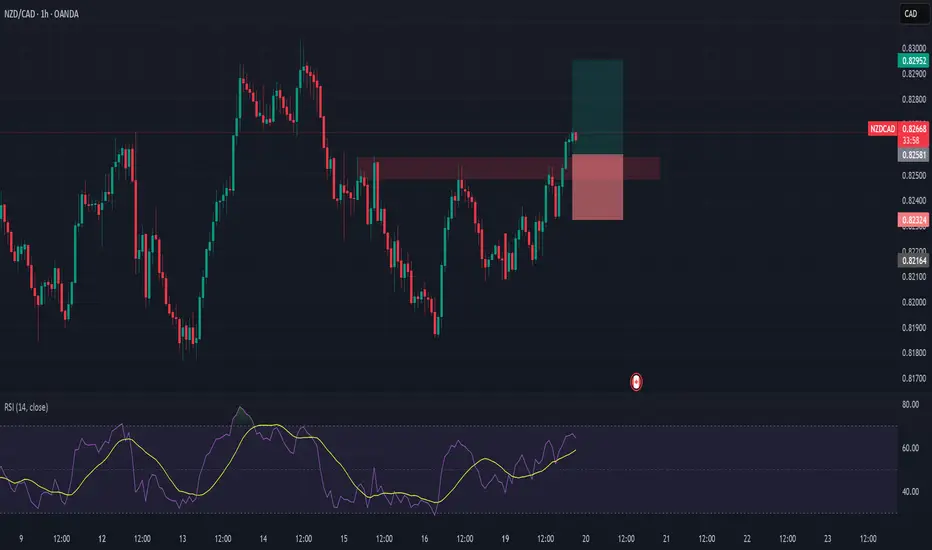
NZDCAD Long – Breakout + Retest Opportunity Backed by Macros🔹 Pair: NZD/CAD
🔹 Timeframe: 1H
🔹 Direction: Long
🔹 Status: Breakout of resistance → waiting for retest at turncoat support
🔹 Entry Zone (Planned): 0.8250–0.8260
NZD is the top gainer this week with strong conditional momentum and seasonal strength. CAD is stagnating under weak macro support. We're now watching for a pullback to the breakout zone for an ideal long entry.
Will look to enter between 0.8250–0.8260, SL under 0.8230, and aiming for 0.8295+.
📊 Macro & Fundamental Confluence
🇳🇿 NZD – Bullish
Biggest Weekly Gainer: Conditional score surged 🚀 from 8 → 13
Seasonal Bias: Strong buy signal from mid-May onward
Central Bank: RBNZ remains hawkish amid stable inflation targets
Risk-On Regime: VIX < 20 favors high-beta currencies like NZD
🇨🇦 CAD – Bearish
Policy vs Data Mismatch: BoC hawkish, but weak retail & CPI data
Global Headwinds: Commodity weakness and trade risks weigh on CAD
🧩 Confluences
✅ NZD macro & conditional strength
✅ CAD stagnation
✅ Risk-on favors NZD
✅ Technical breakout + higher high confirmed
Fundamental Market Analysis for May 19, 2025 USDJPYThe USD/JPY pair attracted new sellers on Monday and fell to a one-week low of around 144.800 during the Asian session. Furthermore, the current economic climate suggests that the path of least resistance for spot prices remains to the downside, which supports the prospects for a continuation of the recent corrective decline from the nearly six-week high reached last Monday.
It is widely anticipated that the Bank of Japan (BoJ) will raise interest rates again in 2025, a development that is expected to continue providing support to the Japanese Yen (JPY). Furthermore, the unexpected downgrade of the US government's credit rating is discouraging investors from taking risks and is instead favouring traditional safe-haven assets, including the Japanese Yen. On Friday, Moody's downgraded America's main sovereign credit rating by one notch, to 'Aa1', citing concerns over the country's rising debt.
Meanwhile, investors seem convinced that the Federal Reserve (Fed) will continue to cut rates amid signs of weakening inflation and the likelihood that the US economy will see several quarters of sluggish growth. At the start of the new week, the US Dollar remains depressed and exerts additional downward pressure on the USD/JPY pair. However, the lack of follow-through selling below the psychological 145.00 mark is forcing bears to exercise caution before positioning themselves for deeper losses.
On Monday, the US will not release any market-moving economic data, so the dollar will be influenced by speeches by influential FOMC members. Furthermore, an improvement in risk sentiment is likely to result in increased demand for the Japanese Yen, thereby providing some momentum to the USD/JPY pair. However, the diverging policy expectations of the BoJ and the FOMC confirm the negative outlook for the near term. Consequently, any recovery attempt could be perceived as a strategic opportunity for divestment, and is likely to be constrained.
Trade recommendation: SELL 144.700, SL 145.500, TP 143.800

Gold Eases as Risk Sentiment Improves, but Long-Term Demand IntaMacro theme:
- Gold prices retreated from recent highs as improved risk sentiment following the US-China trade deal and a stronger US dollar weighed on safe-haven demand.
- Gold ETFs recorded modest outflows in Apr, but the withdrawal slowdown suggests easing profit-taking pressure.
- In the near term, trade optimism may keep gold under pressure, though central bank demand and portfolio diversification continue to support the long-term outlook.
Technical theme:
- XAUUSD pulled back from the swing high near 3430, forming a lower high and moving into a sideways structure between EMAs.
- A close below 3230 could trigger further downside toward 3135,
- On the contrary, holding above 3230 may prompt a retest of the 3430 level.
Analysis by: Dat Tong, Senior Financial Markets Strategist at Exness

DXY Rebounds on Fed Pause and Trade Deal Hopes.Macro approach:
- DXY edged higher, recovering earlier losses as the Fed held rates and Powell was cautious.
- Jun cut hopes faded, though markets expect three cuts this year, potentially lifting DXY short-term.
- A potential US-UK trade deal also helps ease bearish sentiment on the dollar.
Technical approach:
- DXY is hovering around the key resistance at around 100.200, confluence with EMA21, indicating a potential short-term correction.
- If DXY closes above the resistance at 100.200, the price may continue to claim to retest the following resistance at 101.800.
- Conversely, closing below the current trendline may lead DXY to retest the swing low at around 98.000.
Analysis by: Dat Tong, Senior Financial Markets Strategist at Exness

Fundamental Market Analysis for May 8, 2025 GBPUSDEvents to pay attention today:
15:30 EET. USD - Number of Initial Jobless Claims
14:00 EET. USD - Bank of England Key Interest Rate Decision
GBPUSD:
GBP/USD was down six-tenths of a per cent on Wednesday as markets continued to hold on to the safe-haven US dollar. The Federal Reserve (Fed) left rates unchanged as markets had expected, but Fed policymakers, still adopting a wait-and-see stance, curbed risk appetite during the midweek market session. The Bank of England (BoE) will hold its own rate meeting on Thursday and is expected to cut rates by another quarter point.
Forex Today: All eyes on the Bank of England
Market sentiment declined after Fed Chairman Jerome Powell's press conference. He said that US trade tariffs could hamper the Fed's inflation and employment targets this year. Powell warned that continued policy instability could force the Fed to take a ‘wait-and-see’ approach to interest rates. While the Trump administration's tariffs have weighed heavily on consumer and business sentiment, the lack of significant negative economic data makes it difficult for the Fed to justify an immediate change in interest rates.
Powell: The right thing to do is to wait for further clarity
The Bank of England is expected to cut the rate by a further quarter point at its upcoming meeting on Thursday, marking the fourth rate cut since it peaked in 2023. The Bank of England's Monetary Policy Committee (MPC) is expected to vote nine to one in favour of another rate cut in an attempt to support the faltering UK economy.
Trading recommendation: SELL 1.3330, SL 1.3350, TP 1.3230

Fundamental Market Analysis for May 7, 2025 EURUSDEURUSD:
EUR/USD failed to hold on Tuesday, marking a new short-term consolidation range near the key 1.1300 mark as traders wait for a reason to move. The key event this week is the Federal Reserve (Fed) rate announcement in the middle of the week, which has pinned investor sentiment to the pole for now.
The Fed's upcoming rate decision on Wednesday remains the focus of markets this week. While many expect the Fed to maintain current rates, investors will be closely monitoring comments from policymakers, especially Fed Chairman Jerome Powell, for any signs that the shift to a rate-cutting cycle may occur sooner than expected.
Recently, the Fed has been facing increasing pressure to lower interest rates. Market participants have consistently sought lower funding costs, and the Trump administration has been particularly vocal in insisting that the Fed must cut rates to ease the cost of servicing US debt. However, this stance runs counter to the Fed's dual mandate of promoting full employment and controlling price stability, which President Donald Trump does not appear to be taking into account.
Trading recommendation: BUY 1.1350, SL 1.1330, TP 1.1440

Fundamental Market Analysis for May 6, 2025 USDJPYUSDJPY:
The Japanese Yen (JPY) declined against its US counterpart during Tuesday's Asian session, albeit without any follow-through selling. Despite the Bank of Japan's (BoJ) ‘restrained’ guidance last Thursday, Japan's rising inflation and prospects for continued wage increases leave the door open for further policy tightening by the central bank. In addition, uncertainty over US President Donald Trump's trade policy and rising geopolitical tensions continue to act as tailwinds for the safe-haven yen.
Meanwhile, the prospect of more aggressive rate cuts by the Federal Reserve (Fed) is not helping the US Dollar (USD) attract meaningful buyers and is helping to limit the upside for the USD/JPY pair. Traders also seem unwilling to wait for more signals on the Fed's policy outlook before positioning for the next leg of directional movement. Thus, the main focus will be on the outcome of the two-day FOMC meeting, which starts this Tuesday and which will give the dollar a fresh impetus.
Trading recommendation: BUY 143.90, SL 143.60, TP144.80

EGX30 Trend AnalysisEGX30 stock started to fall, reaching the 32,383.579 support line, the 32,343.473 support line, and the 32,283.315 support line, showing the sellers' dominance over the buyers. This is because investors are cautious about the U.S. meeting with many countries, including China, on trade deals, aiming to secure a fair trade deal. In addition, it was expected that the EGX30 would not breach the resistance line 32,463.789, as there is no historical upward trend in this zone.

Fundamental Market Analysis for May 6, 2025 GBPUSDGBPUSD:
The GBP/USD pair started the new week on a subdued note and is fluctuating in a narrow trading range around 1.3260-1.3265, near the one-week low reached during the Asian session.
The US Dollar (USD) remains on the defensive below multi-week highs amid heightened economic uncertainty amid US President Donald Trump's tariff plans and is a key supportive factor for the GBP/USD pair. Furthermore, the prospect of more aggressive policy easing by the Federal Reserve (Fed) is further undermining the US Dollar.
Despite a better than expected US non-farm payrolls report on Friday, investors seem convinced that the US central bank will resume its rate-cutting cycle in June and reduce borrowing costs by 100 basis points by the end of this year. This, along with optimism about a potential de-escalation of the trade war between the US and China, is reducing demand for the safe-haven dollar.
However, traders seem reluctant to make new bullish bets on GBP/USD and prefer to wait for this week's key event - the Bank of England's (BoE) monetary policy meeting on Thursday. The UK central bank is expected to cut interest rates by 25bps and take a somewhat soft stance amid downside risks to growth from the trade war.
In addition, this week traders will face the publication of the FOMC meeting minutes, which will affect the USD price dynamics and give a meaningful impetus to the GBP/USD pair.
Trading recomendation: SELL 1.3280, SL 1.3290, TP 1.3180

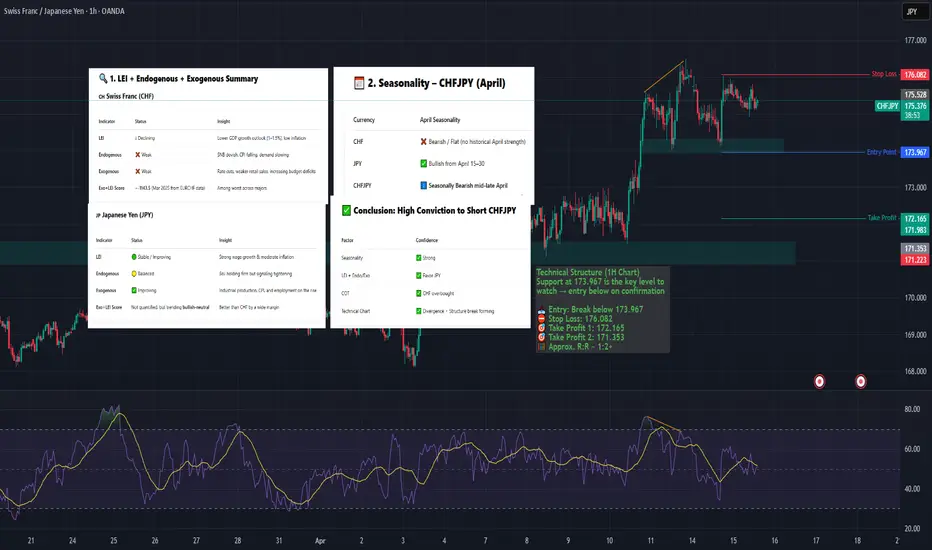
CHFJPY – Bearish Reversal Setup (Mid-April)Summary
CHFJPY short is supported by weak macro + divergence + seasonal timing.
CHF is fundamentally the weakest major, while JPY is seasonally strong and technically aligned.
🧠 Fundamental & Seasonal Overview
CHFJPY presents a high-probability short opportunity for the second half of April:
CHF Fundamentals = Weakest among majors
↳ SNB recently cut rates to 0.25%, CPI down to 0.3%, GDP slowing
↳ Exo+LEI Score ≈ -1143 — highly bearish
JPY Fundamentals Improving
↳ BoJ cautiously hawkish (wage growth + inflation rising)
↳ Seasonality favors JPY mid-late April
COT: CHF near top → risk of unwind; JPY also elevated, but justified by fundamentals
📉 Seasonality
CHFJPY is historically bearish from April 15–30
CHF flat to weak, while JPY typically strengthens in risk-off flows and Q2
Fundamental Market Analysis for March 01, 2025 USDJPYThe USD/JPY pair is trading with small losses, hovering around the mid-143.00s after disappointing US economic growth data and weak Japanese economic reports caused a divergence in sentiment between the two currencies. The US economy contracted 0.3 per cent in the first quarter of 2025, the first contraction since 2022, missing growth expectations and highlighting the impact of rising imports and government spending cuts. At the same time, Japan released weaker-than-expected industrial production and retail sales data, limiting the yen's gains even as global risk appetite declined.
On the macroeconomic front, the US Bureau of Economic Analysis reported that real GDP contracted 0.3% in Q1, missing the market forecast for a 0.4% increase and slowing sharply from the 2.4% growth in Q4 2024. The contraction was primarily driven by a 41 per cent rise in imports and lower government spending. Meanwhile, core PCE inflation, the Fed's preferred measure of inflation, fell to 2.3 per cent year-on-year, in line with expectations and below February's 2.5 per cent. Other data showed a slowdown in job creation, with the ADP report showing just 62,000 new jobs in April against expectations of 108,000.
Despite the softer data, personal spending remained flat in March, rising 0.7%, while incomes rose 0.5%. However, market sentiment turned cautious, with the Dow Jones Industrial Average falling more than 200 points to stagnate around 40,300.
In Japan, the yen weakened 0.5% against the dollar as industrial production and retail sales data disappointed, highlighting the fragility of the domestic economy.
Trade recommendation: BUY 144.20, SL 144.00, TP 145.00

Fundamental Market Analysis for April 30, 2025 GBPUSDThe GBP/USD pair continues to fall for the second consecutive session, hovering near 1.3390 during Asian trading on Wednesday. The pair has been under pressure as the US dollar has strengthened amid renewed optimism over trade developments between the US and China. Traders are now turning their attention to the upcoming release of the March Personal Consumption Expenditure (PCE) price index, which is a key inflation gauge for the Federal Reserve.
The U.S. Dollar Index (DXY), which measures the dollar's exchange rate against six major currencies, remains above 99.00, suggesting U.S. Treasury yields are rising. The 2-year and 10-year US bond yields broke a four-day losing streak and were trading around 3.66 per cent and 4.17 per cent respectively at the time of writing.
On the data front, the JOLTS US job openings report released on Tuesday showed a decline in the number of open positions to 7.19 million in March - the lowest level since September 2024 - indicating a cooling in labour demand. The figure fell short of expectations and emphasised growing economic uncertainty.
Adding to GBP/USD's decline are rising expectations that the Bank of England (BoE) will cut rates at its May meeting. Lower inflation expectations in the United Kingdom (UK) and increasing global economic factors favour a rate hike.
Bank of England Governor Megan Green recently stated that tariffs proposed by US President Donald Trump could lead to lower inflation in the UK, although significant uncertainties remain over the broader economic impact and recent tax hikes for employers.
Trading recommendation: SELL 1.3390, SL 1.3420, TP 1.3300

XAUUSD is UncertainA few of high impact news tomorrow and it will determine if XAUUSD will continue its trend or break further correct itself tomorrow. If it breaks 3300, the probability it will drop further for correction is highly probable. If not then it will continue its trend to the upside.

Fundamental Market Analysis for April 29, 2025 EURUSDEUR/USD is down to 1.14150 in the early Asian session on Tuesday. The euro (EUR) is weakening against the US dollar (USD) amid rising bets for further rate cuts by the European Central Bank (ECB) in June. Investors expect further US trade policy developments ahead of the release of the much-anticipated US Non-Farm Payrolls (NFP) data on Friday.
US President Donald Trump said progress is being made and he has spoken to Chinese President Xi Jinping, although Beijing denies that trade talks are underway. U.S. Treasury Secretary Scott Bessent said he spoke with Chinese authorities last week but did not mention tariffs.
On Monday, Bessent said the U.S. government is in contact with China, but it is up to Beijing to take the first step to de-escalate the tariff fight with the U.S. over the trade imbalance between the two countries. Investors will be keeping a close eye on the US-China relationship. Trump's chaotic trade policies have undermined faith in US assets and the common currency has become an alternative destination for investors' cash. Any signs of an escalating trade war between the US and China could have a negative impact on the US dollar and serve as a tailwind for EUR/USD.
On Saturday, Reuters reported that ECB policymakers are increasingly confident of cutting interest rates in June as inflation continues to fall. On Monday, ECB chief Olli Rehn said the central bank may cut interest rates below the neutral level that keeps the economy in balance.
Trading recommendation: SELL 1.13800, SL 1.14000 , TP 1.13000

Fundamental Market Analysis for April 28, 2025 USDJPYUSDJPY:
The Japanese yen (JPY) fluctuated in a narrow range in Monday's Asian session and paused its recent pullback from a multi-month high reached last week against its U.S. counterpart. U.S. Treasury Secretary Scott Bessent did not support President Donald Trump's statement that tariff talks with China are underway. That tempered optimism about a quick resolution to trade tensions between the world's two largest economies and provided some support for the safe-haven yen.
Meanwhile, traders pushed back expectations of an immediate interest rate hike by the Bank of Japan (BoJ) due to rising economic risks from US tariffs. However, signs of rising inflation in Japan leave the door open for further BoJ rate hikes this year, which is a big divergence from bets on more aggressive Federal Reserve (Fed) policy easing. This keeps USD bulls on the defensive and also serves as a tailwind for the low-yielding Yen.
Trading recommendation: SELL 143.20, SL 143.60, TP 142.50
