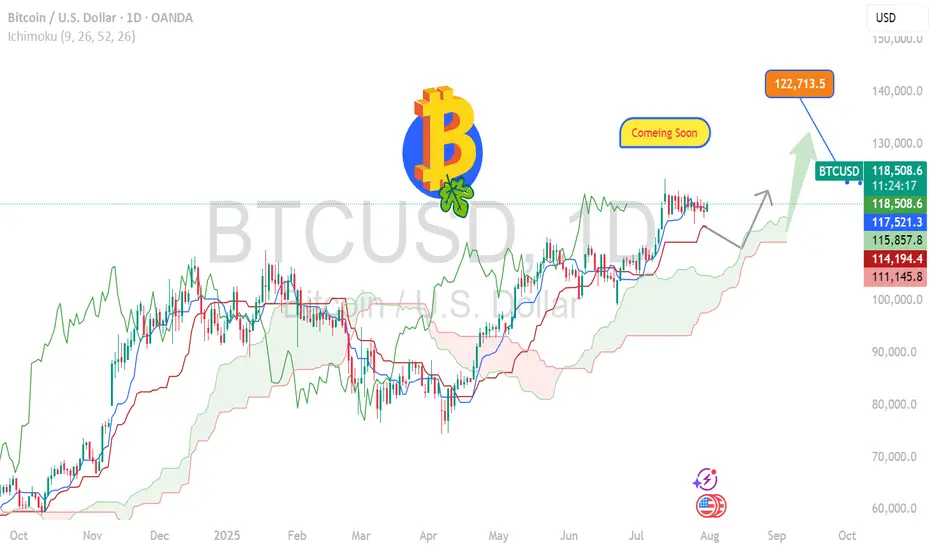
BITCOIN- Charging Towards 122k Momentum Building BTC/USD Long Setup – Targeting 122K 🔥
Bitcoin is holding strong above 118500, signaling bullish momentum.
✅ Price broke key resistance & forming higher lows.
🟢 Current structure favors buy-side continuation with next major target at 122000.
Support Zones:
🔹 117800 – intraday bullish retest
🔹 116500 – strong demand zone
Resistance Ahead:
🔸 120200 – short-term reaction
🔸 122000 – major target
🚀 Expecting bullish wave continuation.
If momentum sustains above 118K, 122K breakout highly probable!
#BTC #Bitcoin #CryptoSetup #BTCUSD #CryptoTrading #BTC122K #ChartAnalysis #BullishBreakout
Fundamentalstrategy
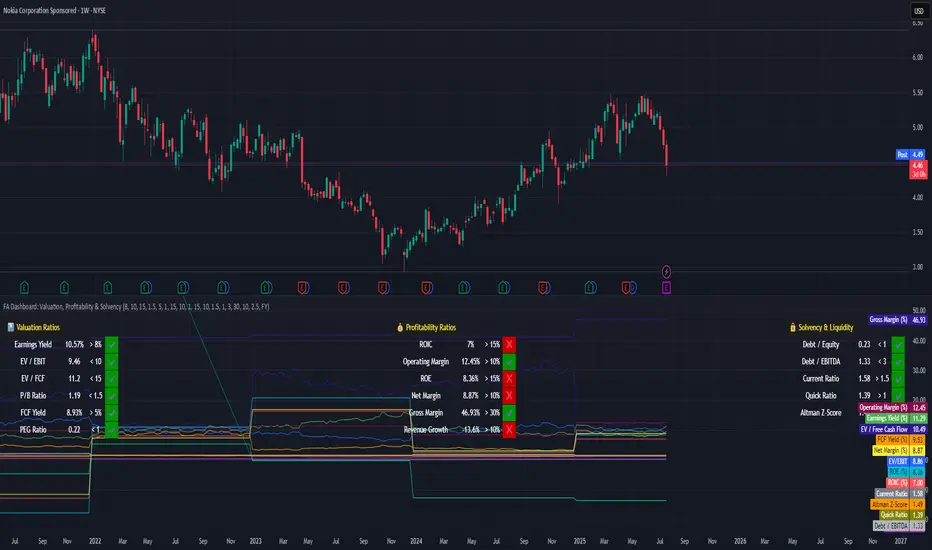
How to Evaluate Companies with a Fundamental Dashboard**Tutorial: How to Evaluate Companies with a Fundamental Dashboard (Example: Nokia)**
This tutorial explains how to use a custom-built dashboard in TradingView to evaluate companies based on key financial dimensions: **Valuation**, **Profitability**, and **Solvency & Liquidity**.
---
🛠 **How to Use This Tool**
This dashboard is meant to be an educational visual filter for fundamental analysis. Here’s how you can use it:
1. Add the script to any stock chart in TradingView.
2. Choose your preferred data period: annual (FY) or quarterly (FQ).
3. Adjust the thresholds in the script settings to reflect your investment approach.
4. The dashboard displays 17 key financial ratios grouped into three categories.
5. Each metric is evaluated visually with ✔️ (meets threshold) or ❌ (falls short).
6. Use this dashboard to identify companies worth deeper analysis — not to make automatic decisions.
---
📊 **Understanding the Dashboard Sections**
### 🔹 Valuation Metrics
Used to assess whether a stock appears undervalued based on price-to-value fundamentals:
- Earnings Yield
- EV/EBIT, EV/FCF
- P/B Ratio
- Free Cash Flow Yield
- PEG Ratio
### 💰 Profitability Metrics
Evaluate how efficiently the company turns revenue into profit:
- ROIC, ROE
- Operating, Net, and Gross Margins
- Revenue Growth
### 🔒 Solvency & Liquidity
Assess financial strength and balance sheet resilience:
- Debt/Equity, Debt/EBITDA
- Current Ratio, Quick Ratio
- Altman Z-Score
---
📍 **Case Study: Nokia (Ticker: NOK)**
This tutorial applies the dashboard to Nokia to demonstrate how to interpret results:
- ✅ **Valuation is strong**: Most metrics meet or exceed typical value thresholds.
- ⚠️ **Profitability shows weaknesses**: ROIC and revenue growth fall below expectations.
- 💪 **Solvency is healthy**: Debt is under control, though Altman Z-Score signals some risk.
This example helps show how the tool highlights strengths and red flags at a glance.
---
🎯 **Key Takeaway**
This dashboard is not a signal generator — it’s a thinking aid.
Its purpose is to help investors explore company fundamentals visually and consistently. The thresholds are customizable, and the tool encourages deeper due diligence.
---
⚠️ **Educational Disclaimer**
This tutorial is for educational purposes only. It does **not** provide investment advice or recommendations.
It is intended to demonstrate how to use a script to organize and interpret fundamental financial data.
Always do your own research and exercise independent judgment before making any financial decisions.
Strong Stock!FFL
Closed at 15.22 (27-06-2025)
Sustaining 13.81 on Monthly basis
would be a healthy sign.
Also Monthly Closing above 16.12
would be a very positive sign.
On the flip side, 12 - 14 may act
as a Good Support zone.
Upside targets can be 19 - 20
& then 22 - 23 initially.

XAUUSD GOLD buy holdXAUUSD GOLD BUY NOW – LONG TRADE SETUP ACTIVE 🟡📈
Gold has pulled back to a key support area and is now showing signs of strength at the current price of $3301.
This zone is acting as a strong base for buyers, signaling a potential bullish continuation in the coming sessions.
We are entering a LONG position with a favorable risk-to-reward ratio, supported by market structure and technical confirmation.
🔹 Current Price: $3301
🎯 Target Levels: First target at $3350, extended target at $3400+
🛑 Stop Loss: Recommended below $3275 to protect capital
As long as price holds above the support zone, bulls remain in control.
Patience, discipline, and proper risk management are key — let the trend do the work.
Gold is poised for upside — time to ride the wave!

EUROUSD updates chartEUR/USD Sell Setup Active 🔻
Pair rejected key resistance zone near 1.0740 – entering sell position now.
📉 Short-term momentum favoring bears.
🎯 Target: 1.0650 → 1.0600
🛑 Stop Loss: Above 1.0755
🕰️ H1/H4 confluence confirms downside pressure.
Trendline + RSI divergence = high-probability short!
📌 Plan the trade. Trade the plan.

XAUU-USD chart it will go back upwardXAUUSD Buy Setup Active 🟢💰
Gold is holding strong above key support – currently trading at 3355. We’ve entered a Buy position expecting continued bullish momentum in the market.
📍 Entry: 3355
🎯 Targets: 3420 – 3450 – Final Target 3400
🛑 Stop Loss: 3325 (below recent structure low)
With global uncertainty and technical strength aligning, this move could push gold higher in the coming sessions.
Stay alert, manage risk, and follow the trend until reversal confirmation. 🧭📈
#XAUUSD #GoldTrade #ForexTrading #BuySetup #TradingViewAnalysis #MarketUpdate

USDCHF 15M ANALYSISThe analysis of my next trade works like this
Our entry is: BULLISH
(1) The 4H trendline broke
(2) We retested the 4H support
(3) We wait for a break and retest of our most recent 15 minute support
(4) We comfirm the bullish direction with our volume indicator (we want to see big volume that surprasses the 20 ema that is included in the volume indicator) and a bullish candlestick close.
IF YOU LIKED THE ANALYSIS PLEASE DROP A FOLLOW

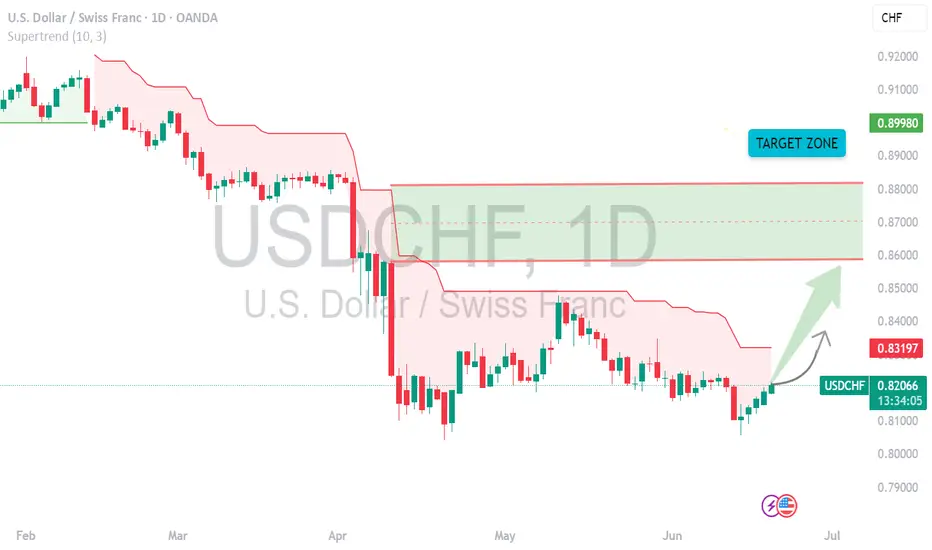
USDCHF daily Cls model 1 Target sl setUSDCHF Trade Setup Alert 🚨
Entry Confirmed ✅ | Target Locked In 🎯 | SL in Place for Risk Control 🛡️
We’ve set our eyes on the next move for USDCHF – trade smart, not emotional.
🔹 Target: [86034
🔹 Stop Loss: 80030
Watch the price action closely — let the strategy play out! 📊📈
#USDCHF #ForexSignals #TradingSetup #RiskManagement #TradingView
EUR/GBP 4H Bullish Breakout Trade Setup – Demand Zone to 0.85250📉 Trendline Break
🔵 A key trendline was broken 🔽 (bearish ➡️ bullish shift).
✂️ This break signals potential upside movement as sellers lose control.
🟦 Demand Zone (BUY Area)
📍 Zone: 0.83967 – 0.84249
🛒 Buyers expected here!
🟢 Price may pull back here before heading up.
🟡 This is marked as the ENTRY POINT zone.
🔴 Stop Loss Zone
📍 Level: 0.83977
❌ Place stop loss just below the demand zone.
🛡️ Protects against downside breakout risk.
🟧 Resistance Zone
📍 Around: 0.84500 – 0.84600
⚠️ Price may face resistance temporarily before continuing the upward move.
📏 Testing this area confirms strength.
🟩 Target Zone
🎯 Target Point: 0.85250
💸 If the trade plays out, this is where profit is expected.
🚀 Bullish target above the resistance zone.
✅ Trade Setup Summary
🧩 Details
🟦 Entry 0.84240 (inside demand zone)
🔴 Stop Loss 0.83977 (below demand zone)
🟩 Target 0.85250 (above resistance)
📈 R/R Ratio ~1:4 (great risk/reward!)
🔍 Final Outlook:
🟠 Watch for: Pullback to entry zone
🟢 Then look for: Bullish candlestick confirmation
🚀 Goal: Ride it up to 0.85250 with strong momentum

GOLD (XAU/USD) 4H CHART – BULLISH BREAKOUT TRADE SETUP🔵 Trendline Breakout 📈
📏 Price broke above a descending trendline, signaling a potential bullish reversal.
🔼 This breakout is often seen as a buy signal by traders.
🧱 Resistance Area 🛑
🔹 Price has entered and broken through a horizontal resistance zone.
🔄 This zone may now flip into support, adding confidence to the long setup.
🟧 Demand Zone 📦
📍 Marked between 3,267 – 3,298.
🛡️ Strong buying interest historically observed in this area.
📉 EMA (70) at 3,298.065 acts as dynamic support.
🟦 Entry Point 🚪
🎯 Entry Level: 3,322.930
🔄 Enter after retest confirmation or bullish candle above resistance.
🔴 Stop Loss ⛔
⚠️ SL Level: 3,267.993
💣 Below the demand zone and EMA — protecting against false breakouts.
🟩 Target Point 🎯
🚀 TP Level: 3,490.000
📌 Prior high zone — strong historical resistance expected here.
💰 Trade Setup Summary
✅ Buy Above: 3,322.930
❌ Stop Loss: 3,267.993
🎯 Target: 3,490.000
📊 Risk/Reward Ratio: Favorable (approx. 1:3)
🔎 Technical Confidence Levels
🔵 EMA Support ✅
🔵 Trendline Breakout ✅
🔵 Resistance Flip ✅
🔴 False Breakout Risk

U.S. Dollar Index (DXY) Bearish Setup – Supply Zone Rejection & 🔹 Trend Overview
📊 Overall Trend: Bearish (Downtrend)
📉 Price is forming lower highs and lower lows within a descending channel.
🔻 Recently bounced off a support zone, now heading toward a potential pullback.
🔵 Supply Zone (Resistance Area)
📍 Zone Range: 100.049 – 100.601
🧱 Acts as a resistance block where sellers might step in.
📏 Confluent with EMA 70 at 100.178, strengthening its validity.
🔸 Trade Setup – Short Position
🟠 ENTRY POINT: 100.088
❌ STOP LOSS: 100.587 – 100.595 (Just above supply zone)
🎯 TARGET: 98.000 (With intermediate support levels)
📌 Support Levels
🔹 98.112 – First minor support
🔹 98.106 – Close-range confirmation
🔹 97.885 – Additional support zone
🟦 Main Target: 98.000
⚖️ Risk/Reward Ratio
🟧 Small risk above supply zone
🟩 Large reward to downside = Favorable R:R
📌 Summary
📈 Expecting a pullback into supply zone.
🧨 Look for bearish confirmation around 100.088.
🎯 Target the downside at 98.000 for profit.

USD/CHF 4H Bearish Setup: FVG Rejection & EMA Resistance Strateg🔵 Chart Structure
🔻 Downtrend Identified
* Lower highs & lower lows forming.
* Resistance line sloping down 📉.
🧲 EMA 70 (0.82387)
* Acting as dynamic resistance 🔴.
* Price currently sitting just below it ⬇️.
💠 FVG (Fair Value Gap) — 0.82441 to 0.83097
* Price expected to fill the imbalance here.
* Confluence with resistance = 🔥 ideal sell zone.
🎯 Trade Plan (Short Setup)
🟦 Entry Point:
* 💥 0.82415
* Just under EMA + inside FVG zone.
🛑 Stop Loss:
* ❌ 0.83110
* Above FVG + above previous high = protected stop.
🎯 Take Profit:
* ✅ 0.80150
* Near prior demand zone + horizontal support.
* Target zone clearly marked in light blue 🧊.
⚖️ Risk-Reward Ratio
🎲 Estimated around 2.5:1 or better.
✅ High reward potential if resistance holds.
⚠️ Caution / Notes
🔎 Watch for bearish confirmation candles 🕯️ at entry zone.
📆 Be aware of economic news that could impact USD or CHF.
🧪 If price closes above 0.83110, setup becomes invalid ❌.
📌 Summary
Element Level Emoji
🔵 Entry 0.82415 💥
🛑 Stop Loss 0.83110 ❌
✅ Take Profit 0.80150 🎯
🔻 Trend Bias Bearish 📉
📐 Tools Used EMA, FVG, Resistance 📊

BTC/USD 4H Trade Setup – Demand Zone Reversal Play🔵 1. Demand Zone 🧲💎
📍 Range: 100,418.83 – 102,253.51
🟦 Strong support zone
💡 This is where buyers are expected to step in
📉 Price is currently testing this zone — potential reversal area
🚀 2. Entry Point 🎯
📍 Zone: 102,232.52 – 102,264.33
✅ Just above demand zone for safe entry
🧘♂️ Wait for bullish confirmation (wick rejections, engulfing candles)
🛑 3. Stop Loss 🔻
📍 Zone: 100,498.77 – 100,538.74
🔒 Below demand zone — protects you from false breakouts
⛔ Invalidates setup if price breaks below this level
🎯 4. Target Point 💰
📍 Target: 108,800.00
🧱 Major resistance zone
📈 Offers a solid Risk/Reward setup (approx. 1:4)
🪜 Possible take-profit scaling around 108,656.78 – 109,256.50
🔁 5. CHoCH – Change of Character 🔄
📍 Confirmed structural break above a lower high
🕵️♂️ Indicates shift from bearish to bullish
🔁 Needs confirmation with higher low near demand zone
📏 6. EMA 70 (Exponential Moving Average) 📉
📍 Level: 106,849.30
🔴 Price is currently below EMA = short-term bearish
🧗♂️ Reclaiming the EMA will strengthen the bullish bias
✅ Quick Summary with Emojis
📌 Plan:
🔵 Buy near: 102,250
🛑 Stop Loss: 100,500
🎯 Take Profit: 108,800
📊 Trend:
🔻 Bearish short-term (below EMA)
🔁 Potential reversal from demand zone
⚠️ Watch For:
🔍 Bullish confirmation at demand zone
🔄 Reclaim of EMA (106.8k)
🧱 Resistance near 108.8k

WTI Crude Oil 4H Chart – Bullish Setup from Demand Zone📈 Current Price: $61.74
🔵 Key Zones & Levels
🔹 Demand Zone (Buy Area):
🟦 $59.48 – $61.39
→ Price expected to bounce here
→ 🔄 Potential reversal zone
🔹 Entry Point:
🎯 $61.39
→ Ideal level to enter LONG
→ Just above demand zone
🔹 Stop Loss:
🛑 Below $59.48
→ Exit if price drops here
→ Protects capital
🔹 Target Point:
🚀 $67.00
→ Profit-taking zone
→ Strong resistance zone nearby:
* 66.63
* 66.75
* 67.60
📊 Indicators
📍 EMA (70): 🔴 61.40
→ Price trading above = bullish signal
→ EMA acting as support
📏 Trendline Channel:
🔼 Higher highs & higher lows
→ Supports uptrend continuation
📌 Trade Plan Summary
* Bias: 📈 Bullish
* Buy: At 61.39
* Stop: Below 59.48 🛑
* Target: 67.00 🎯
* Risk-Reward: ✔️ Favorable (~1:3)
🔍 What to Watch
* ✅ Bullish candles in demand zone
* 🔁 Retest of EMA or lower channel
* ❌ Avoid if it breaks below $59.48

THE USD CAD PAIR USD/CAD 1H Chart – Busy with Levels but the Bias is Clear 📊✨
Multiple confluences pointing to bullish intent: trendline support, key demand zones, and clean higher lows. Despite the clutter, price is respecting structure. Watching for a clean break above recent highs to ride the buy-side liquidity sweep. Eyes on 1.38+ 📈
#ForexTrading #USDCAD #SmartMoney #TechnicalAnalysis"

BITCOIN chart updated Bitcoin Buy Signal Triggered ₿🚀
BTC showing strong bullish momentum after holding key support.
Entered long position on breakout above short-term resistance with volume confirmation.
Higher lows forming a solid base — structure favors continued upside.
Targeting the next resistance zone around , with stop loss below recent swing low.
Watching closely for follow-through and potential scaling opportunities.
Market sentiment improving — let's see if the bulls can take control.
#Bitcoin #BTCUSD #CryptoTrading #BuyTheDip #BreakoutTrade #CryptoSetup #BullishBias #PriceAction #TechnicalAnalysis"**

Biggest gainer of Fresh Cash Friday $KNWTOTAL gain of the week: +78.8% realized 💪
Monday: +31.7% ✅
Tuesday: +12.5% ✅
Wednesday: +5.3% ✅
Thursday: +9.4% ✅
Friday: +19.9% ✅
All trades posted were posted in real-time.
Not letting emotions take over, keep following the strategy, trading like a robot and letting the stats work in your advantage!
Let’s do it again this week!

Bitcoin (BTC/USD) 1H Chart Analysis – Double Top Signals BearishPattern Formed: DOUBLE TOP
⚠️ Bearish Reversal Pattern Spotted!
📍 Formed near 111,794.8
⬆️ Price tested the top twice and failed – strong resistance confirmed!
Key Zones:
🔶 SUPPLY ZONE (Resistance):
🟧 111,794.8 - 111,829.8
🔼 Expect selling pressure here!
🔷 SUPPORT Zone (Broken!):
🔻 Price fell below this level, confirming a bearish breakout
🟩 TARGET ZONE:
🎯 102,500.0
✅ This is the likely drop target based on the pattern
🧊 Other minor supports:
* 102,820.6
* 102,750.8
* 102,227.0.
Indicators:
📈 Trend Line
* Supported the price during the uptrend
* ❌ Now broken — indicates momentum shift
📉 EMA 70 (Red Line)
* Current Price (108,238.6) is below EMA 70 = 109,245.0
* Indicates bearish pressure.
Trade Setup:
🔽 Short Entry Idea: After support break
🛑 Stop Loss: 111,829.8
🎯 Take Profit: 102,500.0
⚖️ Risk-Reward looks attractive!
Summary:
📉 Bearish bias confirmed by:
* Double Top pattern
* Supply zone rejection
* Support break
* EMA crossover
🚨 Traders Watch Out: Bears are in control — next major stop likely at 102,500.0!

EUR/AUD Bullish Channel Trade Setup –Demand Zone Bounce Strategy📉 1. Downtrend Ends
🔽 Price was falling earlier (left side of chart)
🔄 Then it reversed at the bottom of the channel (yellow dot)
➡️ Trend Change Begins
📈 2. Uptrend Channel Forms
📊 Channel consists of:
🔵 Resistance Line (upper blue)
🟢 Support Line (lower blue)
🔁 Price is bouncing between these two lines like a pinball:
🔵 Resistance Line
| 🔼
🟢 Support Line
💠 3. Key Trading Zone
🔷 DEMAND ZONE: (Bright blue box)
🟦 Between 1.74697 and 1.75349
👉 Buyer interest expected here
🎯 4. Trade Setup (Bullish Idea)
🟢 Entry Point:
📍 1.75349
✨ Near support zone and channel bottom
🔻 Stop Loss:
🚫 1.74710
📉 Below the demand zone, protects from downside
🎯 Target Point:
🎯 1.77800
📈 Near the resistance line at the top of the channel
📊 Strategy Flow (Emoji Dots Path)
📉 🔽 🔽 🔽
🟡 Bottom found
⬆️ 🔼 🔼 🔼
📈 Enters channel
🟦 Price enters DEMAND ZONE
🔽
🔵 Entry: 1.75349
🔼
🎯 Target: 1.77800
✅ Final Thoughts
This is a clean bullish setup within a rising channel
✅ Wait for price action confirmation (like a bullish candle 🕯️) in the demand zone
🔒 Protect with your stop loss
🚀 Potential reward is strong if it bounces up

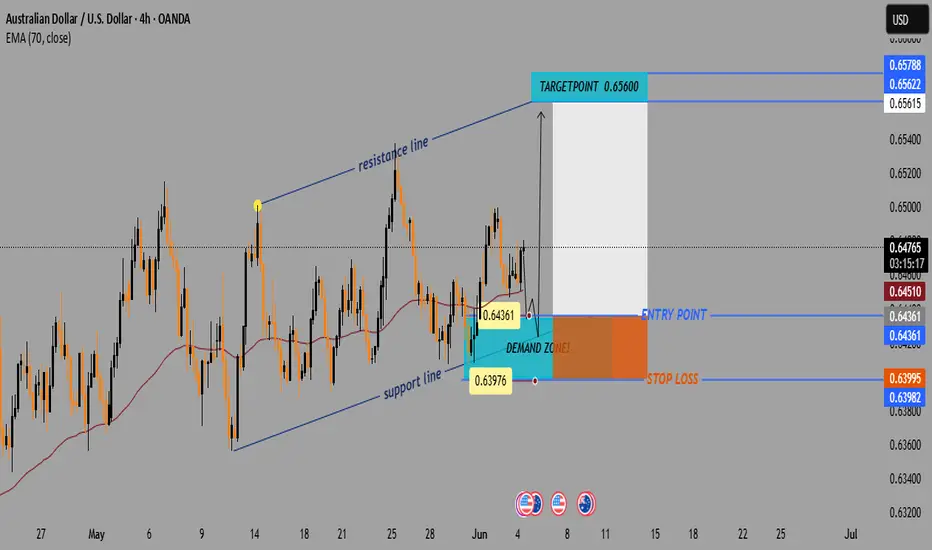
AUD/USD Bullish Setup: Demand Zone Bounce Toward 0.65600📈 Price Channel Analysis
🔼 The pair is moving within an ascending channel: • Support Line 🟦 – lower trendline showing bullish structure
* Resistance Line 🟥 – upper boundary acting as potential target
💡 This suggests bullish momentum is intact unless the price breaks below support.
📌 Key Trade Levels
🔵 Entry Point: 0.64361
* 👇 Positioned just above the DEMAND ZONE
* 📍Near the 70 EMA — a key dynamic support
🟨 Demand Zone: Area between 0.6400 – 0.6436
* 🧲 Buyers are expected here
* Good spot for a bullish entry
🔴 Stop Loss: 0.63995
* 🚨 Below the demand zone = limited risk
🟢 Target Point: 0.65600
* 🎯 Aligned with the upper resistance line
* Nice upside potential
⚙️ Technical Indicator
📉 EMA 70 (red line) = 0.64510
* Price is bouncing near it
* 📊 Acts as trend support — confirming buy idea
📊 Risk-to-Reward Ratio
🔻 Risk: ~36 pips (Entry → Stop Loss)
🔺 Reward: ~124 pips (Entry → Target)
✅ R:R Ratio ≈ 3.4:1 👍
🧠 Trade Idea Summary
📘 Trade Type 🔼 Buy (Long)
💰 Entry 0.64361
🛑 Stop Loss 0.63995
🎯 Target 0.65600
🌟 Bias Bullish
🔍 Final Thoughts
✅ Strong setup within a bullish channel
📉 EMA support + 🟦 Demand zone = Good confluence
📅 Watch out for USD news (see icons below chart)
EUR/USD4H Bearish Trade Setup Supply Zone Rejection with 3:1 RRR🔷 Trend Overview
📈 Price was in a rising channel (trend line + support line).
❌ Channel broken on downside → potential trend reversal.
🟧 🔼 Supply Zone (Sell Area)
📍 Zone: 1.13707 – 1.14432
🟠 Price faced rejection here.
💡 Institutional selling likely in this zone.
🔥 This is the ideal short-entry area.
🟦 🔽 Entry Point
🎯 Entry: Around 1.13694
🧩 Sits just below supply zone = safer trigger.
✅ Wait for a bearish confirmation candle before entering.
🟨 Support Level
📉 Support Zone: ~1.13100 – 1.13400
📊 Recently broken with a strong bearish candle.
🧱 Used to act as a floor, now may act as resistance.
🟩 🎯 Target Point
✅ Take Profit: 1.10970
📎 Matches previous structure support.
💰 Lock in profits before the psychological level at 1.1100.
🟥 ⛔ Stop Loss
❌ Stop: 1.14419
📏 Placed above the supply zone for protection.
🛡️ Shields from false breakouts or spikes.
⚖️ Risk-to-Reward Ratio (RRR)
💡 Approx. 3:1 ✅
📉 Risk: ~70 pips
📈 Reward: ~270 pips
🔥 High-probability setup
📌 EMA (Exponential Moving Average – 70)
📍 EMA 70 at 1.13102
🔻 Price is below the EMA → favors bearish momentum
🧠 Pro Tips:
🔍 Watch for bearish engulfing or rejection candles at the entry zone.
🗓️ Be aware of major news events (ECB, Fed).
🧮 Adjust lot size for risk management (based on SL size).
✅ Summary:
🧩 Element 📊 Value
Trade Type 🔻 Short (Sell)
Entry Point 📌 1.13694
Stop Loss ⛔ 1.14419
Take Profit 🎯 1.10970
RRR ⚖️ ~3:1
Sentiment 📉 Bearish

AUD/CHF Breakout Alert: Bullish Setup from Descending Wedge!🔻 Pattern: Descending Wedge
📐 Formed by lower highs and higher lows.
🟡 Indicates price compression — often a bullish breakout setup!
🔼 Breakout direction expected: UP
🟦 Support Zone
📍 Located around 0.52614 – 0.53000
📉 Price bounced multiple times here — strong buying interest
🛡️ Acts as a demand zone
🟢 Entry Point
🎯 Entry range: 0.53000 – 0.53188
💥 Breakout candle appears ready to close outside the wedge
⚡ Momentum may be building for a push higher
🎯 Target Point
🔵 Target: 0.54450
📈 Near recent highs — aligns with pattern breakout projection
🎉 Aiming for a good profit zone
🔴 Stop Loss
❌ Stop loss: 0.52623
🛑 Below the wedge and support — protects from a false breakout
⚖️ Keeps risk-reward ratio attractive
📊 Indicator
🧭 EMA 70 (Red Line) at 0.53360
🔄 Price hovering near it — crossing above = bullish signal
📌 Trade Setup Summary
🔸 Pair: AUD/CHF
🔸 Timeframe: 4-Hour (4H)
🔸 Pattern: Descending Wedge
🔸 Bias: Bullish
🔸 Entry: 0.53000 – 0.53188
🔸 Target: 0.54450 🟢
🔸 Stop Loss: 0.52623 🔴
✅ Conclusion
🚀 If price breaks above the wedge and EMA, this could be a high-probability long trade.
📏 Tight stop, wide target = good risk/reward setup!

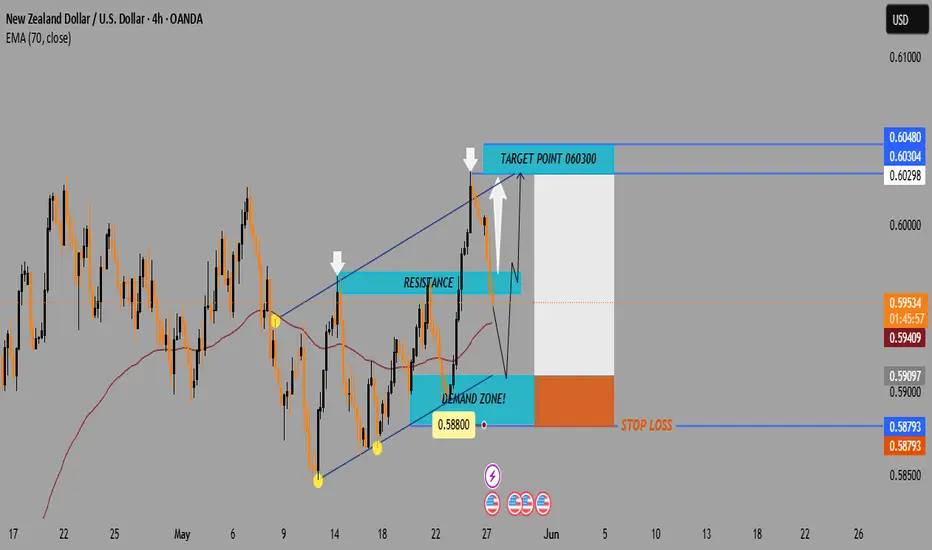
NZD/USD4H Chart Analysis Bullish Reversal Setup from Demand Zone📈 Price: 0.59552
📊 EMA 70: 0.59410 (🟤 Brown Line)
Chart Zones & Key Levels
🔷 Resistance Zone:
🔼 Around 0.60298 – 0.60304
🔹 Price reacted strongly here (🔽 white arrows)
🔹 Acts as a ceiling for now
🟢 Demand Zone:
🔽 Around 0.58800
✅ Buyers stepped in here before
📉 If price drops again, might bounce from here
🟥 STOP LOSS:
❗ 0.58793
🔸 Protects from deeper losses if trend breaks down.
TRADE IDEA
1️⃣ Entry Idea: Wait for a pullback into the Demand Zone
📉⬇️
2️⃣ Bullish Reversal Expected:
⬆️ Bounce toward Target Zone
🎯 Target Point: 0.60300
🟦 Profit zone marked in blue
💸 Good Risk/Reward ratio.
Indicators & Pattern
📐 Wedge Pattern:
🔹 Bullish breakout potential
🔹 Currently respecting the channel
📉 EMA Crossover Area:
🔸 Could act as dynamic support/resistance
🟤 Price hovering around EMA (0.59410)
Summary:
✅ Buy Setup if price holds above 0.58800
🎯 Target: 0.60300
🛑 Stop Loss: 0.58793
⚠️ Watch the price reaction at the Demand Zone for confirmation!