‼️ Economic Calendar Week 09.05-13.05 Next week will be a less fundamentally busy one, as we have only CPI on USD and OPEC Meetings on Wednesday, this means we could see some volatility on OIL and PPI on USD on Thursday, so you are free to trade technically. I expect the price to respect technical arguments and we will make some great trades.
Fundamentalstrategy

BTC returns to around $ 40,000 !Hello everyone, let's take a look at the BTC to USDT chart on a 1 day time frame. As you can see, the price moves in the uptrend channel marked with blue lines.
Let's start with the designation of the support line and as you can see the first support in the near future is $ 38,782, if the support breaks down, the next one is $ 36,174 and $ 32,893.
Now let's move from the resistance line, as you can see, the first resistance BTC is heading towards is $ 40,170, if you can break it, the next resistance will be $ 41,727 and $ 42,905.
Looking at the CHOP indicator, we can see that in the 1-day interval we have a lot of energy that can be used in the coming days, while the MACD indicator shows a continuation of the upward trend.

Will BTC go as planned?Hello everyone, let's take a look at the BTC to USDT chart on a 1 day time frame. As you can see, the price moves in the local uptrend channel marked with blue lines.
Let's start with the designation of the support line and as you can see the first support where BTC is currently at is $ 38,740, if the support breaks down, the next is $ 36,221 and $ 32,887.
Now let's move from the resistance line as you can see the first resistance is $ 40,185, if you can break it the next resistance will be $ 41,704 and $ 42,927 plus $ 44,223.
Looking at the CHOP indicator, we can see that we have a lot of energy in the 1-day interval. On the other hand, the MACD indicator shows that we are at the border, but we are maintaining an uptrend.


BTC is getting closer to support! There is a lot of energy.Hello everyone, let's take a look at the BTC to USDT chart over the weekend 1. As you can see, the price is moving in the uptrend channel marked with the blue lines.
Let's start with the designation of the support line and as you can see the first support in the near future is $ 37,401, if the support breaks, then we have a fundamental support zone ranging from $ 31,251 to $ 28,798.
Now let's move from the resistance line, as you can see, the first resistance is $ 41,467, if you can break it, the next resistance will be $ 46,722, another resistance is $ 51,085 and the next resistance is $ 55,348.
Looking at the CHOP indicator, we can see that in the 1 weekend interval we have a lot of energy and although some energy was used for the correction, the MACD indicator shows that it will remain in the upward trend.

EUR/USD heading towards 1.0500...After reviewing the strength building on the dollar, it is clear to see the strong trends forming across the major currency pairs.
1.0500 is the next weekly/monthly directional target to the downside sitting almost 400 pips away.
We have a small amount of US and EU news heading into the final stages of this week. However we are looking at long term possible strong movements into fresh yearly lows for this pair.

NYKAAFSN E-commerce Ventures Ltd. (FSNEV) popularly known as "NYKAA" is a digitally native consumer technology platform, delivering a content-led, lifestyle retail experience to consumers. The company has a diverse portfolio of beauty, personal care, and fashion products, including owned brand products manufactured by it.
Technical :- Company recently Listed in stock market that's why so the chart was not enough to analysis,
:-Stock is listed with good profits and then you see a rally then the stock correct their price and now it's ready to rock..
Fundamental :- Sales Increase on YOY, Profit margin Increase on YOY,
Most of females give a first preference to NYKAA in Beauty product as per my Research, I'd like to recommend this on a FUNDAMENTAL basis because I think it will do something big..
NSE:NYKAA
****IT IS FOR A LONG TERM****
DISCLAIMER :
**I am not SEBI register..**
**This is not an investment or Trading advice. This is Just for discussion/paper trading purposes.**

APE takes a breath after the last growth move.Hello everyone, let's take a look at the APE to USDT chart at 4H. As you can see, the price is moving in the uptrend channel marked by the blue lines.
Let's start with the designation of the support line and as you can see the first support in the near future is $ 15.90, if the support breaks down, the next we have at $ 14.95, another support at $ 14.16 and another at $ 13.40.
Now let's move from the resistance line as you can see the first resistance is $ 17.89, if you can break it the next resistance will be $ 20.53.
Looking at the CHOP indicator, we can see that on the 4H interval, it can be seen that the energy that was collected was used for an upward move and we are currently accumulating and gaining energy.
On the other hand, the MACD indicator shows an upward trend.

BTC has a lot of energy, so be careful.Hello everyone, let's take a look at the BTC to USDT chart over the weekend 1. As you can see, the price is moving in an uptrend channel marked by blue lianas.
Let's start with the designation of the support line and as you can see the first support in the near future is $ 40,586 if the support breaks, the next is $ 38,755, the next support at $ 36,204 and another at $ 32,933.
Now let's move from the resistance line as you can see the first resistance is $ 42,156, if you can break it the next resistance will be $ 43,334 another at $ 44,479.
Looking at the CHOP indicator, we can see that we have a lot of energy in the 1 weekend interval and we can expect big moves in the near future. It is worth paying attention to the MACD indicator which shows that we are in the growth phase.

JASMY bounces off the resistance at $ 0.02482Hello everyone, let's take a look at the JASMA to USDT chart on intervale 1 weekend. As you can see, price is moving above the local uptrend line.
Let's start with the designation of the support line and as you can see the first support in the near future is $ 0.01910, if the support breaks, the next one is $ 0.01073.
Now let's move from the resistance line, as you can see, the first resistance is $ 0.02482, if you manage to break it, the next resistance will be $ 0.02482, another one is $ 0.03340 and the next resistance is $ 0.03721.
Looking at the CHOP indicator, we can see that there is very little energy in the 1 weekend interval.

GMT takes a breath after large price increaseHello everyone, let's look at the GMT chart to USDT on the 4h interval. As you can see, the price moves above the local growth trend line designated with a blue line.
Let's start with the designation of the support line and as you can see the first support in the near future is $ 3.41, if the support will be broken, the next it is $ 3.14 at 2,93 $ and 2,71 $.
Now let's move from the resistance line, as you can see, the first resistance is 3.83 $ = 1.618Fib Retracement from which the price has just bounced if you manage to break it, the next resistance can be determined in the area of 4.96 $.
Looking at the Chop indicator, we see that in the 4-hour interval, most energy has been exhausted. It is possible that we will have to wait for the next move until energy is collected.

BTC returns to around $ 41,000 after the last correction.Hello everyone, let's take a look at the 4H BTC to USDT chart. As you can see, the price is moving in the uptrend channel marked by the blue lines.
Let's start with the designation of the support line and as you can see the first support in the near future is $ 38,732, if the support breaks down, the next one is $ 36,175 and $ 32,960.
Now let's move from the resistance line as you can see the first resistance is $ 42,250, if you can break it the next resistance will be $ 43,404 and $ 44,559.
Looking at the CHOP indicator we can see that in the 4-hour interval some energy has been used up, but we have a little bit to continue the movement. On the other hand, the MACD indicator shows that the blue line is above the yellow line, which confirms the upward direction of the price.

FTM has collected energies on the 4H intervalHello everyone, let's take a look at the 4H FTM to USDT chart as you can see the price is approaching the exit from the triangle.
Let's start with the designation of the support line and as you can see the first support in the near future is $ 1.1, if the support breaks down, the next one is $ 1.03.
Now let's move from the resistance line as you can see the first resistance is $ 1.24, if you can break it the next resistance will be $ 1.32 and $ 1.39.
It is worth paying attention to the CHOP indicator, we can see that in the 4-hour interval we have a lot of energy and we can expect traffic in the coming hours.

LUNA possible sideways trend.Hello everyone, let's take a look at the LUNA to USDT chart in 1 day. As you can see, the price is moving in an uptrend channel marked with blue lines.
Let's start with the line of support and as you can see the first support is $ 73, if the support breaks down, the next is $ 60, and the next is $ 44.
Now let's move from the resistance line as you can see the first resistance is $ 88, if you can break it the next resistance will be $ 94 and $ 99.
Looking at the CHOP indicator, we can see that in the 1D interval the energy has been used. We can expect LUNA to follow a sideways trend if BTC remains stable.

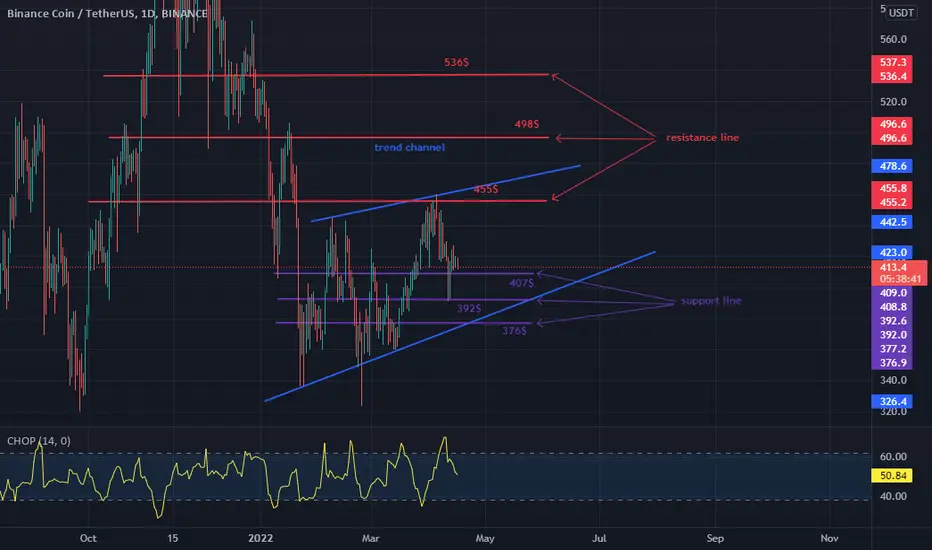
BNB remains above the $ 407 supportHello everyone, let's take a look at the BNB to USDT chart within 1 day. As you can see, the price is moving in an uptrend channel marked with blue lines.
Let's start with the designation of the support line and as you can see the first support at which the BNB price is currently located is $ 407, if the support breaks down, the next is $ 392, and the next is $ 376.
Now let's move from the resistance line as you can see the first resistance is $ 455, if you can break it the next resistance will be $ 498 and $ 536.
Looking at the CHOP indicator, we can see that in the 1D interval we still have some energy to continue the movement.
BTC has exhausted its energy in the 1D intervalHello everyone, let's take a look at the BTC to USDT chart over the 1 day timeframe. As you can see, the price is moving in an uptrend channel marked with blue lines.
Let's start with the designation of the support line and as you can see the first support in the near future is $ 38,809, if the support breaks down, the next one is $ 36,107 and another one at $ 32,825.
Now let's move from the resistance line as you can see the first resistance is $ 41,221, if you can break it the next resistance will be $ 46,625 and $ 50,871.
Looking at the CHOP indicator, we can see that in the 1-day period most of the energy has been depleted, we should not see much movement the next day.

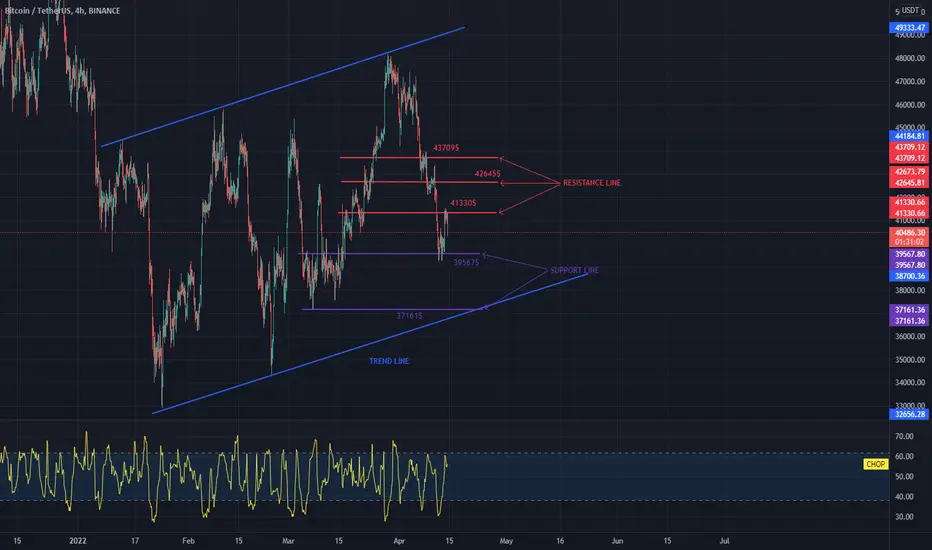
BTC, despite the correction, is moving in the uptrend channelHello everyone, let's take a look at the BTC to USDT chart on a 1 hour timeframe. As you can see, the price is moving in the uptrend channel.
Let's start with the designation of the support line and as you can see the first support in the near future is $ 39,567, if the support breaks down, the next one is $ 37,161.
Now let's move from the resistance line as you can see the first resistance is $ 41,330, if you can break it the next resistance will be $ 42,645 and $ 43,709.
Looking at the CHOP indicator, we have a lot of energy in the 1 hour interval, so we can expect the continuation of the movement.
ETH follows BTC and rebounds after correction.Hello everyone, let's take a look at the ETH to USDT chart on the 1D time frame. As you can see, price is moving above the local uptrend line.
Let's start with the designation of the support line and as you can see the first support in the near future is $ 3028, if the support breaks down, the next one is $ 2863 and $ 2697.
Now let's move from the resistance line as you can see the first resistance is $ 3187, if you can break it the next resistance will be $ 3506 and $ 3830.
Looking at the CHOP indicator, we can see that in the 1D interval, some energy has been used, but we still have a little more for the next move.

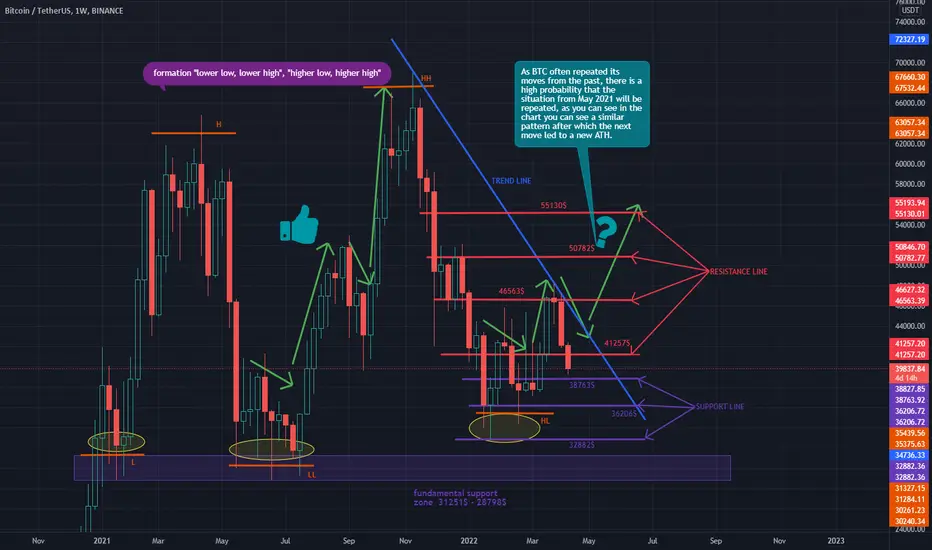
Does BTC repeat your movement from May - November?Hello everyone, let's take a look at the BTC to USDT chart. For 1 weekend interval. As you can see, the price is moving below the downtrend line.
However, it is worth noting that we can just see a higher peak and a higher low on the chart, as well as a very similar situation to that in May 2021.
Let's start with the designation of the support line and as you can see the first support in the near future is $ 38,763, if the support breaks, the next is $ 36,206 and $ 32,882 then we have the fundamental support zone from $ 31,251 to $ 28,798.
Now let's move from the resistance line, as you can see, the first resistance is $ 41,257, if you can break it, the next resistance will be $ 46,563 and $ 50,782, and another resistance is $ 55,130 = 0.618Fib.
LUNA recorded a correction along with the entire marketHello everyone, let's take a look at the 1D LUNA to USDT chart. As you can see, the price has dropped below the local blue uptrend line.
Let's start with the line of support, and as you can see, the first support that has already bounced back is $ 81.33, if the support breaks, the next is $ 72.23 and $ 59.56, and the next is around $ 43.28.
Now let's move from the resistance line, as you can see, the first resistance is $ 89.38, if you can break it, the next resistance will be $ 95.36, the next resistance will be $ 100 and another $ 104.65.
Looking at the CHOP indicator, we can see that in the 1D interval most of the energy has already been used, while the MACD indicator shows that the blue line has crossed the red line from the top, which confirms the change in the trend.

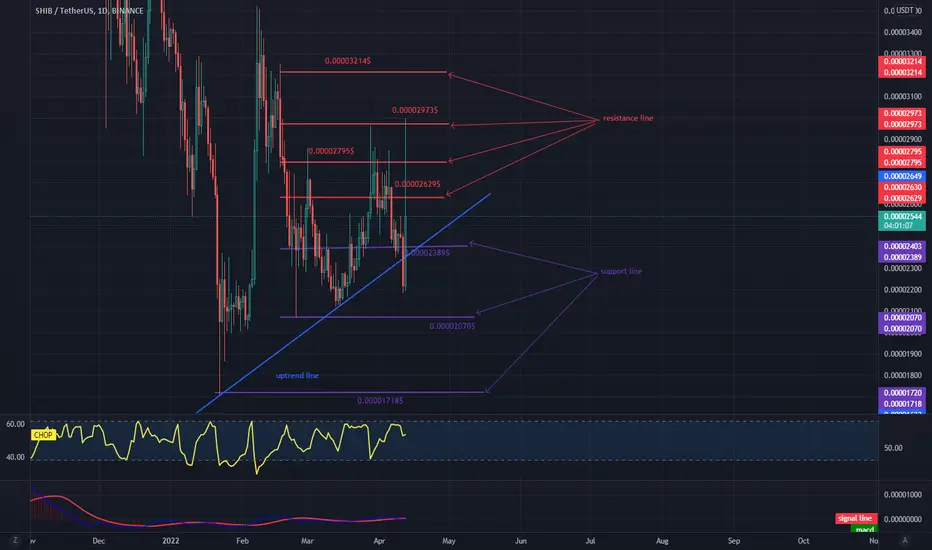
SHIBUSDT quickly returned above the local uptrend.Hello everyone, let's take a look at the SHIB to USDT chart on the 1D Interval as we can see that the price has gone down and then quickly back above the local uptrend line.
Let's start with the designation of the support line and as you can see the first support in the near future is $ 0.00002389 on which the price is currently based if the support breaks, the next one is $ 0.00002070 and another $ 0.00001718.
Now let's move from the resistance line, as you can see, the first resistance is $ 0.00002629, if you can break it, the next resistance will be $ 0.00002795, the next resistance is $ 0.00002973 and the next one at $ 0.00003214.
Looking at the CHOP indicator, we can see that in the 1D interval we have a lot of energy for the next move.
BTC has experienced a local correctionHello everyone, let's take a look at the BTC to USDT chart on a 1 day time frame. As you can see, after determining the local uptrend line, ignoring the downward peaks, the price moves above the blue line.
Let's start with the designation of the support line and as you can see the first support in the near future is $ 38,752, if the support breaks down, the next one is $ 36,160 and $ 32,874.
Now let's move from the resistance line, as you can see the first resistance is $ 41,317, if you can break it the next resistance will be $ 43,626 another $ 43,721 and another $ 44,763.
Looking at the CHOP indicator, we can see that in the 1-day interval the energy has been depleted and is slowly starting to bounce back.

DOGE drops after BTC correctionHello everyone, let's take a look at the DOGE to USDT chart over the 4 hour timeframe. As you can see, the price has dropped below the local uptrend line.
Let's start with the designation of the support line and as you can see the first support in the near future is $ 0.137, if the support breaks down, the next one is $ 0.125 and $ 0.11.
Now let's move from the resistance line as you can see the first resistance is $ 0.147, if you can break it the next resistance will be $ 0.153 and $ 0.158.
Looking at the CHOP indicator, we can see that in the 4-hour interval most of the energy has been exhausted.
