Gold (XAU/USD) Bullish Trade Setup – Breakout in ProgressTrend Overview
📈 Uptrend in Progress
Price is moving within an ascending channel:
🔵 Support Line (bottom of channel)
🔺 Resistance Line (top of channel)
Key Levels
Current Price:
● 3,337.53 (📍)
Trade Idea (Long Setup):
🔵 Entry Zone
● 3,306.85 – 3,302.98
(Wait for pullback into this area)
🟦 RBS + RBR ZONE – Previous resistance, now potential support
🔴 Stop Loss
● 3,265.51
💣 Protect your capital below support zone
🎯 Target
● 3,490
🚀 Bullish target based on breakout from channel and momentum
📉 EMA 70:
● 3,282.74 (📉 Red Line)
Helps confirm trend direction. Price above EMA = Bullish bias.
Outlook Summary
✅ Wait for a dip to entry zone
✅ Stop below recent support zone
✅ Target high at 3,490 if breakout continues
Fundamentalstrategy

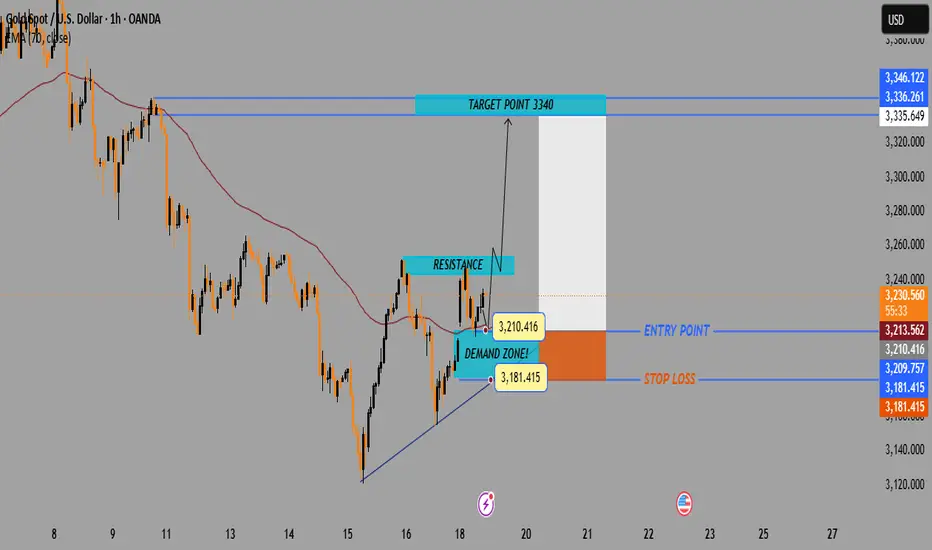
Gold 1-Hour Breakout Play • 3 210 3 340 • R : R 1 : 4🔍 Quick Chart Take
* 📉 Overall trend: down (still under the 200-MA)
* 🔺 Pattern forming: ascending triangle / wedge ➡️ potential breakout
📦 Zones
* 🟢 Demand / Entry: 3 181 – 3 210
* 🚧 Resistance cap: 3 235 – 3 250
* 🎯 Target: 3 340
⚔️ Trade idea
* ✨ Long at 3 210
* 🛑 Stop-loss 3 181
* 🏆 Take-profit 3 340
* 📏 R : R ≈ 1 : 4
👀 Watch for
* ✅ 1-h close above 3 250 ➡️ breakout confirmed
* ❌ Break of rising trendline or dip under 3 181 ➡️ idea dead
* 🗓️ Upcoming USD news (flag icon) & Dollar Index moves
🔑 Bottom line: Bullish pop inside a bigger bear trend—momentum play, keep the stop tight!
DXY Bearish Setup: Sell from Supply Zone to 99.100 TargetTrend: 📉 Bearish Bias
Key Zones & Strategy:
🔶 Supply Zone (Sell Area)
📍 100.584 – 100.906
⚠️ Price may face selling pressure here
🔵 Entry Point:
🎯 100.584 (bottom of supply zone)
🔴 Stop Loss:
❌ 100.906 (just above resistance)
🟢 Target Point:
✅ 99.100
📉 Aligned with lower support line
Technical Indicators:
📏 Descending Channel
🔽 Price moving within parallel downward trend lines
📊 EMA (70) – Orange Line
🔁 Acting as dynamic resistance
Trade Setup Summary:
📌 Sell in the Supply Zone
🛑 Stop Loss: 100.906
🎯 Target: 99.100
⚖️ Good Risk-Reward Ratio
Warnings & Tips:
⚡ Watch for Breakouts:
If price breaks above 100.906 ➡️ 📈 Bearish idea invalid
📰 Check News Events:
FOMC, CPI, or other USD events may cause volatility

Bitcoin Short Setup –Supply Zone Rejection Trade Plan (1H Chart)(BTC/USD – Technical Setup)
🔵 Trend Setup:
⬆️ Resistance Line – Price is struggling to break above this level.
⬇️ Support Line – Price bounced several times here before breaking down.
🟢 EMA 70 – Currently around 104,435.9, acting as dynamic support/resistance.
📍 Key Levels:
🔴 Stop Loss Zone:
107,488.4 to 107,402.4
(🚨 Strong resistance, limit losses!)
🟡 Entry Point:
106,026.8
(🟨 Inside the Supply Zone – Ideal for Sell)
🟦 Supply Zone:
106,026.8 to 107,402.4
(⚠️ High selling pressure expected here!)
🔵 Break of Structure (BOS):
Price broke below the rising support line
(📉 Bearish confirmation!)
🎯 Target Point:
99,000.0
(💰 Take Profit Target!)
🔻 Trade Idea:
SELL at 106,026.8
🛑 Stop Loss: 107,488.4
✅ Target: 99,000.0
Risk-Reward looks solid.
This is a short setup expecting a drop after a retest of the supply zone.

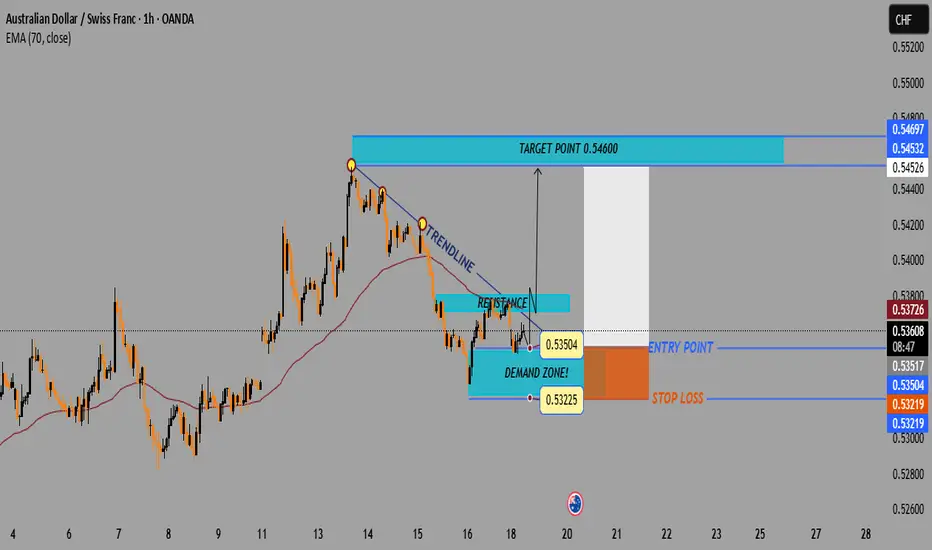
AUD/CHF Bullish Breakout Setup – Demand Zone to Target 0.546001. Setup Overview
📈 Trade Type: Long (Buy)
📊 Chart Pattern: Trendline Breakout
📏 Indicator Used: EMA (70) — 🔴 0.53726
2. Key Price Levels
🔵 Demand Zone:
* 0.53225 – 0.53504
* Strong buying interest seen here
⬆️ Entry Point:
* Around 0.53517 – 0.53630
* Price is breaking above resistance and trendline
🛑 Stop Loss:
* Below 0.53219
* Protects against false breakout
🎯 Target Point:
* Primary TP: 0.54600
* Extended TP: 0.54697
* Previous supply/resistance zone
3. Structure Breakdown
📉 Trendline:
* Downward sloping trendline has been tested
* Price looks to be breaking out
📌 Resistance Turned Support:
* Break above 0.53500 confirms bullish momentum
📊 EMA (70):
* Current price is slightly below EMA
* Bullish confirmation if price closes above it
4. Risk-to-Reward
⚖️ R:R Ratio: Approximately 1:3
* Small stop loss for a much larger upside
XAUUSD GOLD Just Grabbed liquidity Below a key low analysis Full Guide: How to Use COT Data for Trading XAUUSD (Gold)
1. What is COT Data?
The Commitment of Traders (COT) report is a weekly publication by the Commodity Futures Trading Commission (CFTC). It shows the aggregate positioning of different types of traders in the futures markets.
For XAUUSD (Gold), you’ll look at the Gold futures (COMEX) section.
2. Key Trader Categories in COT Report
1. Commercials (Hedgers):
Typically big institutions or producers like mining companies.
They use futures to hedge exposure, not speculate.
Usually short during rallies and long when price is low.
2. Non-Commercials (Large Speculators):
Hedge funds, money managers.
Considered the "smart money." Full Guide: How to Use COT Data for Trading XAUUSD (Gold)
1. What is COT Data?
The Commitment of Traders (COT) report is a weekly publication by the Commodity Futures Trading Commission (CFTC). It shows the aggregate positioning of different types of traders in the futures markets.
For XAUUSD (Gold), you’ll look at the Gold futures (COMEX) section.
---
2. Key Trader Categories in COT Report
1. Commercials (Hedgers):
Typically big institutions or producers like mining companies.
They use futures to hedge exposure, not speculate.
Usually short during rallies and long when price is low.
2. Non-Commercials (Large Speculators):
Hedge funds, money managers.
Considered the "smart money."
Follow trends and often drive major moves.
3. Nonreportables (Retail/Small Traders):
Smaller traders, often contrarian indicators.
Not always consistent with price direction.
---
3. Where to Find COT Data
CFTC Website
Tools like:
Tradingster.com
BarChart.com
COTbase.com
Look for "Legacy" or "Disaggregated" COT reports for Gold - COMEX.
---
4. How to Read the COT Data for Gold
Key Metrics:
Longs/Shorts: Number of contracts held.
Net Positions: Longs minus Shorts.Changes WoW: Increase/decrease in positions compared to the prior week.
Example Insight:
If Non-Commercials are heavily net long, and reaching historical highs, market may be overbought.
If Commercials increase shorts significantly, they may be preparing for a price decline.
A divergence between price action and COT data often signals potential reversal.
---
5. Using COT for Gold Trading (XAUUSD)A. Trend Confirmation
Rising net long positions by non-commercials = bullish confirmation.
Decreasing net long or rising shorts = weakening trend or reversal.
B. Reversal Spotting
Extremes in positioning (e.g., record longs by speculators) often precede reversals.
Look for non-commercials reducing longs while commercials increase shorts—potential top.
C. Liquidity Grabs and COT
If gold grabs liquidity (stop hunts) and COT shows heavy speculative positioning, that could be a smart money trap.
A strong bullish reversal after liquidity grab with increasing net longs confirms a momentum shift.
---
6. How to Combine COT with Technical Analysis
Use COT to validate or question what you see on the chart.
Example Setup:
Chart: Gold drops below key support (liquidity grab).
COT: Non-commercials increase longs that week.
Conclusion: Smart money bought the dip — potential for bullish reversal.
Combine with:
Market structure
Volume
Sentiment tools
Price action (e.g., bullish engulfing, break of structure)
---
7. Limitations and Tips
Lagging Data: COT is released every Friday for data on Tuesday.
Use it for context and macro positioning, not for intraday trades.
Look at weekly or monthly trends, not daily.
Best used alongside price action and other confirmation signals.
---
Conclusion
COT data is a powerful tool for understanding who is behind the move in gold. By tracking the positioning of major players, you can:
Confirm trends
Spot early signs of reversal
Align your trades with institutional momentum

BITCOIN BTC Is Entering Into The Correction Read Caption Bitcoin Chart Analysis: Potential Correction Incoming
In my opinion, Bitcoin (BTC) is showing signs of entering a correction phase. The price is approaching its previous all-time high (ATH), and historically, such levels often act as strong resistance. With the market exhibiting signs of exhaustion and profit-taking behavior, a short-term pullback or consolidation could be expected before any further bullish continuation.
---
Would you like a more technical version with indicators (like RSI, MACD, or Fibonacci levels), or a visual chart to accompany

USD/JPY Bullish Setup – Demand Zone Buy Opportunity Toward 151.5🔍 Chart Overview (4H Timeframe):
Currency Pair: USD/JPY
Trend: 📈 Uptrend
EMA 70: 🔴 (144.776) – Price is trading above it = Bullish Bias
---
🟦 Demand Zone
📌 Zone: 144.804 – 146.324
💡 What it means: Strong buying interest expected here
🟢 Support line + EMA = Confluence zone!
---
✅ Entry Point:
📍 Between: 146.324 – 146.423
🎯 Best area for long (buy) position
📊 Wait for a pullback to this area before entering
---
❌ Stop Loss:
📉 Below demand zone
🔻 Range: 144.705 – 144.776
🛡️ Helps protect against unexpected drop
---
🎯 Target Point:
📈 151.500
🟩 Big reward area
🔥 Previous resistance zone = Ideal profit-taking point
---
🧭 Summary:
✅ Entry: 146.324
❌ Stop: 144.776
🎯 Target: 151.500
Risk-to-Reward: Excellent!

XAU/USD Bearish Trade Setup Supply Zone Rejection to Target 3350Trend Overview
📉 Downtrend in Play
Price has reversed from the peak near $3,354
Currently trading below the 70 EMA (📍$3,299.86)
Forming lower highs – indicating bearish momentum.
Key Zones & Levels
🔶 Supply Zone (Resistance)
📍 $3,290.72 – $3,353.41
Strong selling pressure expected here
Possible short entry if price gets rejected
🟦 Support Zone (Previous Support)
📍 Around $3,254 – $3,210
Price has previously bounced here
🎯 Target Point (Take Profit)
📍 $3,050
Clear support level – used as a profit target
Trade Setup – Bearish Bias
🟩 Entry Point
📉 Sell near $3,290.72 (inside supply zone)
🛑 Stop Loss
❌ Above $3,354.69 (above resistance line)
✅ Take Profit
💰 Target $3,050
⚖️ Risk-Reward Ratio
Approx. 1:3 – Favorable for short trades.
Summary
🔍 Watch for a rejection in the supply zone
💼 Setup is ideal for short sellers
📊 Downtrend is supported by structure and EMA

Bullish on bigger time frames.
Bullish on bigger time frames.
Took support from a very important
level around 36-37.
HL printed.
40.30 - 40.85 is a Resistance level as
of now.
If it gets rejected from this level, we may
witness 37.50 - 38.50 again.
Upside targets can be around 45 - 46 & then
50s.

(BTC/USD)1H Chart Analysis –Bullish Breakout Setup Toward 98,000Technical Breakdown:
🔹 EMA 9
📉 Orange line (EMA 9 close): $93,233.68
➡️ Price is above EMA, showing bullish strength.
📦 RBR Zone (Rally-Base-Rally)
🔵 Zone: ~$92,000 - $93,000
🛡️ Acts as a support area — price could bounce here if it dips.
🚧 Resistance Zone
📍 Just above current price
📈 A breakout above this zone may trigger a bullish run.
🎯 Target Point: $98,000
🚀 Potential gain: +7.09%
📊 Strong upside target if breakout holds.
🛑 Stop Loss: $90,314.13
⚠️ Placed just below the RBR zone to minimize risk.
Trade Idea Summary:
🔽 Entry: On breakout above resistance
🎯 Target: $98,000
🛑 Stop Loss: $90,314.13
📈 R:R Ratio looks favorable

(XAU/USD) 1H Chart – Bullish Reversal Setup from RBS + RBR Zone1. Current Price:
$3,317.27
● Price is currently in a downtrend after a recent high.
● EMA (9) is at $3,333.80 — acting as dynamic resistance.
⚠️ Watch for potential reversal!
2. Support Zone:
📦 Blue box marked as "RBS + RBR zone!"
● This is a key support area where price might bounce.
● RBS = Resistance Becomes Support
● RBR = Rally-Base-Rally
● Expecting buyers to step in here.
3. Trade Idea:
● Buy near $3,280 - $3,270 (inside the support box)
● Stop Loss: ❌ Below $3,258.00
● Target: 🎯 $3,500.13
4. Risk-Reward Ratio:
● Target: 🟦 +205.62 points (6.25%)
● Stop: 🔻 Small risk below support
● Good R:R setup if price respects the zone!
Scenario Summary
📉 Price is retracing
⬇️ Approaching strong support zone
📈 Possible bounce to $3,500
✅ High-probability reversal area
❗ Manage risk with tight stop below zone

BTC/USD 1H – Bullish Breakout with FVG Entry & $91K TargetChart Breakdown:
📈 Trend Structure:
BTC is moving in an ascending channel with:
🔵 Resistance Line on top
🟢 Support Line below
🔁 Recently, it broke out above the resistance with a bullish move!
Key Zones & Levels:
🟦 Fair Value Gap (FVG)
This is your potential buy zone:
✅ Entry Point: $86,135
❌ Stop Loss: $85,098
🎯 Target: $91,000
📌 Plan:
Wait for price to retrace into the FVG zone
Look for a bullish bounce ✅
Enter long at $86,135
Set your SL and target accordingly
Risk-Reward Setup:
Risk: Small (below FVG zone) ❗
Reward: Big upside toward $91,000 🚀
Gain Potential: +5.74% ($4,948 per BTC)
Visual Flow:
1️⃣ Price breaks resistance 🔼
2️⃣ Pullback expected to FVG 🔽
3️⃣ Entry triggers around $86,135
4️⃣ Targeting moon shot to $91K 🌕
Conclusion:
This setup shows a bullish continuation with solid RR.
If BTC holds the FVG on a retest, the move to $91K looks likely!

(XAU/USD) Bullish Setup: Demand Zone Bounce with 5.89% Trgt Ptnl🔵 Current Price: $3,451.03
🟡 EMA (9): $3,457.20
🔻 Price is just below EMA — short-term pressure.
Zones & Key Levels:
🟦 Demand Zone:
🔽 Price bounced here before — strong buyer interest!
📍 Zone Range:
* Top: $3,442.38
* Bottom (Stop Loss): $3,395.87
* 🔴 Stop Loss set here to limit risk.
🟨 Entry Point:
* Entry suggested at $3,457.20
* Just above the current price and EMA — needs confirmation
* ⚠️ Wait for bullish candle or price action signal above EMA
🟩 Target Point:
🎯 Target: $3,645
* 📈 Potential gain: +202.78 pts (5.89% upside)
* 🚀 Aiming to break previous ATH (All-Time High)
Visual Trade Plan Summary:
* ✅ Buy Entry: $3,457.20
* ❌ Stop Loss: $3,395.87
* 🎯 Target: $3,645.00
* ⚖️ Risk-to-Reward: Solid, over 3:1
Sentiment:
* If price respects demand zone and reclaims EMA — bullish setup
* 🕵️♂️ Watch for volume or confirmation candle near entry

"Gold on Fire: Eyeing $3500 After RBR Zone Rebound! "1️⃣ Trend Overview
📈 Strong bullish rally from April 11 to the peak.
📉 Pullback after reaching the recent ATH (All-Time High) zone.
2️⃣ Key Zones
🔵 RBR Zone (Rally-Base-Rally):
Marked support area between $3,271.41 and $3,307.04.
Acts as a buy zone / entry point.
🟣 ATH Zone:
Minor resistance from the recent high.
Price pulled back from here before potentially continuing up.
3️⃣ Entry & Target
✅ Entry Point: Around $3,307.04 (top of RBR zone).
🎯 Target Point: Clearly defined at $3,500.71.
Potential Gain: +188.59 points
ROI: +5.70%
4️⃣ Indicator
📊 EMA (7, close):
Currently at $3,329.09
Price is slightly below EMA = short-term correction or pause.
Strategy Summary
🟢 Buy Setup:
Wait for price to return to RBR zone
Enter long position ✅
Target $3,500 🚀
⚠️ Risk Consideration:
Place stop-loss below RBR zone for safety.

“ EUR/GBP Buy Setup – Demand Zone to the Moon? ”Key Zones & Levels
🟦 Demand Zone:
Between 0.85555 – 0.85200
Buyers previously pushed price up here — now acting as a strong support base!
🎯 Target Point:
0.87406
Potential upside of +179 pips / +2.09%
🟢 Entry Point:
Around 0.85555, just above the demand zone
Ideal spot for a Buy Entry if confirmation shows.
🛑 Stop Loss:
Set at 0.85200
Smart risk protection below the zone.
Indicators
📉 Downtrend Line:
A break above this could signal the start of a bullish Reversal.
📈 EMA (7-period):
Currently around 0.85796
Reclaiming above this line strengthens the buy signal.
Trade Plan Summary
✅ Buy on bounce from demand zone
🔓 Breakout of the trend line = confirmation
🎯 TP: 0.87406
🛡️ SL: 0.85200
⚖️ Risk-to-Reward Ratio: Excellent (about 1:6)
Final Thoughts
Wait for bullish candles near the entry point
Watch fundamentals too — EUR & GBP news could impact direction
Stay alert for false breakouts below the demand zone

“GBP/USD Long Setup: Demand Zone Bounce Toward 1.35000 Target ”🔍 Trade Setup
🟦 Entry Point: 1.32171
➤ Price is near the 7 EMA – good for a possible bounce.
🟩 Demand Zone: 1.31761 - 1.31500
➤ This is where buyers previously stepped in.
➤ Strong support area – watch for bullish reversal candles here.
🔻 Stop Loss: 1.31141
➤ Below the demand zone to protect against a fakeout.
🎯 Target Point: 1.35000
➤ Big upside target – aiming for a strong rally.
⚖️ Risk to Reward
❌ Risk: 1.32171 → 1.31141 = ~103 pips
✅ Reward: 1.32171 → 1.35000 = ~283 pips
⚖️ R:R Ratio: ≈ 1:2.75 – very favorable!
✅ Summary
🔸 Trend is bullish with strong momentum
🔸 EMA is acting as dynamic support
🔸 Demand zone is clearly respected
🔸 Great R:R setup for a long trade

"EUR/USD Bearish Setup – Supply Zone Sniper Entry🔵 Supply Zone (Resistance Area):
📍 Between 1.13755 – 1.14258
🚫 Expecting sellers to dominate here
🧱 Acts like a ceiling that price struggles to break
🔽 Sell Setup:
🎯 Entry Point: 1.13755
🔥 Stop Loss: 1.14258 (above zone — protection!)
💰 Target Point: 1.11611
📉 Expecting price to drop after entering this zone
📏 Risk vs Reward:
⚠️ Risk: ~50 pips
🏆 Reward: ~210 pips
✅ RR Ratio: ~1:4.2 (very favorable)
📊 EMA (7, close):
🟠 Current price is hovering around EMA
⏳ Suggests consolidation or a potential reversal soon
🔁 Scenario Plan:
1. 📈 Price moves into supply zone
2. 🚨 Triggers entry (Sell) at 1.13755
3. 🚀 If wrong, hits Stop Loss at 1.14258
4. ✅ If correct, drops to Take Profit at 1.11611
Summary:
✍️ Bearish outlook
🛑 Strong supply/resistance expected
📉 Good setup for a short position with low risk and high reward

U.S. Dollar Index (DXY) – Key Resistance & Bearish Target Analys📊 Key Observations:
🔵 Resistance Zone (📍~103.5 Level)
A strong resistance area (🔵 blue box) is marked, indicating potential selling pressure if the price reaches this level.
The price is moving upwards (📈) towards this resistance, so watch for rejection or breakout.
🔵 Support/Target Zone (📍~101.5 Level)
A lower support zone (🔵 blue box) is marked as the bearish target 🎯.
If the price fails at resistance, it may head downwards (📉) to this level.
📉 Recent Price Action:
🚀 Sharp drop followed by a rebound (📈).
The price is currently moving back up (🔼), possibly forming a lower high before another drop.
📌 Exponential Moving Average (DEMA 9 - 102.488)
The price is hovering above the 9-period DEMA (📏), showing short-term bullish momentum.
If the price rejects resistance and falls below the DEMA, a bearish continuation (📉) is likely.
🚀 Potential Scenarios:
✅ Bullish Breakout: If price breaks above 🔵 resistance, it may continue rising (📈) to higher levels.
❌ Bearish Rejection: If price fails at resistance, expect a drop (📉) towards 101.5 🎯.

Bitcoin Trade Setup: Bullish Breakout Targeting $87K!🔹 Key Levels Identified:
📌 Target Point: 87,008.21 USD 🏁🔵
👉 Expected price move (+9.07%) 🚀
📌 Entry Point: 79,719.00 USD ✅
👉 Suggested buying level in demand zone 🏦
📌 Stop Loss: 78,213.25 USD ❌🔻
👉 Risk management level 📉
📊 Technical Analysis:
📈 Trendline Support:
🔵 The price bounced off the trendline 📊, confirming an uptrend 📈
🔵 Demand Zone:
🟦 Marked blue area = Buyer interest 📊
💰 Expected reversal zone if price retests
📊 Moving Average (DEMA 9):
🔸 82,343.85 USD (current level)
🔺 Price slightly below DEMA ➝ possible bullish reversal 🚀
⚡ Trade Setup:
✔️ Risk-to-Reward Ratio:
🟢 Potential profit: +7,220.76 USD
🔴 Risk: -1,500 USD
📊 Favorable trade setup with high reward vs low risk ✅
✔️ Momentum Confirmation:
🟢 Above 79,719 USD = 🚀 Bullish breakout
🔴 Below 78,213.25 USD = ❌ Stop Loss triggered
🔮 Conclusion:
🔥 Bullish setup if price holds demand zone!
🚀 Target: 87,008 USD
⚠️ Manage risk with stop loss! 📉

Gold (XAU/USD)Trade Setup – Bullish RBR Zone & High Reward Poten🔹 Key Levels:
📍 Entry Point: 3211 🔵
📍 Stop Loss: 3185.109 🔴
📍 Target Point: 3300 🟢
🔹 Market Structure:
📈 The price has formed a Rally-Base-Rally (RBR) zone 📊, which is a bullish continuation pattern 🚀.
🔄 The market surged and is now consolidating within the RBR zone 📦 before potentially resuming its uptrend 📢.
🔹 Trading Plan:
✅ Buy Entry: If price retraces into the RBR zone (around 3211), consider a buy position. 🛒📊
🔻 Stop Loss: Set below the base at 3185.109 to limit risk. ⚠️🚫
🎯 Take Profit: Aiming for 3300, a major resistance level. 🎯📈
🔹 Indicators & Confluence:
📏 DEMA (9): 3223.297 (Currently acting as resistance 🛑)
💰 Risk-Reward Ratio: Favorable setup (High Reward Potential ✅)
🔹 Potential Risks:
⚠️ If price drops below 3185, it could indicate a trend reversal 🔄⛔.
🌎 Economic News & Geopolitical Factors may impact Gold prices significantly. 📰📉
🔹 Conclusion:
📊 Bullish Opportunity 🦅📈 – If the price respects the RBR zone, it may continue upwards towards 3300! 🚀💰

NZD/USD 1H Chart Setup – Demand Zone Bounce & Bullish Target1. Chart Overview
Pair: NZD/USD
Timeframe: 1H
Current Price: 0.56961
Indicator Used: 9 EMA (📈)
2. Key Zones & Levels
🔵 Demand Zone
Area: Approx. 0.55933 – 0.56600
Role: Strong support area where buyers have shown interest
Bounce already observed from this zone
🟥 Re-Entry Zone
Slight pullback expected into this minor resistance-turned-support
Potential entry for bulls (🐂)
🎯 Target Point
Price: 0.58434
Gain: +3.59%
Strong resistance above
🛑 Stop Loss
Price: 0.55933
Just below the demand zone for protection
Keeps risk tight (🔒)
3. Trade Idea (Buy Setup)
📍 Entry Plan:
Wait for a pullback into the red zone
Confirm support holds
Look for long position setup
📈 Target:
Aim for 0.58434
High reward potential
📉 Stop Loss:
Below 0.55933 to minimize loss if setup fails
✅ Risk-Reward Ratio:
Attractive (approx. 2:1 or better)
Summary
Demand zone is strong (🛡️)
Market structure supports bullish move (🚀)
Setup favors a pullback buy strategy

BTC/USD Long Setup – Bounce from Demand Zone Towards $80K TargetKey Zones
Demand Zone (Buy Zone)
🔵 $74,250 – $75,000
Strong support area
Buyers previously stepped in here
Marked for potential entry
Resistance Zone
🟣 $77,300 – $77,600
Mid-level resistance
Could cause a short pullback
Watch for breakout or rejection
Target Point
🎯 $80,273.49
Potential upside: +6.68% gain
Previous supply/structure zone
Take Profit (TP) zone
Stop Loss
⛔ $74,247.07
Just below the demand zone
Protects against invalid setup
Trade Idea
1. 🔽 Price expected to drop into demand zone
2. 🔄 Wait for bullish confirmation (e.g. bounce or engulfing candle)
3. 📈 Enter long position near $75,000
4. ⬆️ Ride it up through resistance
5. ✅ Target = $80,273 | ❌ Stop = $74,247
