INTC - Is Intel still a human company?If INTC (Intel) wants better intel, they need to buy CRM (Salesforce). Who can call the CEO's, send me a few shares for the idea, and make this deal happen?
Who would you rather build the future, humans or artificial intelligence?
Future

USOIL WTI SHORTthe up trend has been broken, so price might start a down trend. However, as you can see in the chart there is a posible H&S. In the 15min chart, you can see how price is breaking a corrective structure to make a posible down impulse.
WTI should go to the neck of the H&S and then break it and go to the 56$.
The trade should be completed by the end of next week.
what do you think?

Bitcoin price in "despair" stage of bubble (BTC chart 2015-2016)The downtrend is not over. I expect a drop down to the last lows to form a real bottom before we can return to the mean. For more detail please look at my zoomed in version of this chart:

Will Bitcoin crash? Or is now the time to buy? Part IIThe chance that this is the long awaited uptrend is growing. This is an update of my original chart, which I created 1 month ago: In this update I optimized several indicators to better reflect the current trend.
Overall it's looking good. But 2014's downtrend has not finally been broken as of today. That's why I post this as a neutral outlook.

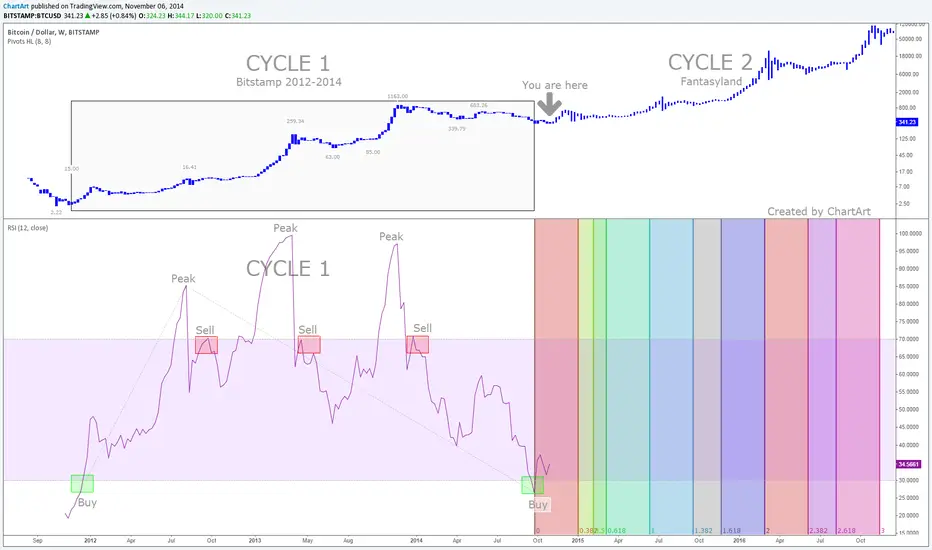
Fantasyland - Bitcoin Future Chart Scenario For 2012 To 2016Here is a land of imagination, hopes and dreams. Magic and make-believe are reborn and fairy tales come true. Fantasyland is dedicated to the young at heart, to those who believe that when you wish upon a star your dreams do come true. Each Fantasyland has several gentle rides.*
Using the RSI (Relative Strength Index) indicator with a 12 week period (equal to three months, or a quarter of a year), you get some interesting historic results when to buy and sell Bitcoin on a weekly chart with all available Bitstamp data since 2012.
Possible Bitcoin ETF hype:
"The Bitcoin ETFs could be days away and Bitcoin is simply overdue for a massive run." "Barry Silbert of SecondMarket confirmed last month that BIT is still slated for Q4. Not much time left in this Q4."
-- 2 Nov 2014 -- twitter.com
"Barry Silbert, CEO of the Digital Currency Group and founder of SecondMarket and the Bitcoin Investment Trust (BIT), is seeking regulatory approval to open BIT to ordinary investors – moving beyond the wealthy “accredited” investors that are currently the only ones with such access. That approval could come before the end of the year."
-- Nov 3, 2014 -- insidebitcoins.com
"The Bitcoin Investment Trust (BIT) now holds more than 100,000 BTC, according to Barry Silbert, CEO of SecondMarket and founder of the trust. Silbert has big plans for the Bitcoin Investment Trust, which is expected to open for public investors sometime in the fourth quarter of 2014."
-- April 11, 2014 -- www.coindesk.com
*Source:
en.wikipedia.org
P.S. If you like my charts, you can leave me a tip:
1PmAnb2htvHnCbwNAxkV7b8XvVQyQ7LQLg
Thanks!
Bitcoin Winter 2014/2015 Outlook: Important price areas to watchNew version! I looked at all the original information from MtGox which is still available on TradingView and noticed that my last chart using Bitstamp prices and pivot dates wasn't aligned perfectly with the real pivot price data from MtGox (which shaped the price from 2010 until the melt down in 2014).
BTC has still a high risk too fall even more. The pink Gann fan line is now aligned higher than before, above the current price. And I added a three year average price, also in the color pink. As visible in the chart we are already in the red Fibonacci area behind the blue 1.382 Fibonacci trend line.
P.S. If you like my charts, you can leave me a tip:
1PmAnb2htvHnCbwNAxkV7b8XvVQyQ7LQLg
Thanks!

Back to square one in a few weeks-- UPDATE --
This long-term this risk is still there, but as long as we keep on slowly going up (earlier ) since the massive correction down to $275 then this chart scenario posted here is going to be proven invalid.
-----------------
The precise rules of Bitcoin price bubbles vary but it usually involves traders hopping from square to square, missing out the square containing their thrown targets. They go from one to (usually) eight or ten and then back to square one.

Bitcoin price doom analysis: Why Bitcoin might crash to $85-$110BTC could go as low as $250 and even $85-$110 is possible. Here is why:
My original chart which I made one month ago had the title: "Bitcoin price doom analysis - Why Bitcoin might crash to $333"
Sadly BTC is falling even faster than anticipated. BTC is now below a two year moving average price (EMA 720 - the red line) which was at $369! Therefore I'm lowering my most bearish target price from $333 to $100. Everything is possible now. But I hope that BTC bounces at $285-$320
P.S. When I published the chart the price was still higher and I originally wrote: "BTC could go as low as $300-$320"


Bitcoin regulation, huge volatility ahead?A couple of things to watch out for at the moment:
OVERSTOCK CEO PATRICK BYRNE PROMISES “INTERESTING ANNOUNCEMENTS” AT LAS VEGAS BITCOIN CONFERENCE
insidebitcoins.com
NEW YORK (InsideBitcoins) — Promising some “interesting announcements” regarding Bitcoin on Twitter (see below), Patrick Byrne, CEO of Overstock.com, will deliver the final keynote for the Inside Bitcoins Conference and Expo in Las Vegas at the Flamingo Hotel on October 5-7, 2014.
CFTC’s Global Markets Advisory Committee to Meet
www.cftc.gov
www.cftc.gov
"The meeting will focus on issues related to clearing Non-Deliverable Forwards (NDFs) and the digital currency bitcoin. The meeting will consist of two panels. The first panel will discuss whether a clearing mandate is appropriate for NDFs, with a particular focus on how such a mandate would impact foreign exchange contracts. The second panel will discuss CFTC’s jurisdiction with respect to derivatives contracts that reference the digital currency bitcoin."
New York State Department of Financial Services (NYDFS) superintendent Benjamin Lawsky is to deliver a keynote speech at Money20/20:
www.coindesk.com
"New York State Department of Financial Services (NYDFS) superintendent Benjamin Lawsky is to deliver a keynote speech at Money20/20, which bills itself as the world’s largest event for payments and financial services innovation. "
European Commissioner-Designate to Discuss Bitcoin at EU Hearing
www.coindesk.com
---------
Depending on the outcome of these meetups, keynotes & events ahead, it is almost certainly one that will have huge effect on the price in the coming months. The last time it happened was on October 2013 which resulted in the rally towards $1000.
ETF: www.bloomberg.com
www.sec.gov

Future of BitcoinFibonacci numbers (blue vertical lines) and ratios (purple) applied on time.
In case of failure, we break 450, and should expect 260 (last bubbles top)
If we keep climbing up and break top resistance expect rally up to 3000 - 4000.
Infact targets like 10k for the next bubble are unreasonable.
The next bubble will be more like a last breath of the bulls,
before a major correction to around 440 (current bottom level).
A major correction is needed to balance out the
bearish divergence of the last bubble (see weekly RSI etc.)
Only then we will find ourself in a more modest uptrend with
next bubble peaking around 18k at fib number 8 at beginning of 2017.

The easiest way to decide to buy or sell BitcoinThis Gann fan is hitting so many pivot price points (marked in blue rectangles) that it seems to be worth watching the coming weeks.
It makes forecasting easy. Either we stay above the 9/1 Gann fan which started in Summer 2013 and slowly start a new uptrend in Winter 2014 - or the price falls much much lower.

Predicting the next Bitcoin bubble with Stoch RSI and DMI StochObviously the Bitcoin price is currently in oversold territory - meaning the price can still sink a few US Dollar lower, but the price dive shouldn't be as dramatic anymore like it was from $683 to $442 or previously from $1163 to $339.
Using two Fibonacci Time Zones interestingly the Coppock curve might reach a low area where the second Fib Time Zone (which started in Summer 2013 at the $63 pivot point) indicates a reversal point on September 14, 2014 (time zone line no. 3). The Directional Movement Index Stochastic and the Directional Movement Index Stochastic Extreme indicators both currently signal a buy cross during the time this chart was published (price at chart creation was $475).
P.S. The DMI Stochastic was adapted for TradingView by user TheLark () and user ucsgears changed it to the Extreme version ()

Predicting the next Bitcoin bubble with Fibonacci time zonesUsing Fibonacci time zones it is possible that the peak of the next Bitcoin bubble might occur after Fall 2014 and before Spring of 2015. The Gann fan shows that in order to make this forecast come true the price needs to start increasing by November 2014.
"Fibonacci Time Zones are vertical lines based on the Fibonacci Sequence. These lines extend along the X axis (date axis) as a mechanism to forecast reversals based on elapsed time. A major low or high is often chosen as the starting point. Distances start relatively small and grow as the Fibonacci Sequence extends. Chartists can extend the Fibonacci Time Zones into the future to anticipate potential reversal points."
stockcharts.com
The red line is the cumulative Elastic Volume Weighted Moving Average (eVWMA). Which is "a statistical measure using the volume to define the period of the moving average. The eVWMA can be looked at as an approximation to the average price paid per Bitcoin. It can be approximated using cumulative sum of volume (...)"

Bitcoin price prediction for Winter 2014Obviously, Bitcoin's price is still inside a uptrend channel. Accumulation is increasing so far, too.
Please also take a look at my other related chart. I forgot to add it as link:

Bitcoin price doom analysis - Why Bitcoin might crash to $333Huge risk that Bitcoin falls much lower than $450.
Here is the past value increase trading range and resulting future value decrease possibility in this Bitcoin price channel.
Look at the "related ideas" to find more bearish ideas in my previous charts, especially this one:

A new Bitcoin bull market - or the beginning of the endBitcoin is at the crossroads - again. Are we finally staying on this level above 550 US Dollar and slowly going up again. Or is this just the start of a much larger downtrend?
At least the accumulation/distribution indicator is showing an uptrend and the Keltner channel and weighted moving average shows we might get stable and could still bounce - before we face a multiple month long downtrend. I'm still very skeptic based on most other indicators.
Fun fact: We are now 1088 days away from the first Bitstamp BTC price chart data since 2011-08-19 and today is 2014-08-12.

The real reason Bitcoin is doomed in Summer 2014It’s been a happy couple of weeks in May, June and July 2014 for Bitcoin enthusiasts like me. Sadly we didn't break out of the overall downtrend since falling from around 1200 US Dollar per Bitcoin in December 2013 so far.
I was very enthusiastic in June 2014 that the yearly price increase pattern (bubble) repeats very soon. But 600 US Dollar is only the 50% retracement from the last all-time-high, which opens the risk possibility that the BTC price goes lower than the 0.5 retracement in the coming weeks. The recent move from 560 US Dollar to 607 US Dollar (Bitstamp price) was a bull trap and will therefore turn out as a dead cat bounce on the way down (UPDATE: The price has already fallen from 592 down to 585 since I published this chart 4 hours ago).
The Stoch RSI indicator already shows the beginning of a larger downtrend. Lacking bull power, if the Bitcoin price doesn't break out above 700 US Dollar that would mean that the price is in a position to continue the downtrend in the summer. And if Bitcoin stays below 600 US Dollar (current price is around 590 US Dollar) then I expect the price to test the last support area, which is around 400 US Dollar (maybe we bounce of 425 US Dollar or 450 US Dollar). If you need another reason for the current downtrend then check the volume. Here is an example by TerryKinder:
The next Fibonacci retracement at 0.618 (61.8%) would mean the BTC price visits 500 US Dollar again. The following lower Fibonacci retracement at 0.764 (76.4%) would bring very critical Bitcoin price support at 350 US Dollar. My analysis is based on many indicators besides the Stoch RSI, maybe I will post all the other signals I found so far as updates in the comments of this chart. However the Stoch RSI alone is very reliable in the weekly chart. I once made a comparison for myself with the MACD vs StochRSI and I would have made much more money (around double the amount) using only the Stoch RSI as indicator in the weekly chart to determine entry and exit since 2012 than if I had used only the MACD.
Bullish outlook: If the price goes only down to 500 US Dollar and some very good news brings in much more new Bitcoin users - in that case the downtrend might reverse into a uptrend. Based on the (hypothetical) very good news we could see a new Bitcoin price rally, when we finally break the resistance at 700 US Dollar. That uptrend would then bring us back to test 1000 US Dollar. But we are not there yet. First the price has to clean up in the Summer the overall downtrend from the last all-time-high at 1200 US Dollar.
I created this chart as response to the bullish chart created by ItisCalvin: Make sure to visit "related ideas" (see below) where I added my last downtrend corresponding charts.
---------
"The point about a prediction is not that it’s true. A prediction is either a warning or a hope. Predictions should never claim to be true. But you can claim they are possibilities that there is something you ought to think about.” - Freeman Dyson

Best Bitcoin Price Chart - 2012 to 2014Seeing is believing. The Fibonacci circle clearly shows that we are at a new pivot point in July 2014. We are entering a new phase. It's the second chart that shows this. Here is another one:
The next direction depends on if Bitcoin can stay above the 200 day moving average (new uptrend) or if we fall below this critical area (downtrend).
Price in USD in logarithmic scale.
