Future

BTC LONG BTC LONG
entry : 19886.6
tp1) 21119.7
tp2) 21601.8
tp3) 22417.7
tp4) 22974.0
stop loss : 18983.8
lev : 5x - 3x

BTC SHORT SETUP #BTC/USDT
#SHORT
ENTRY PRICE:
1)20635
TARGET:
1)20231
2)20017
3)19811
4)19605
STOP LOSS: 20979
Risk only 3 percentage of your balance

BNB LONG SETUP #BNB/USDT
future
lev 10x
entry 294.9
TP1 298.60
TP2 301.65
TP3 304.55
TP4 307.45
SL : 291
SL 2 : 285.7


Wave USDT longFirst and second phase of Waves prediction is complete 30% up from given entry prediction going smoothly 🎉😉
Hoping some correction and then completion of 3rd phase

BTC / USDT HTF (Monthly - Weekly - Daily) S/R levelsBTC / USDT HTF (Monthly - Weekly - Daily) S/R levels
* Purple: Monthly
* Green: Weekly
* Red: Daily
* Full: Level that should hold the move up / down
* Striped: Level that is targeted to break. If broken, a reversal is expected
* Dotted: General S/R level // Break level that got broken 'clean' (S/R flip)
* 0.5 Levels: 50% of imbalance

BTC Peredicthere is what i think about btc in near future
it is not signal , it is just what i think
after a bearish impulse we have correction
then another impulse
like and comment below for more perdication

Bitcoin next move we still located in a horziontal phase i see its so near for exploding to 31K before re-testing all supports over 20K even the depth
Important Note:
following up candles closures only

BTC BIG B A L L SHere's what btc looks like in 2 months
money flow will be alive again after covid disappeared !
ww3 is a scam
manipulation has hands on everything
big fishes want more money
2024 can"t stay broke
cash flow need to comeback ASAP for economic reasons
GL

BTC 2022 to 2023 developmentIf BTC succeed to fix itself on 17k - 18k then there is a chance to see it grow further to 70k
if 17k resistance is broken we can see it dump to 10k-14k

UBER to $75 per share Hoping for price to dip to $10-$13 per share - long term upside targets of $50, $75, then $100-$120

Hive Cycle picture of Hive. No Ideas I just need words on here so I can post! Ugh, Minimum Characters!

WAVESUSD is seeking for opportunity Decentralized exchange, Conditional Trustless transactions, Replace traditional contracts between parties, Build Decentralized applications Trustless transactions between parties, Freedom of payments, Counterfeiting impossible, Fraud resistant, No single point of failure, No % based transfer costs, token issuance.
Resistance area 8.88
Target : $9.767- $9.978
Stoploss : $7.106

RVN is crosses down RSI trendlineRVN /USDT is GET the good setup for SHORT POSITION by RSI crosses down bullish trendline
you can get this position with LEV8 X
Good Luck & dont forget to set SL & TP

frac 1 2 3 4 DUKE 2022
Chart to show basic fractal breakouts over 1.5 years and 3x 4.5 years .
Hunch

Volatility 19 May 22 S&P500 and Nasdaq Index and ETF's ES SP500 Future 19 May 2022
Based on the HV measures from the last year candles our expected volatility for today is around 1.97%
However, in order to increase our accuracy I am going to use a 1.25x multiplier => 2.46%
This is translated into a movement from the current opening point of 95.32
With this information our top and bottom , with close to 84% probability for today are going to be
TOP 4013
BOT 3820
SPY 19 May 2022
Based on the HV measures from the last year candles our expected volatility for today is around 1.68%
However, in order to increase our accuracy I am going to use a 1.25x multiplier => 2.11%
This is translated into a movement from the current opening point of 6.6
With this information our top and bottom , with close to 88% probability for today are going to be
The calculations are in general made with the open daily candle. Since we dont have one currently, you can wait for the open candle
and add or rest 6.6 points to that in order to get the top/bottom channel
SPY SP500 ETF 19 May 2022
Based on the HV measures from the last year candles our expected volatility for today is around 1.68%
However, in order to increase our accuracy I am going to use a 1.25x multiplier => 2.11%
This is translated into a movement from the current opening point of 82.61
With this information our top and bottom , with close to 86% probability for today are going to be
The calculations are in general made with the open daily candle. Since we dont have one currently, you can wait for the open candle
and add or rest 82.61 points to that in order to get the top/bottom channel
QQQ Nasdaq ETF 19 May 2022
The current 2022 Volatility for NDX/NQ/QQQ is much higher and abnormal than the previous years.
For that as a precation I am going to take the initial base as a 1.25x multiplier .
Based on the HV measures from the last year candles our expected volatility for today is around 2.67%
However, in order to increase our accuracy I am going to use a 1.5x multiplier => 3.2%
This is translated into a movement from the current opening point of 9.32
With this information our top and bottom , with close to 90.5% probability for today are going to be
The calculations are in general made with the open daily candle. Since we dont have one currently, you can wait for the open candle
and add or rest 9.32 points to that in order to get the top/bottom channel
NQ Nasdaq Future 19 May 2022
The current 2022 Volatility for NDX/NQ/QQQ is much higher and abnormal than the previous years.
For that as a precation I am going to take the initial base as a 1.25x multiplier .
Based on the HV measures from the last year candles our expected volatility for today is around 2.67%
However, in order to increase our accuracy I am going to use a 1.5x multiplier => 3.2%
This is translated into a movement from the current opening point of 376.75
With this information our top and bottom , with close to 88.5% probability for today are going to be
TOP 12288
BOT 12224

GOLD CHART MCX (1 DAY) (DESCENDING TRIANGLE Pattern)Like share and follow our Trading idea.
Gold chart Descending triangle pattern
Ready for fall darling!

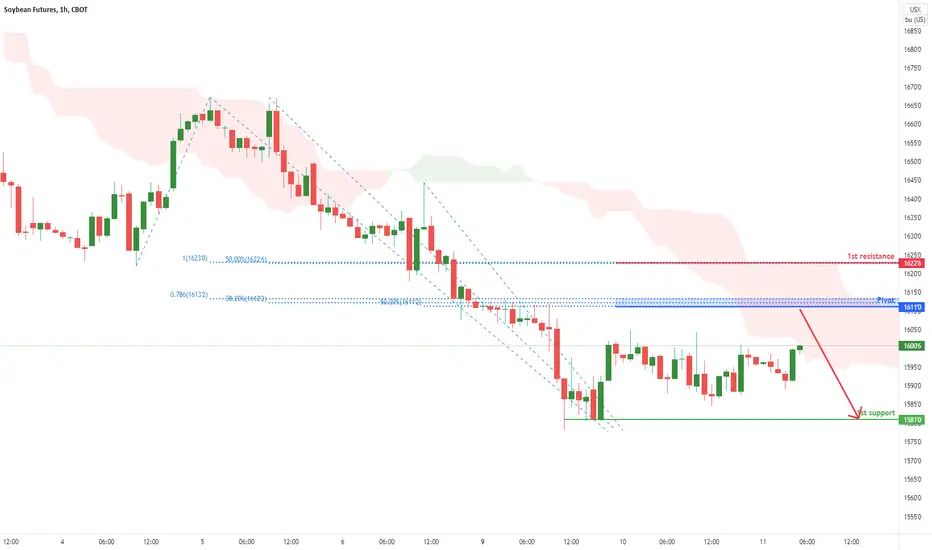
Soy beans Futures ( ZS1! ), H1 Potential for Bearish ContinuatioType : Bearish Continuation
Resistance : 1622'6
Pivot: 1611'2
Support : 1581'0
Preferred Case: With price expected to reverse off the ichimoku resistance and Fibonacci confluence area, we have a bearish bias that price will drop to our 1st support in line with the horizontal swing low support from our pivot of 1611'0 in line with the Fibonacci confluence area.
Alternative scenario: Alternatively, price may break pivot structure and head for 1st resistance in line with the 50% Fibonacci retracement and 100% Fibonacci projection.
Fundamentals: No Major News
No way for BTCYes guys, as I said yesterday after breaking 34200 we will go to 29-30k which already happened in a day and retested that area ad finally bounce started a little bit but we can affirm it if we break resistance and close at least 2 times 4 hours candles above it. After this we can think about long positions. But if you are working with spot trading you should buy BTC in every drop but little little because we don't know where we are going to. For now, first target is 34200. Thanks.
