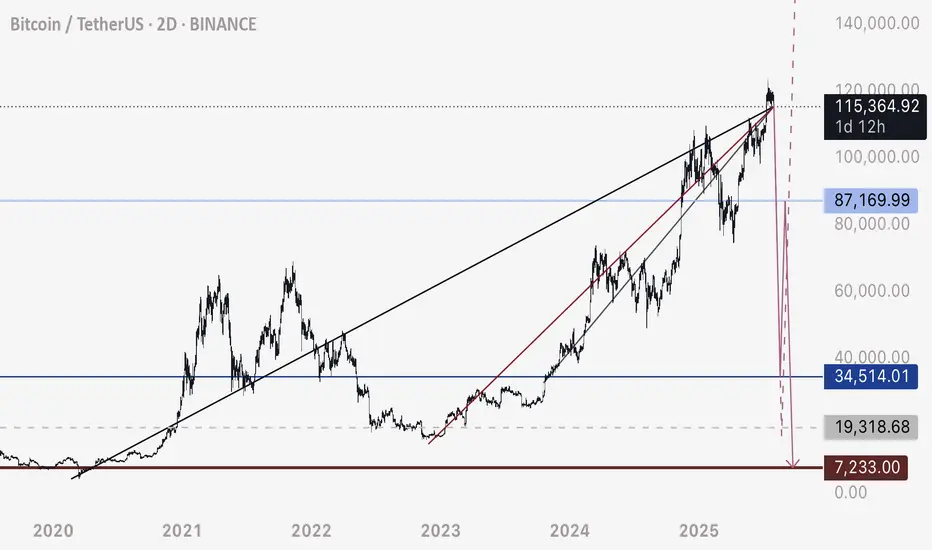
BTC - Not the End of the DropRather the beginning. Bitcoin has fallen below this bearish intersection. Anticipating price to fall rapidly on one of these two pathways to the Uber low liquidity levels.
DXY is retesting a major bearish breakdown - this is the conduit that will justify a flash crash of this magnitude prior to a 3-5 year bull run.
Happy trading.
Futures
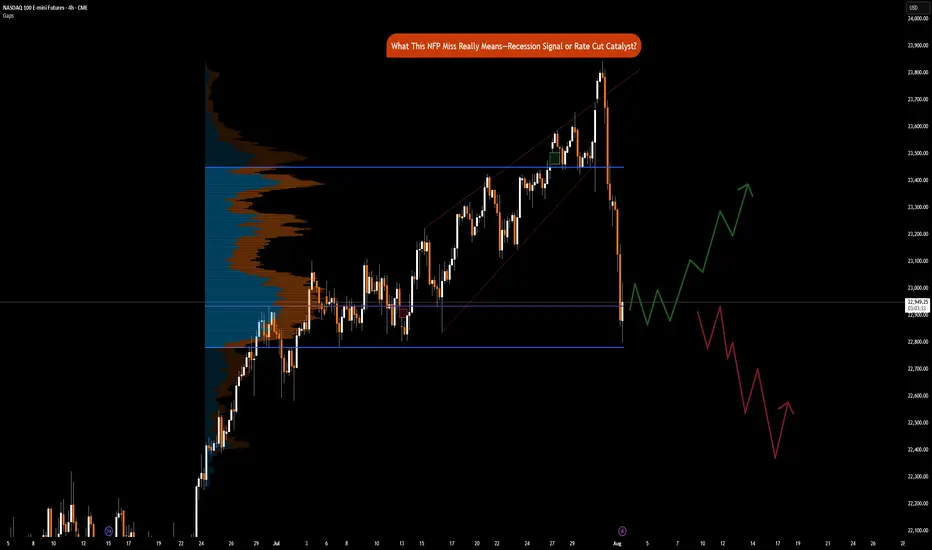
NFP Miss Implications: Recession Signal or Rate Cut CatalystCME_MINI:NQ1! CME_MINI:ES1! CME_MINI:MNQ1!
Happy Friday, folks!
Today is the first Friday of August, and that means the highly anticipated Non-Farm Payroll (NFP) numbers came in at 7.30 am CT.
US Non-Farm Payrolls (Jul) 73.0k vs. Exp. 110.0k (Prev. 147.0k, Rev. 14k); two-month net revisions: -258k (prev. +16k).
Other key labor market indicators were as follows:
• US Unemployment Rate (Jul) 4.2% vs. Exp. 4.2% (Prev. 4.1%)
• US Average Earnings MM (Jul) 0.3% vs. Exp. 0.3% (Prev. 0.2%)
• US Average Earnings YY (Jul) 3.9% vs. Exp. 3.8% (Prev. 3.7%, Rev. 3.8%)
• US Labor Force Particle (Jul) 62.2% (Prev. 62.3%)
Data and Key Events Recap:
What a year this week has been! It's been packed with high-impact economic data and pivotal central bank decisions, especially from the Federal Reserve. On top of that, trade and tariff announcements have dominated the headline.
U.S. economic data this week was broadly strong. Second-quarter GDP came in at 3.0%, beating expectations and signaling solid growth. The ADP employment report also surprised to the upside, printing 104K vs. the 77K forecast. Consumer confidence showed resilience as well, with the Conference Board’s reading rising to 97.2.
Inflation data was mixed but mostly in line. Core PCE for June rose 0.3% MoM, while the YoY reading ticked up to 2.8%, slightly above the expected 2.7%. The broader PCE Price Index also came in at 0.3% MoM, with a YoY print of 2.6%, slightly higher than forecast.
The Federal Open Market Committee (FOMC) voted to keep the federal funds rate target range unchanged at 4.25% – 4.50%. Notably, Governors Waller and Bowman dissented, favoring a 25-basis-point rate cut as expected, however, marking the first dual dissent by governors since 1993.
Changes to the FOMC Statement included a downgraded assessment of economic growth, reflecting slower real consumer spending. The Committee reiterated that uncertainty around the economic outlook remains elevated. It maintained its view of the labor market as "solid" and inflation as "somewhat elevated." Forward guidance remained unchanged, emphasizing the Fed’s readiness to adjust policy as necessary while continuing to monitor risks to both sides of its dual mandate.
Here’s a summary of key points from the FOMC press conference:
• On current policy stance:
“We decided to leave our policy rate where it’s been, which I would characterize as modestly restrictive. Inflation is running a bit above 2%... even excluding tariff effects. The labor market is solid, financial conditions are accommodative, and the economy is not performing as if restrictive policy is holding it back.”
Chair Powell commented on the need to see more data to help inform Fed’s assessment of the balance of risks and appropriate Fed Funds rate.
• On labor market risks:
“By many statistics, the labor market is still in balance... You do see a slowing in job creation, but also a slowing in the supply of workers. That’s why the unemployment rate has remained roughly stable.”
• On inflation and tariffs:
“It’s possible that tariff-related inflationary effects could be short-lived, but they may also prove persistent. We’re seeing substantial tariff revenue—around $30 billion a month—starting to show up in consumer prices. Companies intend to pass it on to consumers, but many may not be able to. We’ll need to watch and learn how this unfolds over time.”
Trade Headlines:
US President Trump announced tariffs on countries ranging from 10%-41%. Average US tariff rate now at 15.2% (prev. 13.3%; 2.3% pre-Trump), according to Bloomberg. US officials said that if the US has a surplus with a country, the tariff rate is 10% and small deficit nations have a 15% tariff, US officials said they are still working out technicalities of rules of origin terms for transshipment and will implement rules of origin details in the coming weeks. No details on Russian oil import penalty. Sectoral Tariffs White House said new reciprocal tariff rates take effect on Friday. Although Canada’s tariffs were increased to 35%, excluding USMCA goods, the effective rate is only 5%.
The economic data is showing strength, on the contrary, tariffs announcements for most countries have now been announced. Investors need to consider that tariffs are not just a tool to reduce trade deficit, it is also a geopolitical tool presently being used to shape alliances. The US wants to soften BRICS, China and Russian influence on the world stage.
Key to note is that these tariffs are substantially lower than what was announced on April 2nd, 2025.
The key question now remains, do participants buy the dip or ‘sell the fact’ is the current playbook?
Market Implications
Given the prior revisions in NFP data of -258K, July’s payroll came in at 73K, missing forecasts of 110K. What does this mean for markets? Markets are now pricing in 75% chance of a September rate cut. Prior revisions along with the current job market slowing down imply that risks to the downside are substantially increasing. Fed’s current policy is not just moderately restrictive but rather it may likely tip the US into a recession if Fed Funds rates remain elevated. The Chair asked to see more data, and here it is but I do wonder why they did not take this data into account for the July meeting. Surely, it would have been available to them.
Another question to ask would be, is it due to defiance of rate cut calls by the US administration? Is the Fed already behind the curve?
Fed’s dual mandate targets inflation and maximum employment. While inflation is sticky, the Fed may need to abandon their 2% mandate in favor of average inflation of 2.5% to 3%. A less restrictive policy will provide needed stimulus along with the fiscal stimulus provided via the BBB bill.
This drastically changes, in our analysis, how investors position themselves heading into the remainder of the year.
Markets (equities) may retrace slightly but the dip in our opinion will still be the play given weaker labor market data and increased rate cut bets. The bad news here means that the Fed has the data it wants to see to start cutting. Market pricing in 2 cuts seems to be the way forward for now.
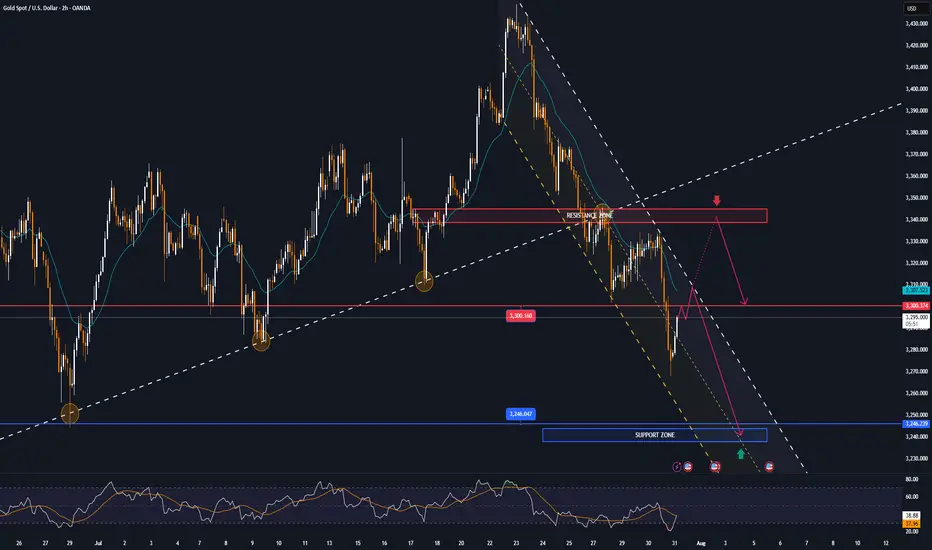
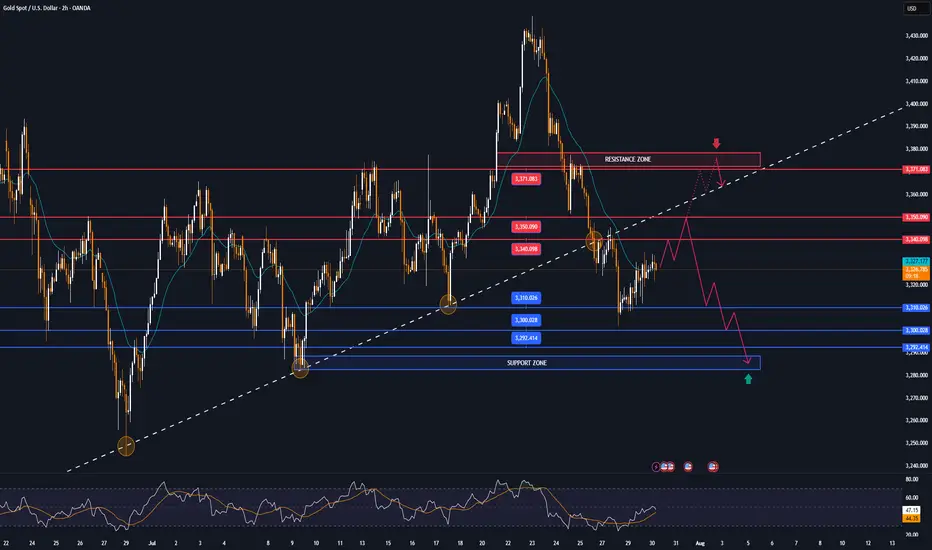
GOLD falls sharply, fundamental analysis and technical positionOANDA:XAUUSD fell sharply below the $3,300/oz price level as Chairman Jerome Powell did not signal any rate cuts at his next press conference on September 16-17. He only said that “no decision has been made on September” and that “more data will be evaluated in the coming months.” Economic data undermined the case for a rate cut, while geopolitical play remained a potential support.
The Fed and Interest Rates
The Federal Reserve kept interest rates unchanged for a fifth straight meeting on Wednesday, defying persistent pressure from President Donald Trump and White House officials.
However, two members of the central bank's board dissented, a rare move in three decades that underscored growing divisions within the central bank over the impact of Trump's tariff policies.
At the meeting, the Fed kept its benchmark federal funds rate in a range of 4.25% to 4.5%, in line with policy through 2025. Last fall, the Fed cut rates by a total of 100 basis points.
However, Federal Reserve Board Governors Christopher Waller and Michelle Bowman opposed cutting interest rates by another 25 basis points, marking the first time since Alan Greenspan in 1993 that two board members have opposed a majority resolution at a meeting.
At the press conference, Chairman Jerome Powell did not signal a rate cut at the next interest rate meeting on September 16-17, saying only that “no decision has been made about September” and that “more data will be evaluated in the coming months.” Powell also noted that despite Trump’s call for a sharp 3% rate cut to reduce interest costs on US debt and stimulate the housing market, the Fed will continue to monitor the longer-term impact of tariffs on the path of inflation and economic recovery.
Market expectations for a Fed rate cut in September fell to 47% in Powell's speech.
Economic data
ADP jobs data beats expectations and is bearish
US ADP payrolls jumped 104,000 in July, beating market expectations of 75,000 and marking the biggest gain since March. The data showed continued strength in the labor market, reinforcing the Federal Reserve’s stance on keeping interest rates high. Meanwhile, the preliminary estimate of annual GDP growth in the second quarter came in at 3% (2.4% expected), and the core personal consumption expenditures price index rose 2.5% year-on-year (2.3% expected), indicating both economic resilience and inflation stability, further weakening expectations for a rate cut.
Keep an eye on the ISM manufacturing PMI and non-farm payrolls data on August 1. If the jobs numbers continue to be strong, this could reinforce the Fed’s dovish stance.
Geopolitical and Policy Plays
News of a 90-day extension of the US-China tariff deal has eased some safe-haven demand, but Trump’s August 8 deadline for a new Russia-Ukraine deal, coupled with tensions in the Middle East, continue to provide potential support for gold.
Continued purchases by central banks (such as China and India) are a positive signal in the medium to long term, but are unlikely to offset short-term pressure from the Federal Reserve’s policies.
Technical outlook for OANDA:XAUUSD
On the daily chart, gold has been sold below the $3,300 level and now the $3,300 level has become the nearest resistance at present. For now, gold will be limited by the area of the 0.382% Fibonacci retracement with the original price point of $3,300, along with that it has formed a short-term downtrend with the price channel, the next target will be around $3,246 in the short term followed by the Fibonacci retracement level noted with readers in previous publications.
On the momentum front, the Relative Strength Index is operating below 50 and is far from the oversold zone (20-0), indicating that there is still plenty of room for downside ahead.
In addition, the gold trend will also be pressured by the EMA21, as long as gold remains below the EMA21, the current technical conditions continue to favor the downside.
For the day, the technical outlook for gold is bearish with notable positions listed as follows.
Support: 3,246 – 3,228 USD
Resistance: 3,300 USD
SELL XAUUSD PRICE 3345 - 3343⚡️
↠↠ Stop Loss 3349
→Take Profit 1 3337
↨
→Take Profit 2 3331
BUY XAUUSD PRICE 3240 - 3242⚡️
↠↠ Stop Loss 3236
→Take Profit 1 3248
↨
→Take Profit 2 3254
How to Use Engulfing Candles in TradingViewEngulfing patterns are among the most powerful candlestick formations because they signal strong momentum shifts and can help you spot dramatic trend reversal opportunities.
What You'll Learn:
• How to identify valid engulfing formations where one candle completely covers another's body
• The two types: bullish engulfing (green candle engulfs red) and bearish engulfing (red candle engulfs green)
• Psychology behind engulfing patterns: when one side completely overwhelms the other
• Using volume analysis to confirm engulfing pattern validity
• Finding meaningful engulfing patterns at trend highs and lows for reversal setups
• Timeframe considerations for engulfing analysis on any chart period
• Step-by-step trading strategy for engulfing reversal setups
• Setting proper stop losses above engulfing candle highs
• Determining profit targets below engulfing candle lows
• Managing wide-range drawdowns common with strong momentum shifts
• Advanced entry technique: waiting for retracements to improve risk-reward ratios
This tutorial may help futures traders and technical analysts who want to use powerful candlestick patterns to identify significant momentum changes.
The strategies covered could assist you in creating effective reversal setups when strong buying or selling pressure appears at key price levels.
Learn more about futures trading with Tradingview: optimusfutures.com
Disclaimer:
There is a substantial risk of loss in futures trading. Past performance is not indicative of future results. Please trade only with risk capital. We are not responsible for any third-party links, comments, or content shared on TradingView. Any opinions, links, or messages posted by users on TradingView do not represent our views or recommendations. Please exercise your own judgment and due diligence when engaging with any external content or user commentary.
This video represents the opinion of Optimus Futures and is intended for educational purposes only. Chart interpretations are presented solely to illustrate objective technical concepts and should not be viewed as predictive of future market behavior. In our opinion, charts are analytical tools—not forecasting instruments. Market conditions are constantly evolving, and all trading decisions should be made independently, with careful consideration of individual risk tolerance and financial objectives.

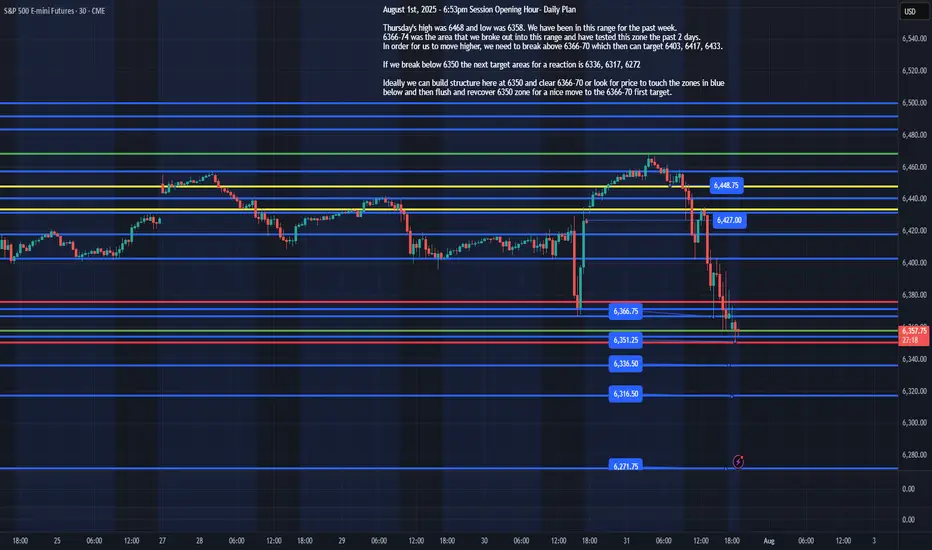
ES - August 1st, 2025 - Session Opening HourAugust 1st, 2025 - 6:53pm Session Opening Hour- Daily Plan
Thursday's high was 6468 and low was 6358. We have been in this range for the past week.
6366-74 was the area that we broke out into this range and have tested this zone the past 2 days.
In order for us to move higher, we need to break above 6366-70 which then can target 6403, 6417, 6433.
If we break below 6350 the next target areas for a reaction is 6336, 6317, 6272
Ideally, we can build structure here at 6350 and clear 6366-70 or look for price to touch the zones in blue below and then flush and recover 6350 zone for a nice move to the 6366-70 first target.
I will update the plan based on overnight price action by 8am EST, Friday August 1st, 2025
What a turnaround on copper futuresManipulation? Smells like it, but of course, this is just the market we are currently living in.
Let's dig in.
MARKETSCOM:COPPER
COMEX:HG1!
Let us know what you think in the comments below.
Thank you.
75.2% of retail investor accounts lose money when trading CFDs with this provider. You should consider whether you understand how CFDs work and whether you can afford to take the high risk of losing your money. Past performance is not necessarily indicative of future results. The value of investments may fall as well as rise and the investor may not get back the amount initially invested. This content is not intended for nor applicable to residents of the UK. Cryptocurrency CFDs and spread bets are restricted in the UK for all retail clients.

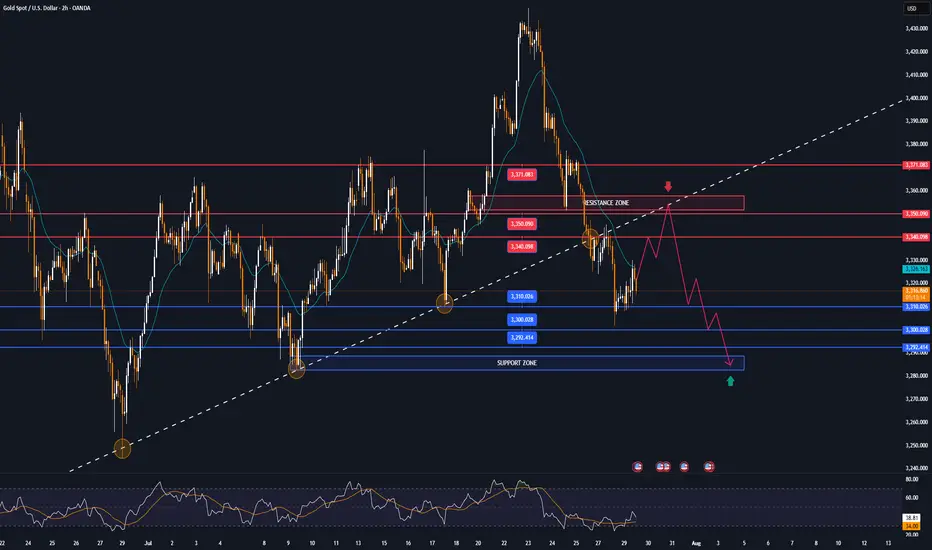
GOLD recovers after many days of declineOANDA:XAUUSD has recovered after several days of declines. Investors will focus on the Federal Reserve's interest rate decision on Wednesday, which is expected to cause significant market volatility.
Gold hit a three-week low of $3,301 an ounce on Monday, before recovering somewhat on Tuesday after falling for a fourth straight day as the dollar erased some of its earlier gains, boosting demand for the precious metal.
Falling US Treasury yields and a weak US jobs report also prompted investors to buy gold.
Data released by the U.S. Labor Department on Tuesday showed the number of jobs added fell in June after two straight months of gains.
The number of jobs added in June fell to 7.44 million from a revised 7.71 million in May. The median forecast of economists in a survey was 7.5 million.
Focus on the Federal Reserve's decision
The Federal Reserve will announce its interest rate decision at 01:00 IST on Thursday; Federal Reserve Chairman Powell will hold a press conference on monetary policy at 01:30 IST on the same day.
The market generally expects the Federal Reserve to keep interest rates unchanged, with the focus on whether Fed Chairman Powell's speech will provide any clues about the timing or pace of future rate cuts.
The market sees a very low chance of a rate cut in July and a roughly 40% chance of another rate cut in September, up from about 10% last month, according to the Chicago Mercantile Exchange's FedWatch tool. Investors will be closely watching the statement and Fed Chairman Powell's remarks at his post-meeting press conference for fresh clues on the timing of the next rate cut.
- If Powell opens the door to a rate cut in September, citing the recent trade deal as a reason to ease uncertainty, US Treasury yields could fall immediately, paving the way for gold prices to rise.
- On the other hand, if Powell avoids committing to a rate cut at this meeting, citing recent rising inflation data, gold prices could fall.
Gold typically performs well in low-interest-rate environments because it does not pay interest and its appeal increases when returns from other assets decline.
Technical Outlook Analysis OANDA:XAUUSD
Gold has recovered from the key $3,300 price point and is holding above $3,310, which is also the nearest support. However, the current recovery is not technically enough to create a short-term uptrend, or conditions for a sustained price increase. In terms of position, gold is under pressure with the 21-day EMA as the nearest resistance at around $3,340 – $3,350. If gold falls below the 0.382% Fibonacci retracement level, it will be eligible to open a new downtrend with a target of around $3,246 in the short term, more than the 0.50% Fibonacci retracement level.
On the other hand, RSI is below 50, and the current 50 level acts as momentum resistance in the short term. If RSI slopes down, it will signal bearish momentum with more downside ahead. For gold to qualify for bullish expectations, it needs to at least push price action above EMA21, then retrace back to the price channels and finally break above the 0.236% Fibonacci retracement level to confirm bullish conditions. The upside target could be towards $3,400 in the short term, more like $3,430 – $3,450.
For the day, the technical outlook for gold prices tends to lean more towards the downside, with the following notable points listed.
Support: 3,310 – 3,300 – 3,292 USD
Resistance: 3,340 – 3,350 – 3,371 USD
SELL XAUUSD PRICE 3376 - 3374⚡️
↠↠ Stop Loss 3380
→Take Profit 1 3368
↨
→Take Profit 2 3362
BUY XAUUSD PRICE 3280 - 3282⚡️
↠↠ Stop Loss 3276
→Take Profit 1 3288
↨
→Take Profit 2 3294
US100/NQ short idea PM session I expect yesterdays high to hold. For NQ reaching a discount, a 400 point move can happen. WATCH A 5m FVG formation for entry

GOLD trades in narrow range after 4 sessions of sharp declineOn Tuesday (July 29), in the Asian market, the spot OANDA:XAUUSD traded in a narrow range after yesterday's sharp decline, and the current gold price is around 3,315 USD/ounce.
The OANDA:XAUUSD fell to its lowest level in nearly 3 weeks on Monday, mainly due to the trade agreement reached between the United States and the European Union over the weekend, which boosted the Dollar and risk sentiment.
The previous report released by the US Bureau of Labor Statistics showed that the number of US JOLTS jobs unexpectedly increased in May, reaching the highest level since November last year.
The number of JOLTS job vacancies in the US in May was 7.769 million, far exceeding the forecast of all economists surveyed.
Looking back at the data in April, the number of JOLTS job vacancies also showed an unexpected increase.
The JOLTS jobs report is a closely watched labor market data by the Federal Reserve.
In addition, the Conference Board of America's Consumer Confidence Index for July is scheduled to be released on the same day and is expected to be 95.8, compared to the previous value of 93.0.
The fundamental pressure that gold is under
OANDA:XAUUSD came under pressure yesterday and fell to a near three-week low, mainly due to the trade deal between the United States and the European Union (EU) over the weekend, which boosted the Dollar and risk sentiment. Moreover, US President Trump announced “global tariffs” of 15% to 20% on most countries, a change from his previous statement last week.
The deal reached by U.S. President Donald Trump and the European Union late last week will impose a 15% tariff on EU goods, half the rate Trump had threatened, easing fears of a wider trade war.
The U.S. and Japan also reached a deal last week, and U.S. and Chinese officials resumed talks in Stockholm, Sweden, this week with the goal of extending the tariff deadline by 90 days.
Technical Outlook Analysis OANDA:XAUUSD
Gold has been on a four-day losing streak, a decline that threatens bullish expectations as its current position gradually deprives it of any room for further upside.
Specifically, gold has recovered from the psychological level of $3,300 but the actual recovery is not significant, while it is under pressure from the EMA21 which is currently the closest resistance.
On the other hand, gold has fallen below both the long-term and short-term trend channels. If it continues to sell below the 0.382% Fibonacci retracement level, this will confirm a break below the psychological level of $3,300, then the downside target will be around $3,246 in the short term, rather than $3,228.
RSI is pointing down, below 50 and still far from the 20-0 area, also showing that in terms of momentum, gold is also under pressure and there is still a lot of room for decline ahead.
For gold to be eligible for an increase, it needs to at least bring price activity back above the EMA21, back inside the price channels. On the current daily chart, the technical conditions are more inclined towards the possibility of a decrease.
Notable positions will be listed as follows.
Support: 3,310 - 3,300 - 3,292 USD
Resistance: 3,340 - 3,350 - 3,371 USD
SELL XAUUSD PRICE 3355 - 3353⚡️
↠↠ Stop Loss 3359
→Take Profit 1 3347
↨
→Take Profit 2 3341
BUY XAUUSD PRICE 3285 - 3287⚡️
↠↠ Stop Loss 3281
→Take Profit 1 3293
↨
→Take Profit 2 3299
GOLD falls on USD and trade talks, big data weekSpot OANDA:XAUUSD ended its rally this week on Friday (July 25) and closed down nearly 1%, mainly affected by the recovery of the US Dollar TVC:DXY and progress in trade negotiations that weakened safe-haven demand.
DXY recovered 0.27% on Friday to close at 97.642, ending a two-week low, making gold less attractive than its direct correlation.
Earlier, news of a US-Japan trade deal and a breakthrough in US-EU talks weakened the market's demand for safe-haven assets.
For the content of the US-Japan trade deal, readers can review it in the daily publications during the past trading week.
Data and Fed Expectations
The latest US jobless claims fell to a three-month low, suggesting the job market remains solid. This gives the Federal Reserve reason to maintain interest rates at 4.25%-4.50%, despite President Trump once again pressuring Powell to cut rates.
However, in the short term, the fundamental direction of gold may need to wait for the Federal Reserve to announce more policy signals at its meeting next week.
Speculative Longs Hit High Near April Peak
Data from the U.S. Commodity Futures Trading Commission (CFTC) showed that as of the week of July 22, the speculative net long position in COMEX gold rose by 27,211 lots to 170,868 lots, the highest level since April. This shows that as gold prices fall again, buyers are still actively deploying, waiting for more guidance from policy and data.
Last Week Review and This Week’s Fundamental Outlook
Last week, gold prices initially rose and then fell. Due to risk aversion and volatility in the US dollar, gold prices surpassed the $3,400/ounce mark at the start of the week, but as trade optimism increased and profit-taking emerged, gold prices fell back, trying to stay above $3,300/ounce.
Investors will face several major events this week:
Federal Reserve policy meeting (Wednesday): Markets expect interest rates to remain unchanged, but Powell’s speech could influence market expectations for a rate cut this year.
Macro data will be released in batches: including ADP employment data on Wednesday, PCE price index on Thursday and non-farm payrolls report on Friday. These data will determine the next move of gold.
Global central bank trends: The Bank of Canada and the Bank of Japan also hold policy meetings next week. Investors will be watching to see if their policy signals cause volatility in the US dollar and gold prices.
Technical Outlook Analysis OANDA:XAUUSD
On the daily chart, gold is in a rather important position after 3 consecutive corrective declines. However, the bearish momentum still keeps gold above the base price, which is an important psychological point for the bullish expectation of 3,300 USD.
In terms of position and indicators, gold has not completely lost the ability for a bullish outlook. Specifically, gold is still in a short-term rising channel and supported by the EMA21. On the other hand, it is still supported by the horizontal support level of 3,310 USD, followed by the psychological level of 3,300 USD and the 0.382% Fibonacci retracement.
Gold will only qualify for a bearish cycle if it sells below the 0.382% Fibonacci retracement level, then the target will be around 3,246 USD in the short term, more than the 0.50% Fibonacci level.
RSI is sloping down, but has not yet crossed the 50 level, and in the current case, the 50 level acts as a momentum support for the RSI. It shows that there is still room for an increase in price, and if RSI sloping up from 50, it will provide a bullish signal with relatively wide room.
If gold rises above the 0.236% Fibonacci retracement level (3,371 USD), it will be eligible for a new bullish cycle with a target of around 3,400 USD in the short term, more than 3,430 – 3,450 USD then the all-time high.
In the coming time, in terms of position and indicators, gold still has a technical outlook leaning more towards the upside and the notable points will be listed as follows.
Support: 3,310 – 3,300 – 3,292 USD
Resistance: 3,350 – 3,371 – 3,400 – 3,430 USD
SELL XAUUSD PRICE 3371 - 3369⚡️
↠↠ Stop Loss 3375
→Take Profit 1 3363
↨
→Take Profit 2 3357
BUY XAUUSD PRICE 3303 - 3305⚡️
↠↠ Stop Loss 3299
→Take Profit 1 3311
↨
→Take Profit 2 3317
AUDUSD 4HOUR TIME FRAME ANALYSISOn the 4-hour chart, AUD USD has recently shifted into a shallow up-trend after carving out a higher low around 0.6480. From that support zone, price has rallied through a short-term descending channel, breaking its upper trendline just above 0.6500 and holding that breakout on the last two candles. The entry at 0.65231 sits just above a cluster of prior resistance–turned–support (0.6500–0.6520), giving the trade a solid foothold.
Momentum indicators confirm the bullish tilt: the 14-period RSI is riding around 60–65, neither overbought nor fatigued, suggesting room to run toward your target. Likewise, price is comfortably above both its 50-period and 200-period EMAs, with the shorter EMA crossing above the longer one roughly 12 bars ago, signalling that buyers are in control.

XAUUSD 4HOUR TIME FRAME ANALYSISOn the 4-hour chart, XAUUSD has recently pulled back into a well‐defined demand zone just above 3 330, offering a low-risk entry around 3 338. Here’s how the setup looks:
Trend Context
• Over the past week, gold has carved out a gentle up-slope, tracing higher highs and higher lows from 3 300 up toward 3 395.
• Price dipped back to test the rising 50-period moving average.
Key Levels
• Entry (3 338): Aligns with the confluence of the 50-period MA and a horizontal support zone (3 330–3 340), where buyers staged a rally earlier in the week.
• Stop-Loss (3 307): Placed just beneath the swing low at 3 315 and below the trendline connecting the last two higher lows—giving room for noise while protecting against a deeper reversal.
Momentum & Oscillators
• RSI (14): Currently around 45, rising from the 40 region. This suggests bearish exhaustion is waning and room remains before overbought conditions.

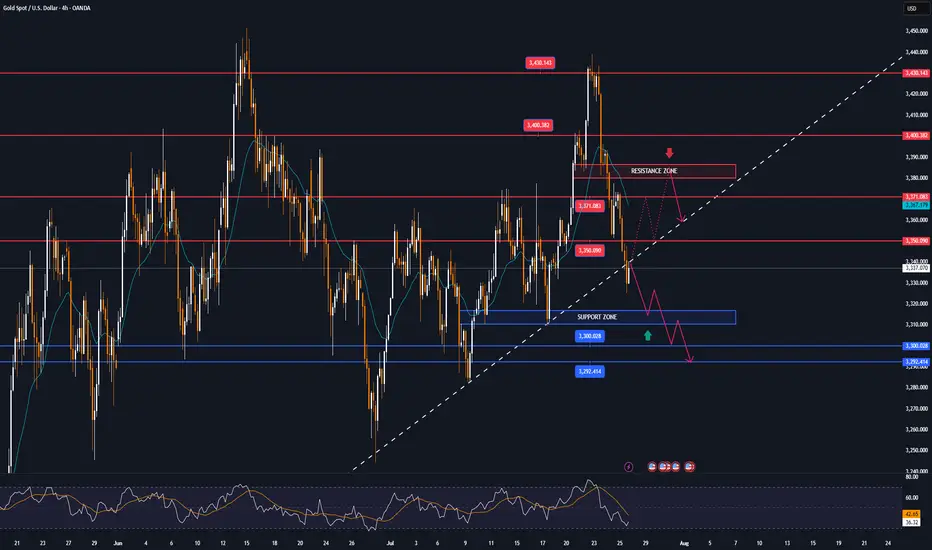
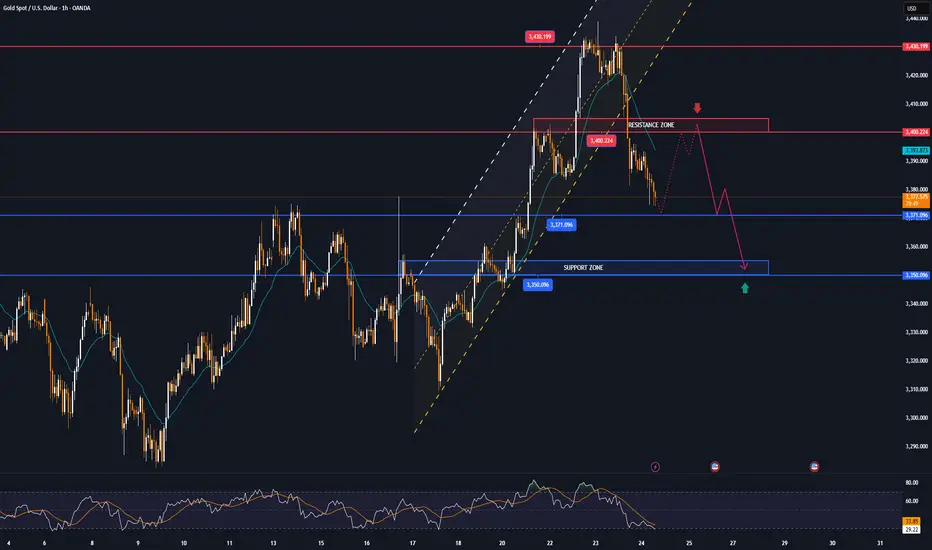
GOLD - GC Weekly Recap & Outlook | 27.07.2025🧾 Weekly Recap:
• Price tapped into the 1H Demand Zone (red box) and ran the 4H swing liquidity before bouncing to clear internal range liquidity.
• This move was followed by a retracement which led to a break of the bullish trendline.
This may signal the beginning of a broader accumulation phase. Expect choppy price action targeting internal liquidity both above and below, before a clear trend resumes.
📌 Technical Analysis:
Price has closed below the bullish trendline, leading to two possible scenarios:
1. Bullish scenario (black path):
– Price runs the W C DOL (3313$) →
– Finds rejection →
– Retests broken trendline →
– Breaks above the trendline →
– Continues toward 3444$ and potentially 3474$
2. Bearish scenario (orange path):
– Price runs W C DOL (3313$) →
– Rejects from the broken trendline →
– Fails to reclaim it →
– Continues downward to target M C DOL (3256$)
📈 Setup Trigger:
Wait for clear 1H–4H supply/demand zone creation and structure shift before initiating a trade.
🎯 Trade Management:
• Stoploss: Above/below relevant supply-demand zone
• Targets:
– Bullish: 3444$, 3474$
– Bearish: 3256$
🟡 If you liked the idea, feel free to drop a like & comment — and don’t forget to follow for more weekly updates.

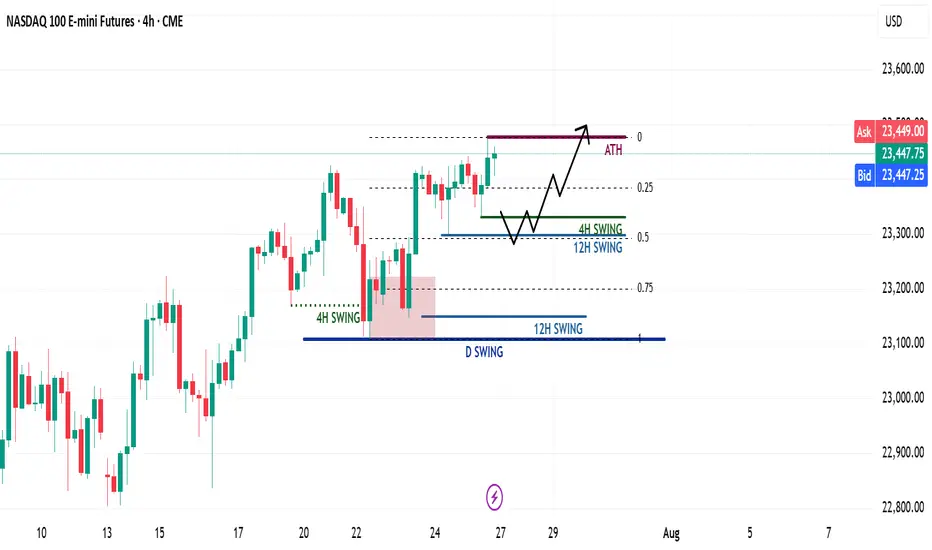
NQ Weekly Recap & Gameplan – 27.07.2025🧭 Market Sentiment
The overall sentiment remains bullish, supported by:
• Lower inflation data
• Trump’s policy shift toward aggressive rate cuts
This creates a strong risk-on environment across U.S. indices.
🔙 Previous Week Recap
• NQ continued its price discovery phase
• Price swept 4H swing liquidity and triggered a market structure shift
• A new 1H demand zone was formed after MSS
• Price revisited the 1H demand and launched toward new all-time highs (ATH)
• While I anticipated a deeper retracement, ES provided the cleaner pullback
• I executed longs on both ES and NQ using SMT divergence (ICT SMT concept)
📊 Technical Analysis
My bias remains bullish as long as the higher timeframe structure holds.
For the upcoming week:
• Watching for either the 4H or 12H swing high to get swept
• Ideally, a retracement toward the 0.5 Fib level, which aligns with my bullish discount zone
• A clean liquidity sweep into this zone could act as a launchpad for the next leg higher
⚙️ Trade Setup & Execution Plan
Entry Strategy:
• Wait for a new 1H–4H Market Structure Shift
• Identify the new demand zone post-MSS
• Look for price to return to the zone for a long opportunity with LTF confirmation
Trade Management:
🎯 Target: New ATH
⛔ Stoploss: Swing low of the 1H–4H demand zone
📌 Chart will include Fib levels, MSS zones, and execution trigger areas.
Let me know your thoughts or share your plan below.
Happy trading!
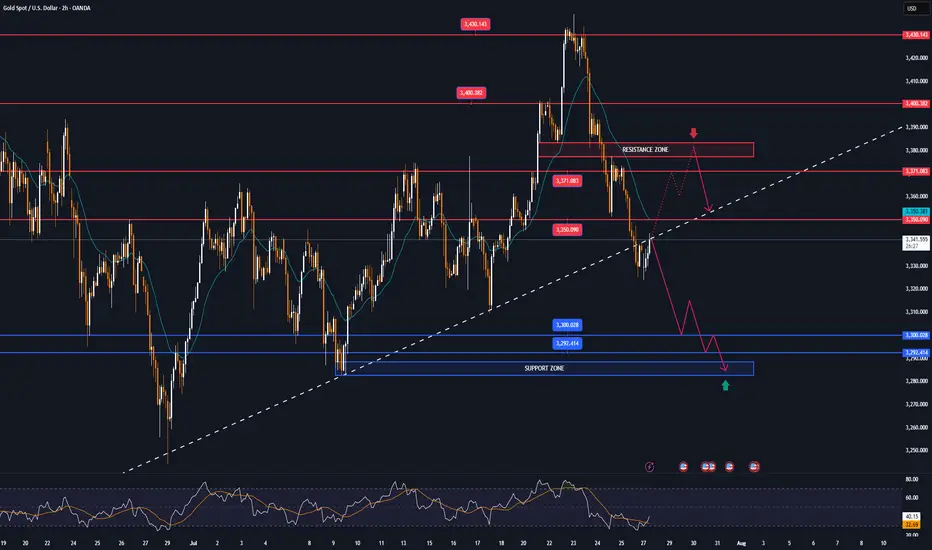
GOLD MARKET ANALYSIS AND COMMENTARY - [Jul 28 - Aug 01]This week, OANDA:XAUUSD prices had a positive start, rising sharply from 3,345 USD/oz to 3,439 USD/oz because investors were concerned about the risk of financial market instability when US President Donald Trump continuously pressured the FED Chairman to reduce interest rates, and there were even rumors of the Fed chairman resigning.
However, the upward momentum in gold prices was not maintained when the US continuously reached trade agreements with partners such as Japan, Indonesia, Philippines..., cooling down the trade war. This caused gold prices to drop sharply for three consecutive trading sessions, at one point the gold price dropped to 3,325 USD/oz and closed at 3,336 USD/oz.
Trade war worries are starting to subside. Therefore, we continue to witness a shift of investment capital flows from gold to risky assets such as stocks..
Notably, this week is the fourth time gold prices broke the $3,400 threshold but did not stay above this level.
Next week, in addition to the FED meeting, the market will also receive information about US non-agricultural employment (NFP) data. If this index falls stronger than expected, it will further strengthen expectations that the FED will continue to keep interest rates at the current level in upcoming meetings, causing gold prices to drop even more sharply next week.
📌In terms of technical analysis, the three crows pattern (3 long red candles) appeared on the D1 chart, showing that sellers were still in control throughout the past 3 trading sessions without much buying power. This technical pattern often suggests that gold prices may be shifting from their recent upward trajectory into a more prolonged period of decline. This technical signal also quite coincides with the context of many fundamental factors, such as geopolitical conflicts, trade wars, low physical gold demand in the summer... no longer strongly supporting gold prices as before. However, according to many experts, if the gold price drops sharply, it will be a good opportunity to buy, because the gold price is forecast to still increase strongly in the long term.
On the H4 chart, gold price may continue to adjust down below the 3,285 USD/oz mark, before recovering again. Meanwhile, the 3,450 USD/oz area is still a strong resistance level for gold prices next week.
Notable technical levels are listed below.
Support: 3,310 – 3,300 – 3,292USD
Resistance: 3,350 – 3,371 – 3,400 – 3,430USD
SELL XAUUSD PRICE 3383 - 3381⚡️
↠↠ Stop Loss 3387
BUY XAUUSD PRICE 3316 - 3318⚡️
↠↠ Stop Loss 3312
GOLD continues to correct down, good news from trade situationOANDA:XAUUSD has fallen sharply again, currently trading around $3,360/oz, reflecting the easing of global trade tensions, affecting demand for safe-haven assets. The US Dollar and US Treasury yields have also increased, affecting gold prices.
The US Dollar Index ( TVC:DXY ), which tracks the greenback against six other currencies, rose to 97.56.
The yield on the 10-year US Treasury note US10Y rose to 4.386%. The US real yield, calculated by subtracting inflation expectations from nominal interest rates, rose nearly 3.5 basis points to 2.046%.
Markets are increasingly optimistic about such deals after the United States and Japan reached a trade deal, and the European Union could be next. In addition, rising stock markets and low volatility have kept gold's gains in check.
The United States and the European Union are moving toward a potential trade deal that would include a 15% tariff on EU goods and zero tariffs on some items.
The European Commission said Thursday that a negotiated trade solution with the United States is within reach.
“Our focus is on reaching a negotiated outcome with the United States,” a European Commission spokesperson told reporters about the EU-U.S. tariff talks. “We believe that such an outcome is achievable.” The European Commission has repeatedly said that its current priority is to reach a deal with the United States to avoid the 30% tariffs that U.S. President Trump has proposed to impose on EU products starting August 1.
On the economic data front, initial jobless claims in the United States unexpectedly fell last week, suggesting the job market remains solid.
The U.S. Bureau of Labor Statistics reported on Thursday that initial jobless claims fell to 217,000 in the week ended July 19, below expectations of 227,000 and down from 221,000 the previous week.
Technical Outlook Analysis OANDA:XAUUSD
Gold is heading for its third consecutive day of decline since hitting the bullish target level sent to readers in the weekly edition on Sunday at $3,430.
Despite the sharp decline, gold still has enough technical conditions for an uptrend given its current position and structure.
Specifically, gold is still above the EMA21, which is considered the nearest support at the moment. Along with that, the uptrend price channel is the short-term trend. However, for gold to qualify for a short-term bullish cycle, it needs to be confirmed by price action above the 0.236% Fibonacci retracement level, then the target is $3,400 in the short term, more than $3,430.
On the other hand, RSI is still holding above 50, and 50 in this case acts as momentum support. Therefore, gold still has room to rise.
In case gold is sold below EMA21, it may suffer a further decline with the next target around $3,310 in the short term, more than $3,300 and the 0.382% Fibonacci retracement level. And if gold loses the support at the 0.382% Fibonacci level, it will qualify for a bearish cycle.
Intraday, the current position of gold price is still tilted towards the upside, and the notable price points will be listed as follows.
Support: $3,350 – $3,310 – $3,300
Resistance: $3,371 – $3,400 – $3,430
SELL XAUUSD PRICE 3406 - 3404⚡️
↠↠ Stop Loss 3410
→Take Profit 1 3398
↨
→Take Profit 2 3392
BUY XAUUSD PRICE 3329 - 3331⚡️
↠↠ Stop Loss 3326
→Take Profit 1 3337
↨
→Take Profit 2 3343

BTCUSD 4HOUR TIME FRAME ANALYSISCurrently bearish on the 4-hour chart with lower highs and lower lows forming consistently.
Price Action: BTCUSD recently broke below a key support zone around 116,000, turning it into a fresh resistance. The market shows bearish momentum as price fails to reclaim above that zone.
Candlestick Patterns: Multiple bearish engulfing candles confirm selling pressure near the 115,500–116,000 area.

From 3,430 USD GOLD falls below 3,400 USD on optimistic newsOANDA:XAUUSD has suffered a sharp sell-off after rising sharply earlier in the week. Media reports said the United States and the European Union were getting closer to reaching a tariff deal, and the news weighed on safe-haven demand.
OANDA:XAUUSD fell below $3,400 an ounce on Wednesday, down more than 1.2%, following news that the United States and the European Union were close to signing a deal similar to the one Washington and Tokyo signed on Tuesday. It is now trading below that key base point.
The European Union and the United States are moving toward a trade deal that could see more EU goods hit with a 15 percent U.S. import tariff, two diplomats said. Earlier, U.S. President Donald Trump reached a trade deal with Japan that would cut auto tariffs to 15 percent.
Optimism about an imminent U.S.-EU trade deal overshadowed a decline in the U.S. dollar. The U.S. dollar index (DXY), which measures the greenback against a basket of six currencies, fell 0.05 percent on the day to 97.160.
U.S. Treasury yields rose, with the 10-year Treasury yield rising to 4.396%. U.S. real yields, calculated by subtracting inflation expectations from nominal yields, rose nearly 4 basis points to 1.994%.
Gold tends to gain in value during times of uncertainty and low-interest-rate environments because gold itself does not generate interest, and in low-interest-rate environments, the opportunity cost of holding gold is relatively low.
U.S., EU near trade deal
The Financial Times reported on Wednesday that the European Union and the United States are close to reaching a trade deal that would impose a 15% tariff on imports from Europe, similar to the one reached between US President Donald Trump and Japan this week.
The Financial Times reported that Brussels is likely to agree to so-called “reciprocal tariffs” to avoid tariffs that Trump has threatened to impose on EU goods of up to 30% from August 1.
“The agreement reached with Japan is clearly extortionate in terms. Most member states are swallowing their anger and are likely to accept the deal,” an EU diplomat said.
The two sides will exempt some products, including aircraft, spirits and medical equipment, from tariffs.
The agreement between the US and Japan has also left Brussels reluctant to accept higher reciprocal tariffs to avoid a damaging trade war, according to the Financial Times.
Technical Outlook Analysis OANDA:XAUUSD
On the daily chart, after gold reached its target at $3,430, it failed to break above this important resistance level and fell slightly. The decline brought gold back to test the support confluence area, which is the location of the 0.236% Fibonacci retracement with the lower edge of the price channel. And with the current position, gold still technically has enough conditions for a possible increase in price.
Specifically, gold is still in/above the supports from the short-term price channel, the long-term rising price channel and the support from the EMA21, as long as gold is still trading above the EMA21, it still has a bullish outlook in the short term. On the other hand, the short-term target is still at 3,430 USD, while once the 3,430 USD level is broken, it will provide the possibility of further upside with the next target at around 3,450 USD in the short term, more than the all-time high.
RSI remains above 50, far from the 80 – 100 area (overbought area). Showing that there is still a lot of room for upside ahead.
During the day, the technical outlook for gold prices continues to favor upside and notable positions will be listed as follows.
Support: 3,371 – 3,350 USD
Resistance: 3,400 – 3,430 – 3,450 USD
SELL XAUUSD PRICE 3421 - 3419⚡️
↠↠ Stop Loss 3425
→Take Profit 1 3413
↨
→Take Profit 2 3407
BUY XAUUSD PRICE 3354 - 3356⚡️
↠↠ Stop Loss 3350
→Take Profit 1 3362
↨
→Take Profit 2 3368
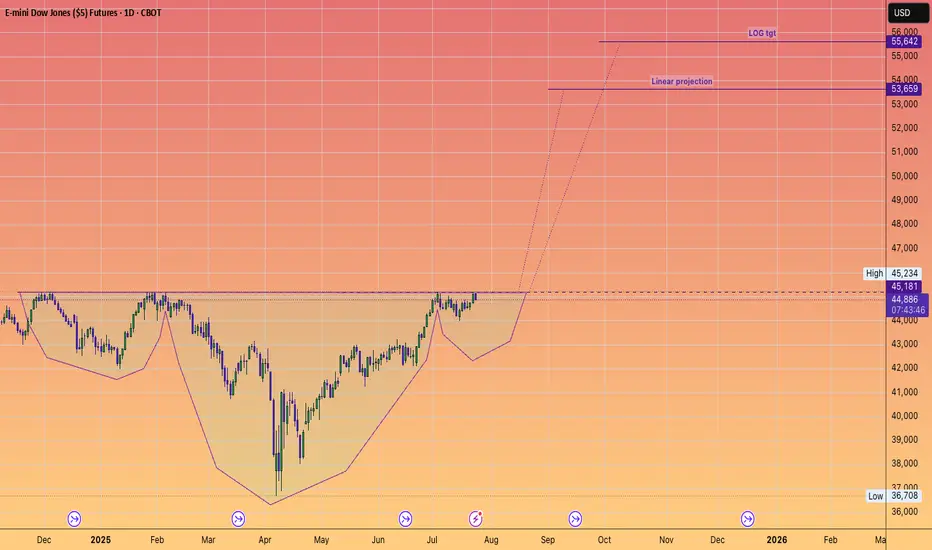
DOW JONES to 55,642#InverseHead&Shoulders
Projects record new highs.
Another stepping stone to our long held forecast of 64,000
Why?
Because AI will significantly contribute to an EXPANDING #GDP
Cocoa futures near a key technical resistance areaMARKETSCOM:COCOA futures have been trending lower, while trading within a falling channel pattern since around mid-May of this year. But we are near the upper bound of that channel. Let's see if it holds.
Let us know what you think in the comments below.
Thank you.
75.2% of retail investor accounts lose money when trading CFDs with this provider. You should consider whether you understand how CFDs work and whether you can afford to take the high risk of losing your money. Past performance is not necessarily indicative of future results. The value of investments may fall as well as rise and the investor may not get back the amount initially invested. This content is not intended for nor applicable to residents of the UK. Cryptocurrency CFDs and spread bets are restricted in the UK for all retail clients.

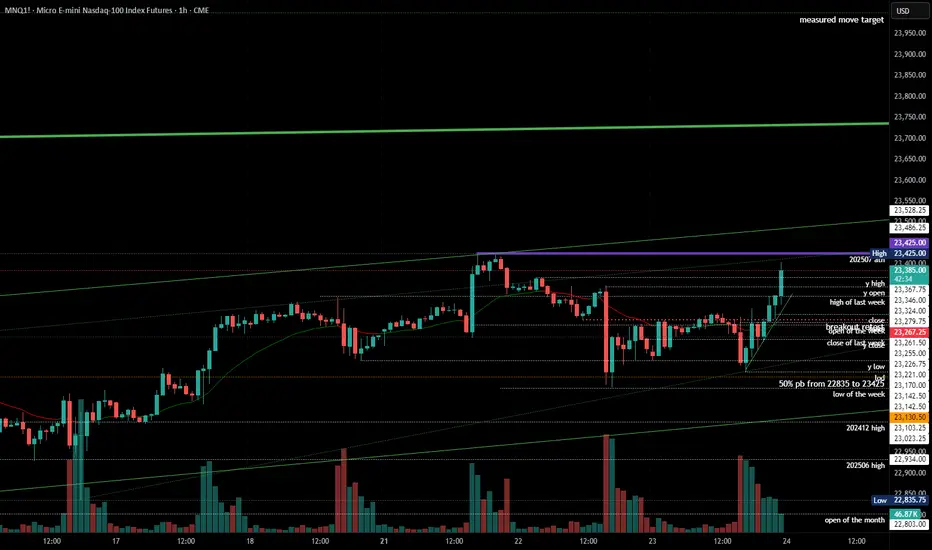
2025-07-23 - priceactiontds - daily update - nasdaqGood Evening and I hope you are well.
comment: Very tight channel up from 23142 but only 1 bear bar since then and in the absence of bear bars, we can only assume sideways to up movement.
current market cycle: bull trend
key levels: 23000 - 24000
bull case: Bulls want to print more higher highs. We are in this bull channel for the whole July now without breaking it and bulls now confirmed the breakout above 23100ish - 3 times. That is the 50% retracement of the last big leg up and very important. A measured move for this leg gives us 24000. Bears have tried with two decent legs to get down to 23000 and failed. I think many will give up on this after hours buying and we can have more meltup into the weekend. Anything bearish would be a big surprise.
Invalidation is below 23250ish.
bear case: Bears tried and failed again. Everything is bought. 1h close below 23250 would certainly stop the max bullishness but bears are really not doing much. We are almost printing daily new ath. Focus on longing pullbacks until the bull channel is broken.
Invalidation is above 24000.
short term: Bullish on any pullback until it stops working.
medium-long term - Update from 2024-06-29: No change in plans. I expect 20000 to get hit over the next 3 months and maybe 19000 again.
trade of the day: Long 23200 has been profitable since Friday.
Euro Futures (6E) – Bearish Drift Below ResistanceEuro Futures (6E) appears to be grinding lower showing clear signs of fading bullish momentum.
After a bounce off 1.16160 support on July 17, Euro Futures (6E) made a failed push into 1.17995 resistance on Tuesday, July 22, a level that’s acted as a firm ceiling since June 26.
Since then, price action has been in a descending broadening channel, often a precursor to further downside with expanding volatility as sellers control the tempo.
As of 5:20 AM GMT, the structure points to continued weakness. I expect 6E to settle around 1.17170 – 1.16990 by close of Wednesday, July 23, 2025.
📉 Bias: Bearish
🔍 Pattern: Broadening Descending Channel
🕒 Date: July 23, 2025

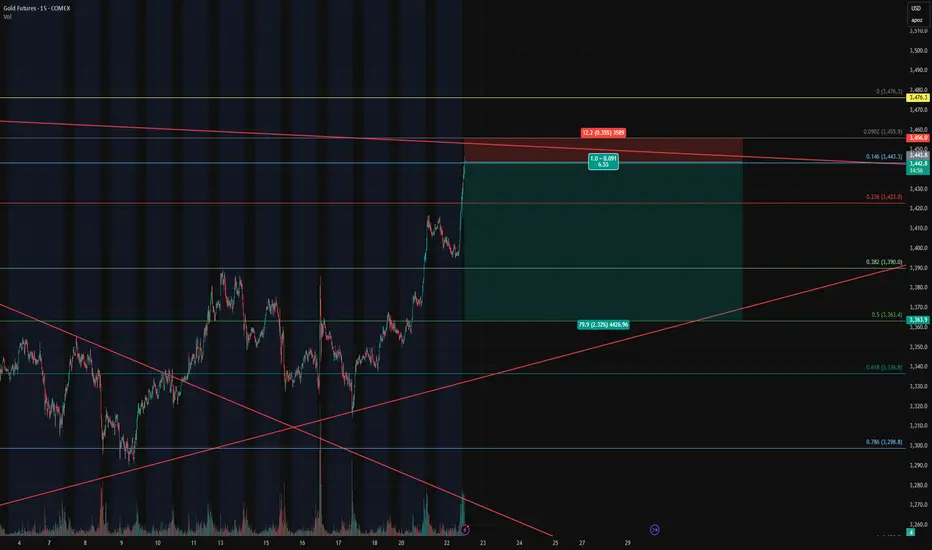
Gold Futures – Closing Longs and Flipping Short at Key Fib🔴 Gold Futures – Closing Longs and Flipping Short at Key Fib Confluence
Instrument : Gold Futures – COMEX ( COMEX:GC1! )
Timeframe : 15-Minute
New Position : Short
Entry Zone : ~3442
Target : ~3362
Stop Loss : ~3458
Risk/Reward : Approx. 6.5+
Setup Type : Reversal from Overextension / Fib Resistance
💡 Trade Recap & Strategy Shift
We’ve officially closed both our recent long entry and our larger swing long position, locking in substantial profit on this move off the 0.618 retracement.
Now, we’re flipping short based on the following:
Price reached the 0.146 Fib extension from the previous retracement leg, a level often overlooked but powerful when confluence lines up.
Trendline resistance from the upper channel has been tagged.
Momentum is showing early signs of stalling after a strong vertical push — textbook overextension.
The rally into this level lacked divergence or structural buildup, increasing the chance of a snapback.
🛠️ Short Setup Details
Entry: 3442 (after signs of exhaustion near Fib confluence)
Target: 3362 (prior structure + 0.382 retracement)
Stop Loss: 3458 (just above high / resistance zone)
Risk/Reward: 6.5:1 — excellent profile for a countertrend play.
📌 Watch For
A break below 3390 will be key confirmation of momentum shifting back down.
Failure to hold 3442 on a retest will invalidate the short and re-open the door for a squeeze higher to 3476/3480.
With trend exhaustion in sight and high confluence resistance overhead, we’re taking the opportunity to pivot short — fully aware of the volatility this region can bring.