SPY (S&P500 ETF) - Testing Key Resistance Levels - Weekly ChartSPY (S&P500 ETF) is currently attempting an uptrend rally, bouncing up from the April 7th 2025 support level ($488) and weekly support trendline.
The current resistance price level is $569 above, and the support price level below is $555.
SPY price needs to remain and close above $522 in May 2025 to maintain the current uptrend rally.
Resistance price targets above: $569, $578, $600, $610.
Support price targets below: $555, $542, $533, $512.
Tariff and trade deal news, corporate earnings, government law changes, and consumer sentiment will continue to affect the stock price action of SPY.
Support price levels need to hold for an uptrend to continue in 2025.
Futures

GOLD falls sharply then recovers slightly from key confluenceOANDA:XAUUSD fell sharply and recovered slightly, as expectations of more such deals increased after US President Donald Trump announced a “groundbreaking” trade deal with the UK, undermining the metal’s appeal as a safe-haven asset.
The US and UK have reached a deal and markets are expecting more “tariff-free” avenues
Trump and UK Prime Minister Keir Starmer jointly announce the signing of a trade deal
• The UK will reduce tariffs on US goods from 5.1% to 1.8%;
• The US will maintain a uniform tariff of 10% on UK imports;
• The UK will further ease market access for US goods.
The US and China will continue high-level talks this Saturday
US Treasury Secretary Scott Bessent and Trade Representative Jamieson Greer will meet with top Chinese economic officials in Switzerland on Saturday to discuss the outlook for trade relations.
Gold prices have hit record highs in recent months, largely due to global tensions caused by Trump's tariff policies.
China's central bank allows banks to buy foreign currency to import gold, signaling potential support
The People's Bank of China has approved commercial banks to buy foreign currency in the latest quota to pay for gold imports, supporting the possibility of increased physical gold demand in the market in the future.
With the implementation of the US-UK agreement, the recovery of risk appetite in the market and the approaching US-China negotiations, the safe-haven demand for gold has temporarily eased, and technical downward pressure has also emerged.
In addition, traders need to pay special attention to geopolitical developments with the focus on Russia - Ukraine when Ukraine has taken actions despite Russia's warnings on May 9.
Any escalation of the conflict will immediately support gold's sudden price increase.
Analysis of OANDA:XAUUSD technical outlook
On the daily chart, after a sharp decline from the weekly target of $3,430, gold's decline has paused and recovered slightly from the 0.382% Fibonacci retracement level. The area around $3,292 is also an important support area as it is a confluence of important technical support factors, with the appearance of EMA21 (major support), the lower edge of the price channel which is the short-term trend price channel and the 0.382% Fibonacci retracement level.
As long as gold remains above $3,292, it still has a bullish outlook in the short term, and in case gold falls below this level, it will likely test technical support at $3,267 in the short term, more than $3,245.
For the day, with the current position, gold still has a bullish outlook, and the notable points will be listed as follows.
Support: $3,300 – $3,292 – $3,267
Resistance: $3,351 – $3,371
SELL XAUUSD PRICE 3334 - 3332⚡️
↠↠ Stop Loss 3338
→Take Profit 1 3326
↨
→Take Profit 2 3320
BUY XAUUSD PRICE 3259 - 3261⚡️
↠↠ Stop Loss 3255
→Take Profit 1 3267
↨
→Take Profit 2 3273

2025-05-08 - priceactiontds - daily update - nasdaqGood Evening and I hope you are well.
comment: Market closed where it opened, after the early rally from Globex to mid EU session and then another one after the US open bear trap. I could not believe that bulls would do another strong move up after such a rejection above 20250 but meh. Can they really do another tomorrow after yet another strong rejection? Until bears print lower lows, the answer is "probably”. Clear bull wedge and bears need to break below 19970 for more downside. If we stay above 20100 we can do higher highs until we ultimately hit 20536 or higher.
current market cycle: trading range
key levels: 19700 - 20600
bull case: Bulls printed two amazing rallies and they we not enough to make meaningful higher highs and accelerate upwards. Usually that price action would have been enough for more bears to give up but once market began to stall on new highs, bulls vanished and bears overwhelmed them. I don’t have much for the bulls tbh. 5 tries and they are still failing.
Invalidation is below 19100.
bear case: Bears need to break the bull wedge and print below 19970. That’s about it. The rejections from new highs are good but the follow-through is trash. Going below 19600 into the weekend is me next wet dream.
Invalidation is above 20400.
short term: Neutral. Bulls grinding but for how many more tries? If that is bad English, you can do you.
medium-long term - Update from 2024-04-20: My most bearish target for 2025 was 17500ish, given in my year-end special. We are +18% from the lows and I do think, once this turns again, it will easily be the short trade of the year.
trade of the day: Shorting new highs continues to print money.

SUI ANALYSIS📊 #SUI Analysis
✅There is a formation of Descending Channel Pattern in daily time frame in #SUI .
Also there is a perfect breakout and retest. Now we can expect a bullish move. If the price successful retest the major support zone then we will see more bullish move
👀Current Price: $3.89
🎯 Target Price : $4.25
⚡️What to do ?
👀Keep an eye on #SUI price action and volume. We can trade according to the chart and make some profits⚡️⚡️
#SUI #Cryptocurrency #Breakout #TechnicalAnalysis #DYOR

DEXE ANALYSIS📊 #DEXE Analysis
✅There is a formation of Descending triangle pattern on daily chart 🧐
Pattern signals potential bullish movement incoming after a breakout.
👀Current Price: $14.68
🚀 Target Price: $18.50
⚡️What to do ?
👀Keep an eye on #DEXE price action and volume. We can trade according to the chart and make some profits⚡️⚡️
#DEXE #Cryptocurrency #TechnicalAnalysis #DYOR

Down nearly 2% on Wednesday, GOLD still rebounds quickly on riskOANDA:XAUUSD fell nearly 2% on Wednesday (May 7), mainly due to a stronger US dollar and optimism from upcoming trade talks between the United States and China, while the Federal Reserve's "standstill" also added pressure on gold prices. However, it was supported by escalating geopolitical risks.
On Wednesday, the Federal Open Market Committee (FOMC) left the target range for the federal funds rate unchanged at 4.25%-4.50%, citing increasing uncertainty about the economic outlook and rising risks to both maximum employment and price stability. “Uncertainties about the economic outlook continue to increase,” the FOMC said in its post-meeting statement. “The Committee is concerned about bilateral risks to its dual mandate and sees increasing risks to unemployment and inflation.”
Federal Reserve Chairman Powell maintained a neutral tone, saying the current policy stance was appropriate and the Fed was in no rush to adjust interest rates. He stressed that the Fed was prepared to act “quickly as needed” if circumstances changed, but warned that the Fed’s goals would not be fully achieved if tariffs remained in place.
Powell added that if either side of the dual mandate deviates too much, the Fed will evaluate which policy tool to use to achieve rebalancing.
When asked which mandate, inflation or employment, should receive more attention, he said it was too early to tell.
The market consensus remains that the Fed will not cut rates before July. In a higher interest rate environment, non-interest-bearing gold is often under pressure.
Big news on China-US trade talks
China and the US announced that US Treasury Secretary Besant and US Trade Representative Greer will travel to Switzerland to meet with Chinese Vice Premier He Lifeng.
The talks are the first since US President Donald Trump imposed comprehensive tariffs on China and have raised optimism that the two largest economies can reach a deal.
On Wednesday, a spokesperson for the Chinese Ministry of Commerce answered reporters' questions about the high-level economic and trade negotiations between China and the United States. The spokesperson said China has decided to cooperate with the United States. Vice Premier He Lifeng, as head of the China-US economic and trade negotiation delegation, will hold talks with his US counterpart, US Treasury Secretary Benson, during his visit to Switzerland. - Bloomberg -
India-Pakistan tensions spiral after attack, risk of further escalation fuels demand for safe havens
India's airstrike on Pakistan has stoked tensions, raising fears of a full-blown war between the two nuclear-armed nations.
India launched missiles at nine locations in Pakistan and Pakistan-administered Kashmir early on May 7 in response to a shooting that killed 26 tourists in Pahalgam, Jammu and Kashmir, two weeks ago. The Indian Ministry of Defense said its forces struck facilities used by "terrorist groups" to carry out the Pahalgam attack.
The Indian Air Force has mobilized many modern weapons, including Rafale multi-role fighters carrying SCALP-EG stealth cruise missiles and AASM Hammer extended-range guided bombs and cruise missiles. The target coordinates were provided to the forces participating in the campaign by Indian intelligence agencies.
Images released by the media show the moment the series of missiles crashed into the target, creating large fire circles and violent explosions. Pakistan said at least 26 people were killed in this attack. -According to Vnexpress -
Gold is an asset that often benefits first when market risks appear, and India is also a leading gold-using country in the world.
Technical Outlook Analysis OANDA:XAUUSD
After yesterday's decline, gold continues to receive support from the 0.236% Fibonacci retracement area with horizontal support at $3,350 as noted by readers in yesterday's edition and it is now also aiming for a target of $3,430.
Once gold breaks $3,430 it will be in a position to continue its rally with a target of around (all-time high) in the short term.
Technical factors are completely bullish, from the short-term trend noted by the rising price channel and the long-term trend from the rising price channel. On the other hand, the nearest support is also the EMA21.
The relative strength index RSI is still quite far from the 80 level and the overbought area, indicating that there is still room for growth ahead and gold is likely to continue to increase in terms of momentum in the coming time.
During the day, the main bullish outlook for gold prices in terms of technology will be noted again by the following levels.
Support: 3,371 – 3,350 USD
Resistance: 3,430 – 3,500 USD
SELL XAUUSD PRICE 3440 - 3438⚡️
↠↠ Stop Loss 3444
→Take Profit 1 3432
↨
→Take Profit 2 3426
BUY XAUUSD PRICE 3350 - 3352⚡️
↠↠ Stop Loss 3346
→Take Profit 1 3358
↨
→Take Profit 2 3364

2025-05-07 - priceactiontds - daily update - daxGood Evening and I hope you are well.
comment: Triangle as in other markets, will likely do a strong move tomorrow or Friday.
current market cycle: trading range
key levels: 21000 - 24000
bull case: Bulls see this as a shallow/sideways pullback at the highs and want continuation for a new ath. They are trading far above the daily 20ema and the volume is picking up again. Yesterday bulls bought a big pullback but failed to make higher highs today, so they are likely disappointed. I don’t think many bulls want to stay long when we fail to make higher highs but rather wait for another pullback. So either they get the new ath tomorrow, or risk of running stops below 22979 increases.
Invalidation is below 23300.
bear case: Bears tried two times now to push the market lower and failed. If we make higher highs again, they will most likely give up and wait to see how high this can go before they short again. Only below 22979 will bears do some damage to the bull case and we could maybe see an acceleration down. For now bears are to weak to print lower lows but bulls are also weak, which is the reason why we printed a triangle. Probably best to do nothing and wait for the strong next move.
Invalidation is above 23550.
short term: Neutral. Below 23000 I favor the bears and above 23400 we are likly going for 23550 and if that won’t hold, we could do 24000. Markets keep ignoring bad news, so the path of least resistance is likely still up but it’s a guess and nothing you should trade on. Trade whats in front of you and not what you think the market should do. Right now it’s in a tight range waiting for the next impulse.
medium-long term from 2024-03-16: Bear trend is over. My rough guess for now is that we will stay inside this trading range 19000 - 24000 for much longer or until economic data becomes the excrementshow I expect it to become over the next months.
trade of the day: Shorting EU open and holding for 23200, which was around prior support.

CYBER ANALYSIS🚀#CYBER Analysis : Pattern Formation
🔮As we can see in the chart of #CYBER that there is a formation Inverse Head And Shoulder Pattern and it's a bullish pattern. If the candle breaks and sustain above the neckline then a bullish move could be confirmed✅
🔰Current Price: $1.290
⚡️What to do ?
👀Keep an eye on #CYBER price action. We can trade according to the chart and make some profits⚡️⚡️
#CYBER #Cryptocurrency #TechnicalAnalysis #DYOR

How to Set Up and Use OCO Orders on TradingViewThis tutorial video explains what OCO (Order cancels orders) are, how they work, how to place them in Tradingview, and how they relate to bracket orders.
You'll learn how to add them to new entry orders as well as existing positions.
There is a substantial risk of loss in futures trading. Past performance is not indicative of future results. Please trade only with risk capital. We are not responsible for any third-party links, comments, or content shared on TradingView. Any opinions, links, or messages posted by users on TradingView do not represent our views or recommendations. Please exercise your own judgment and due diligence when engaging with any external content or user commentary.

US-China optimism, GOLD falls sharply from target levelIn early morning trading on Wednesday (May 7), spot OANDA:XAUUSD fell sharply by nearly 2%. Bloomberg said that despite the escalation of military conflict between India and Pakistan, signs of progress in trade negotiations between the United States and China have limited demand for safe-haven assets.
Previously, gold prices had surged for two consecutive trading days. Spot gold prices rose nearly 3% on Tuesday.
China and the United States announced that U.S. Treasury Secretary Besant and U.S. Trade Representative Greer will travel to Switzerland to meet with Chinese Vice Premier He Lifeng.
Today (Wednesday), a spokesperson for the Chinese Ministry of Commerce answered reporters' questions about the high-level economic and trade negotiations between China and the United States. The spokesperson said that China has decided to cooperate with the United States.
Vice Premier He Lifeng, as head of the China-US economic and trade negotiation team, will hold talks with his US counterpart, US Treasury Secretary Benson, during a visit to Switzerland. It is the first such meeting since US President Donald Trump imposed sweeping tariffs on China and has raised optimism that the two largest economies could reach a deal.
Gold prices have risen nearly 30% this year as Trump’s aggressive trade and geopolitical policies have caused widespread market turmoil and investors have sought safe havens. Gold hit a record high of $3,500 an ounce in April but has fallen in recent weeks.
The Federal Reserve will announce its interest rate decision later Wednesday, and policymakers are expected to keep rates unchanged despite Trump’s repeated criticism of Fed Chair Powell for not cutting rates.
Fed officials have often stressed the need to wait and see how the trade policies implemented last month will affect the economy. Lower borrowing costs tend to be good for gold.
Technical Outlook Analysis OANDA:XAUUSD
After gold achieved the target increase noted by readers in yesterday's edition at 3,430 USD, it has fallen significantly in the early trading session today (7 May). But the downside momentum is also limited by the 0.236% Fibonacci retracement level, which is noted as the nearest support level and for gold to continue to increase in price, it needs to achieve the condition of recovering and breaking the 3,430 USD level after which traders can think about the 3,500 USD level in the near future.
During the day, in the overall picture, gold still has a bullish outlook with the long-term rising price channel and the short-term rising price channel as the trend and support from the EMA21 moving average.
As long as gold remains above the EMA21 and within/above the aforementioned price channels, the overall outlook remains bullish, but you should also note that in the current market environment, price movements of 2-3%/day are very common, so technical positions need to be firmly established (preferably at confluences where multiple indicators are present).
My notable positions will be listed as follows.
Support: 3,371 – 3,350 USD
Resistance: 3,400 – 3,430 USD
SELL XAUUSD PRICE 3440 - 3438⚡️
↠↠ Stop Loss 3444
→Take Profit 1 3432
↨
→Take Profit 2 3426
BUY XAUUSD PRICE 3337 - 3339⚡️
↠↠ Stop Loss 3333
→Take Profit 1 3345
↨
→Take Profit 2 3351

2025-05-06 - priceactiontds - daily update - nasdaq
Good Evening and I hope you are well.
comment: Clear trading range 19700 - 20300, don’t make it more complicated. We have FOMC tomorrow, then we will get a new impulse.
current market cycle: trading range
key levels: 19700 - 20300
bull case: Bulls defended the gap below to 19650 and prevent the bears from printing a bearish daily bear bar. Bulls are fine with the market correcting sideways, since that increases the odds of a continuation up and running the stops above the prior major lower high 20536. Bulls need to break above 20070 tomorrow or this could slowly become more bearish again, especially when we make lower lows below 197300.
Invalidation is below 19100.
bear case: Bears see it as a lower high major trend reversal and if they can stay below 20000, their odds increase to continue down. They broke below the first bull trend line and the next is around 19700 tomorrow. A strong 1h close below 19700 and I think more bulls will give up on this bounce.
Invalidation is above 20100.
short term: Neutral. Continuation in given range is expected until FOMC. I don’t know if Jpow can really move this but let’s see. Don’t gamble.
medium-long term - Update from 2024-04-20: My most bearish target for 2025 was 17500ish, given in my year-end special. We are +18% from the lows and I do think, once this turns again, it will easily be the short trade of the year.
trade of the day: Short since Globex open since Market could not get above 1h 20ema for 299 points down.

GOLD soars, geopolitical risks escalateIn the early morning trading session on Tuesday (May 6), the spot price of OANDA:XAUUSD suddenly jumped more than 50Dollar in the short term. The price of gold just hit 3,387USD/ounce, setting a new intraday high.
Trump's latest tariff announcement has increased risk-off sentiment, thereby pushing the price of gold up sharply.
WASHINGTON (Reuters) - U.S. President Donald Trump said on Sunday he plans to impose a 100% tariff on foreign-made films, extending his restrictive trade policy on U.S. imports to the entertainment industry for the first time, rekindling investor concerns about the potential fallout from a global trade war.
On Monday local time, Trump signed an executive order on biomedical research, hoping to use this opportunity to boost the US pharmaceutical industry. Trump also announced that tariffs on pharmaceutical products will be announced within the next 2 weeks.
Gold is often considered a safe haven in times of uncertainty and performs well in low interest rate environments. Gold prices have soared 26.3% this year and have set new historical records several times.
On the other hand, geopolitical tensions surrounding the conflict between Ukraine and Russia are also escalating as Ukraine actively attacks despite warnings from Russia. On May 9, Russia will solemnly celebrate the 80th anniversary of Victory Day - a significant historical milestone with the participation of many international politicians and military corps from many countries participating in the parade at Red Square.
Geopolitical risks often impact the market very quickly and dramatically, gold prices will increase sharply whenever geopolitical risks appear as dangerous as the current situation in Ukraine - Russia.
Technical analysis of OANDA:XAUUSD prospects
On the daily chart, after gold received support and recovered from the confluence area of EMA21 and 0.50% Fibonacci retracement, gold showed prospects of continuing to recover and entering a new technical bullish cycle, bringing price activity back above $3,300.
At the time of writing, gold has reached the weekly target level sent to readers in the weekly publication at $3,371, which is also the current nearest resistance. Once gold remains stable above the 0.236% Fibonacci retracement level, it will have the prospect of continuing to increase with the next target around $3,400 – $3,430 in the short term.
On the momentum front, the Relative Strength Index (RSI) has turned upward with a significant slope after receiving support from the 50 area, which should be considered a positive signal for further bullish expectations.
Intraday, the technical outlook for gold is bullish with the main support from the EMA21, the notable positions will also be listed as follows.
Support: 3,300 – 3,292 – 3,267USD
Resistance: 3,400 – 3,430USD
SELL XAUUSD PRICE 3409 - 3407⚡️
↠↠ Stop Loss 3413
→Take Profit 1 3401
↨
→Take Profit 2 3395
BUY XAUUSD PRICE 3306 - 3308⚡️
↠↠ Stop Loss 3302
→Take Profit 1 3314
↨
→Take Profit 2 3320

TURBO ANALYSIS🔆#TURBO Analysis : Channel Following ⛔️⛔️
As we can see that #TURBO is following ascending channel on 4h time frame. We can see a bullish formation here. And if it trade with good volume then we can see a proper bullish move in #TURBO📈📈
🔖 Current Price: $0.005610
⏳️ Target Price: $0.006160
⁉️ What to do?
- Keep your eyes on the chart, observe trading volume and stay accustom to market moves.🚀💸
#TURBO #Cryptocurrency #ChartPattern #DYOR

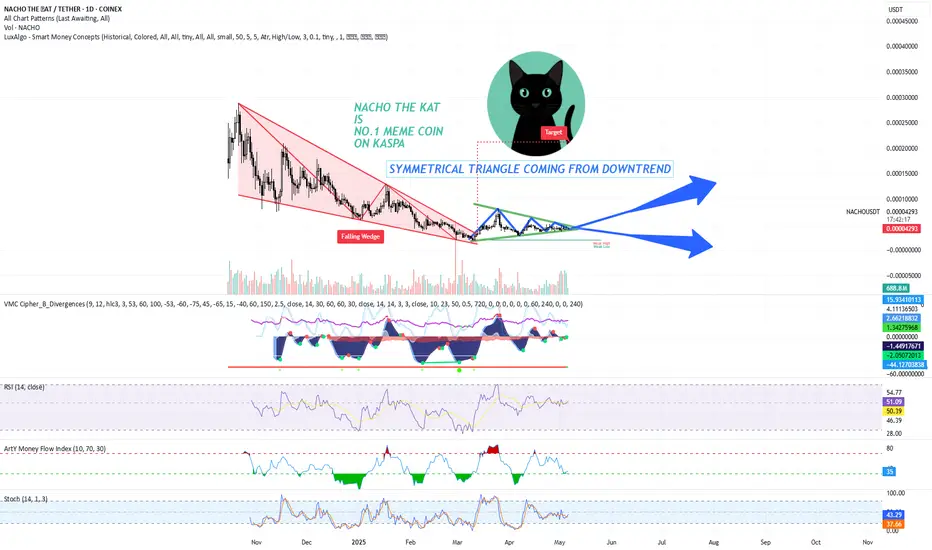
NO.1 MEME COIN ON KASPA IS NACHO THE KAT - DYORThe chart shows a symmetrical triangle pattern forming after a falling wedge. A falling wedge is typically seen as a bullish reversal pattern, indicating that the price may break out to the upside after the convergence of the trendlines. The symmetrical triangle, which is forming after the falling wedge, suggests consolidation before the breakout, likely pointing towards higher price action.
Key Points
Price Action and Trend:
NACHO has been in a downtrend, creating a falling wedge. The falling wedge has converging trendlines, which is a common setup for a bullish breakout.
Currently, the price is consolidating within a symmetrical triangle pattern, with lower highs and higher lows, indicating indecision in the market. The breakout from this triangle is likely to be significant, either continuing the previous downtrend or initiating a bullish reversal.
Volume Analysis:
The volume profile at the bottom shows an increase in volume as the price approaches the apex of the symmetrical triangle, suggesting potential strength behind the breakout.
It's important to monitor if volume increases further upon breakout to confirm the strength of the move.
Key Indicators:
RSI (Relative Strength Index): The RSI is currently around 50.39, suggesting a neutral market sentiment. The RSI has been ranging between oversold and overbought territories, which indicates that NACHO has not yet entered a strong trend but may be preparing for one.
Stochastic RSI: The Stochastic RSI is hovering around 37.57, showing a neutral stance, but it is closer to the oversold region, which could indicate that NACHO is near a potential reversal.
Money Flow Index (MFI): The MFI is at 35, indicating that the market is not yet in a strong buying or selling pressure zone. This shows that there is room for price movement based on volume.
VMC Cipher B Divergences: Positive divergence could suggest bullish momentum emerging, even if the price remains in consolidation.
Target and Resistance Levels:
If NACHO breaks out to the upside from the symmetrical triangle, the target is likely near the upper trendline of the wedge, which aligns with previous highs, possibly reaching the 0.00004500-0.00005000 USDT range.
Immediate resistance is near the 0.00004300 price level.
Support levels to watch are 0.00003000 and 0.00002000, which are key levels from previous price action.
Trading Plan
Entry Strategy:
Breakout Strategy: A strong breakout above the upper trendline of the symmetrical triangle would be a potential buy signal. If the price breaks and closes above 0.00004200, consider entering a long position with a target at 0.00004500-0.00005000.
Volume Confirmation: Ensure that the breakout is accompanied by an increase in volume. A low-volume breakout could be a false signal.
Stop-Loss Strategy:
Initial Stop-Loss: Place a stop-loss just below the symmetrical triangle's lower trendline or 0.00003000. This provides a reasonable distance to avoid being stopped out on small fluctuations.
Trailing Stop: As the price moves up towards your target, consider adjusting your stop-loss to lock in profits, especially if the price exceeds the 0.00004300 resistance level.
Take-Profit Strategy:
First Profit Target: Set a take-profit order around 0.00004500, the first resistance level. This is a key point based on the historical price action and previous swing highs.
Secondary Target: If the price breaks past 0.00004500, adjust the target to 0.00005000, which is the next logical resistance zone.
Risk Management:
Position Sizing: Risk no more than 1-2% of your total capital on this trade. For example, if your trading account is $5,000, you should risk no more than $100-$150 per trade.
Risk-Reward Ratio: Aim for a minimum 2:1 risk-to-reward ratio. For example, if you risk $150 on a trade, aim for a potential reward of $300 or more.
Additional Considerations:
Market Sentiment: As NACHO is a meme coin, market sentiment plays a huge role. Watch for social media trends and any news related to meme coins or Kaspa-based coins that could drive the price action.
Macro Conditions: Stay updated on the general market conditions for cryptocurrencies, as a broader downtrend in the market could limit the upside potential, even if technicals suggest a breakout.
NACHO THE KAT presents a technical setup with the potential for an upward move following a breakout from the symmetrical triangle. A close watch on volume and key price levels will be critical for confirming the breakout and determining the right moment for entry.
The Candles Are Bullish… BUT Is a Reversal on the Horizon?Back on April 28th, we talked about the ES potentially pushing higher — and guess what? It did exactly that! 🎯
Now we find ourselves at a key crossroads.
A new month is here, and with the previous monthly candle officially closed, there’s a strong case to be made for even higher prices — possibly up to the 5776 level. 📈 That said, I’ll be diving into the analysis today where I’ll also touch on some reasons why short-term selling could still show up.
To be fair, the price action from April (1st–30th) hasn’t given us a lot of evidence for a major reversal, but as always, it’s our job as analysts to stay sharp and open to all possibilities — especially in today’s climate.
Right now, I’m still on board the bullish train 🚂 and the charts continue to suggest upward momentum. But I’ll be watching closely for any shifts that might hint at a change.
What about you? What’s your take on the current setup? Let’s get the conversation going — I’d love to hear your thoughts!
Let's Keep Studying - One Candlestick At A Time!

Wheat Trade ideaWheat has been in a downtrend for the past two years, but right now it’s sitting in a strong demand zone on the weekly chart for the year. Both the technicals and fundamentals are starting to look bullish, so this could be a solid setup for a long trade even if the overall trend is still down.
On Thursday, April 24, there was a nice daily rejection between the 545’00 and 539’00 levels. That would’ve been a good entry based on my strategy.
Most traders would avoid this kind of trade because of the strong downtrend, but I see everything lining up here: demand zone, fundamentals, and rejection. It doesn’t mean the market will reverse, but the risk is worth the potential reward.
I’m not expecting a huge move just taking what the market gives me. If fundamentals keep supporting the move, I’ll hold longer. If not, I’ll take profit earlier. It’s about staying realistic and disciplined.

KAVA ANALYSIS📊 #KAVA Analysis
✅There is a formation of Descending triangle pattern on daily chart 🧐
Pattern signals potential bullish movement incoming after a breakout.
👀Current Price: $0.4280
🚀 Target Price: $0.5380
⚡️What to do ?
👀Keep an eye on #KAVA price action and volume. We can trade according to the chart and make some profits⚡️⚡️
#KAVA #Cryptocurrency #TechnicalAnalysis #DYOR

GOLD MARKET ANALYSIS AND COMMENTARY - [May 05 - May 09]This week, the international OANDA:XAUUSD has dropped sharply from 3,352 USD/oz to 3,201 USD/oz and closed the week at 3,240 USD/oz.
The reason for the sharp drop in gold prices is that US President Donald Trump said that the US is about to reach a trade agreement with India, Japan, South Korea, and is likely to reach a trade agreement with China, although the two sides have not had any official negotiations.
In addition, an equally important factor is that China is on holiday from May 1 to May 5, so the demand for transactions in the world's largest gold consuming country is almost non-existent. While they have been continuously buying before even though the gold price was high.
The FED meeting on May 6-7 may have a strong impact on gold prices next week. US GDP in the first quarter grew by -0.3%, while the labor market still has potential tariff risks; inflation remains stable at a high level. With these data, it is likely that the FED will maintain interest rates at current levels, but may signal that a rate cut is coming soon. According to many experts, if the FED signals that it will cut interest rates after the meeting next week, it will push gold prices to recover next week. On the contrary, if the FED maintains a wait-and-see attitude, declaring that it is not in a hurry to cut interest rates, then gold prices next week may continue to adjust.
🕹SOME DATA THAT MAY AFFECT GOLD PRICES THIS WEEK:
Next week, all eyes will be on the Federal Reserve’s monetary policy meeting on Wednesday, with an interest rate decision and a press conference from Chairman Jerome Powell following keynote remarks earlier in April.
Fed officials will then continue their participation in the Reykjavik Economic Conference in Iceland on Friday. Fed Governors Michael Barr, Lisa Cook, Philip Jefferson and Christopher Waller will be present at the conference as speakers in panels on topics including artificial intelligence, employment and monetary policy research.
In addition, investors will also watch the ISM services PMI on Monday morning and the weekly jobless claims number on Thursday.
📌Technically, if gold prices fall below $3,200/oz next week, there is a possibility of a further decline to $3,129/oz. A deeper correction could see gold prices fall to $2,980-$3,000/oz next week. If gold prices reverse and break the $3,270/oz barrier, they could continue to rise above $3,350/oz.
Notable technical levels are listed below.
Support: 3,228 – 3,163USD
Resistance: 3,245 – 3,267 – 3,292 – 3,300USD
SELL XAUUSD PRICE 3311 - 3309⚡️
↠↠ Stop Loss 3315
BUY XAUUSD PRICE 3119 - 3121⚡️
↠↠ Stop Loss 3115

GOLD recovers to initial target, confirmation point continuesOANDA:XAUUSD surged in the first half of trading on Monday (May 5), briefly surpassing the $3,270/ounce mark and marking a daily gain of more than $30. as uncertainty over U.S. tariffs spurred safe-haven flows, supporting gold prices. The Federal Reserve’s interest rate cut in June is also boosting the appeal of non-yielding gold.
Bloomberg reported on Monday that US President Donald Trump plans to impose a 100% tariff on all foreign-made films, which is not a huge deal, but it does escalate the trade war. "I am authorizing the Department of Commerce and the United States Trade Representative to immediately begin proceedings to impose a 100% tariff on all foreign-made films imported into the United States," Trump wrote on his Truth Social social media platform. "We want our movies made in the USA again!"
Gold prices have risen nearly 25% this year, hitting a record high above $3,500 an ounce in April, but have retreated in recent weeks. Bloomberg notes that factors driving gold’s recent rally include safe-haven buying fueled by Trump’s destructive trade and geopolitical policies, as well as speculative demand from China and buying by global central banks.
According to CME's "Federal Reserve Watch" on May 5: The probability of the Federal Reserve keeping interest rates unchanged in May is 96.8%, and the probability of cutting interest rates by 25 basis points is 3.2%.
The probability of the Federal Reserve keeping interest rates unchanged until June is 63.3%, the probability of cutting interest rates by 25 basis points is 35.6%, and the probability of cutting interest rates by 50 basis points is 1.1%.
Technical outlook analysis OANDA:XAUUSD
On the daily chart, gold is still bullish as the price action remains above the important support EMA21. At the same time, the price channel that is noted as the main long-term trend channel remains stable.
On the other hand, the Relative Strength Index (RSI) is also showing signs of weakness as it falls to approach the 50 level, which is noted as the closest support in terms of momentum.
Going forward, if gold rebounds above $3,245, it could rebound to the short-term target of $3,267, more than the 0.382% Fibonacci retracement level, and then the full price point of $3,300.
As long as gold remains within the price channel, its long-term trend remains bullish, but the risk of a deeper correction is when the 0.50% Fibonacci retracement level is broken below, once this level is broken below gold is at risk of further selling to $3,163 in the short term. This also means that technically gold is in an ideal support area for bullish expectations, long positions should be protected below the 0.50% Fibonacci retracement level.
In the coming period, gold has technical conditions that favor a bullish recovery, and the notable points will be listed as follows.
Support: 3,245 – 3,228USD
Resistance: 3,267 – 3,270 – 3,292USD
SELL XAUUSD PRICE 3304 - 3302⚡️
↠↠ Stop Loss 3310
→Take Profit 1 3296
↨
→Take Profit 2 3290
BUY XAUUSD PRICE 3173 - 3175⚡️
↠↠ Stop Loss 3169
→Take Profit 1 3181
↨
→Take Profit 2 3187

Gold Setup: Range or Rip? Here's the PlaybookGold’s been on a tear lately — driven by safe haven demand as real yields soften and global uncertainty lingers.
But here’s where things get interesting...
We’re now watching what could be a textbook head and shoulders pattern start to take shape.
📊 Current Range:
Right now, price is stuck between 3380 and 3280 — and it’s acting like it knows it.
⚡ Possible Scenarios:
🔁 Scenario 1: Range Play
Short near 3380
Long near 3280
Let it ping-pong and catch the edges.
📈 Scenario 2: Breakout Long
Confirmation above 3380
Look for momentum follow-through into 3420+
📉 Scenario 3: Breakdown Short
Break below 3280
Eyes on the 3220s for a potential flush
🧠 The key? Drop to the lower time frames near these zones and wait for clean setups during active sessions — especially NY open or post-data volatility.
💬 How are you playing this? Breakout or bounce? Drop your take 👇
#gold #tradingview #futures #technicalanalysis #metals #xauusd #tradingstrategy #macro

Gold: Will 3,260 Flip From Supply to Springboard?Micro Gold Futures — 30 min chart
BULLISH ABOVE 3,260 | BEARISH BELOW
🗺️ Structure in Focus
Macro bias (4 h/1 D): remains bearish — lower highs & lows since late‑April.
Intraday context: price climbing in a rising channel; buyers defend each channel low since 1 May.
Grey zone 3 255‑3 260:
• 61 %‑78 % Fib retrace of the last leg down
• Breakdown base now acting as supply
• Mid‑channel + intraday VWAP overhead
A decisive H1 close above 3 260 plus a bullish retest flips the bias long toward ≈ 3 280.
🧭 Trade Map
🔴 Base‑case short
• Trigger – bearish reaction inside / below 3 255‑60
• Targets – 3 230, then 3 210 (-27 % Fib extension)
• Invalidation – H1/H4 close > 3 260
🟢 Flip‑bull plan
• Trigger – H1 close above 3 260 and zone holds as support
• Target – 3 280 supply (channel top + prior S/R)
• Invalidation – H1 close back under 3 250
(Risk ≤ 1 % per idea; scale out at interim levels.)
📊 Narrative to Watch
Fed speakers & US data could jolt real yields and gold flow.
Asia session often sets the tone—watch Shanghai physical premium chatter.
Softening DXY gives the upside‑break thesis a tail‑wind.
What’s your play—fade the zone or ride the breakout? Smash the boost 🔥 and follow for live updates!
Not financial advice; just sharing my plan.
Tags: #Gold #XAUUSD #Futures #PriceAction #Fib #TechnicalAnalysis

#202518 - priceactiontds - weekly update - bitcoinGood Evening and I hope you are well.
comment: Only Thursday was bullish and right now market is trying to decide if this breakout was legit or not. If bulls can stay above 95000, the breakout above has a higher chance of being succesful. Below 94000 it has likely failed and I favor the bears for more downside.
current market cycle: weekly chart says continuation of the bull trend but i highly doubt it. much more likely we are in a big trading range 73000 - 110000
key levels: 85k - 100k (if bears somehow manage to get below 85k again, we test 80k next)
bull case: Bulls want this breakout to be the start of the third leg up for 100000. That’s all there really is to it. Bull trends need higher lows and higher highs and if bulls fail to prevent the market from falling below the breakout bar under 94000, this was likely a bull trap.
Invalidation is below 94000.
bear case: Bears want a trading range 70000 - 98000 and not let market hit 100000 again because that would for sure attract more degenerates again. Bears really don’t have much here until they print a decent bear bar that gets below 94000. This looks as bullish as can be and above 98000 I expect 100k to be hit.
Invalidation is above 101k.
short term: Neutral. Below 94000 it’s likely a failed breakout and above 97000 we can expect 100000 or more. Above 100000 there would not be a reason not to go for a new ath, same as for other markets like dax.
medium-long term - Update from 2025-04-13: Bear targets for this year are met. Now we likely range before we get new impulse to either side. I wait for market reaction around 100000 before I write more here. For now my assumption is still that this will be a trading range 73000 - 100000 for longer than a retest or even new highs.

#202518 - priceactiontds - weekly update - oilGood Evening and I hope you are well.
comment: Bears defended the breakout area and kept the market in a bear trend. Bulls tried to print a higher low with a decent bull reversal bar on Thursday. Now what? No idea. Oil below 60 is a big thing and staying below is somewhat low probability, given the past 6 years. The chart is still pretty bearish and if you want to be a bull and look at this, would you be thrilled to buy it at 58? I’m not sure. If you could hold below 53 and add lower as well, sure but as of now, bulls have not done enough to convice me this is a credible bottom.
current market cycle: trading range on monthly tf and bear trend on the daily
key levels: 54 - 65
bull case: Bulls want to keep Thursday the higher low and go up from here. Above 60 they are slightly favored to test 62/64 again but one could also draw another bear trend line from 71.66 to 63.9 from last Monday. So buying here is not favorable, no matter how you look at this chart. Only above 65 do bulls take control again and can test the next bigger bear trend line around 67.
Invalidation is below 54.
bear case: Bears kept the bounce around the breakout area from the W1 low. Now they need to make lower lows to confirm the acceleration of this bear trend. If they fail, this will become fuel for the bulls to test back up to either 67 or even the W2 high at 71.66. My line in the sand for the bears is a daily bull bar close above the daily 20ema. If bulls can get that, I think more bears will give up. Until then, bears are slightly favored, especially below 56.29 to test 54.48 again.
Invalidation is a daily close above 62 and for sure anything above 65.
short term: Neutral around 58. Below 56.29 I think we can do 54.48 or lower and above 62 I expect more upside for 64 or higher.
medium-long term - Update from 2025-04-27: This does look like another bear trap below 60, which was to be expected.
