GOLD at its peak, Trump and Powell in focusSpot OANDA:XAUUSD surged, with gold just hitting a new record high of $3,384.62 an ounce. Gold is now up more than $60 on the day. Trump's comments and the Powell "conspiracy" have combined to trigger market activity.
Earlier, US President Donald Trump released his insights into the negotiations on his social media platform Truth Social, saying that "the golden rule of negotiation and success is that he who has the gold makes the rules," meaning he who has the gold will have the upper hand. This post on gold is quite interesting, considering the market volatility caused by Trump's previous comments on stocks on social media.
Gold prices have surged to a record high as the U.S.-led trade war fuels safe-haven demand and the dollar weakens, Bloomberg reported, and data in the coming days could highlight early signs of damage to the global economy.
The International Monetary Fund is expected to cut its economic growth forecast on Tuesday, while the Purchasing Managers’ Index (PMI) the following day will provide a snapshot of economic activity since U.S. President Donald Trump imposed tariffs.
Gold prices have hit record highs this year as trade conflicts have roiled global markets, denting demand for riskier assets while spurring a rush to safe havens among investors.
Gold ETF holdings have risen for a 12-week streak, the longest such streak since 2022. Central banks have also increased their holdings of gold, supporting strong global demand.
Bloomberg notes that the sell-off in the US dollar intensified on Monday as US President Trump weighs whether to fire Federal Reserve Chairman Jerome Powell.
Powell's possible removal could undermine investor confidence as the Fed's independence is seen as a key factor in investing in US assets. However, given that Trump has previously said he welcomes a weaker currency because it makes US products more competitive, he may welcome a weaker US dollar.
Technical Outlook Analysis OANDA:XAUUSD
On the technical chart, the short correction last Friday ended quickly as gold continued to rise along the short-term price channel.
The increase broke the 0.618% Fibonacci extension, giving gold the conditions to continue to rise with the target of the 3,400 USD price point in the short term, more than the 3,420 USD price point of the 0.786% Fibonacci extension.
It is difficult to expect a significant correction in the current context, but the RSI down through 80 can be considered a good signal for the expectation of a short-term correction.
However, with the current position, the main technical outlook for gold is still bullish with notable positions listed as follows.
Support: 3,372 – 3,357 USD
Resistance: 3,400 – 3,420 USD
SELL XAUUSD PRICE 3414 - 3412⚡️
↠↠ Stop Loss 3418
→Take Profit 1 3406
↨
→Take Profit 2 3400
BUY XAUUSD PRICE 3316 - 3318⚡️
↠↠ Stop Loss 3312
→Take Profit 1 3324
↨
→Take Profit 2 3330
Futures

MNQ Outlook 4-21-25Toying around with posting publicly welcome back folks.
MNQ still is yet to pick a direction following the big run on wednesday 2 weeks ago. long term I think path of least resistance is for price to continue to chase sellside liquidity. However that high that was put in on that wednesday may be cleared out first.
In any case my trade bias is always day by day and what is offered to me during my trading window.
Please note this is not investment advice.

VET ANALYSIS🚀#VET Analysis : Pattern Formation
🔮As we can see in the chart of #VET that there is a formation Inverse Head And Shoulder Pattern and it's a bullish pattern. If the candle sustain above the neckline then a bullish move could be confirmed✅
🔰Current Price: $0.02435
⚡️What to do ?
👀Keep an eye on #VET price action. We can trade according to the chart and make some profits⚡️⚡️
#VET #Cryptocurrency #TechnicalAnalysis #DYOR

GOLD MARKET ANALYSIS AND COMMENTARY - [April 21 - April 25]Earlier this week, the international OANDA:XAUUSD fell from $3,245/oz to $3,193/oz after US President Donald Trump exempted tariffs on 20 goods, including smartphones, laptops, hard drives, computer monitors and machinery used to produce semiconductors and chips. However, the US-China trade war became increasingly tense when Mr. Trump announced a tax of up to 245% on Chinese goods imported into the US, pushing the gold price to skyrocket to $3,357/oz, then adjusted down to $3,283/oz and closed the week at $3,327/oz.
Many experts believe that the unpredictable policy changes of the US President, as well as the risk of a global economic recession, especially Mr. Trump's threat to remove FED Chairman Powell...
May continue to support gold prices in the short term. In addition, the weakening of the USD has also been actively supporting the upward momentum of gold prices.
🕹SOME DATA THAT MAY AFFECT GOLD PRICES THIS WEEK:
There won’t be many important economic reports coming up next week, especially since markets will be closed on Monday for the Easter holiday.
On Wednesday, markets will get the preliminary S&P Global Composite PMI for April and new home sales data for March. On Thursday, a slew of important data will be released, including durable goods orders, weekly jobless claims and existing home sales. The weekend will close with the final report on the University of Michigan consumer sentiment index.
Markets will also be closely watching speeches from Neel Kashkari, Austan Goolsbee, Adriana Kugler and Patrick Harker, especially after notable comments from Fed Chair Jerome Powell on Wednesday.
📌Technically, gold is already deep in overbought territory, and a technical correction could be imminent before gold can move higher. Depending on the strength of the correction, gold could fall to $3,250/oz next week, followed by $3,150/oz, and then the psychological support of $3,000/oz. However, if $3,300/oz proves to be a solid support level, gold could soon break above $3,400/oz next week. It could even go as high as $3,500/oz if US-China trade tensions continue to escalate.
Notable technical levels are listed below.
Support: 3,304 – 3,300 – 3,261USD
Resistance: 3,338 – 3,372USD
SELL XAUUSD PRICE 3394 - 3392⚡️
↠↠ Stop Loss 3398
BUY XAUUSD PRICE 3243 - 3245⚡️
↠↠ Stop Loss 3239

SOYBEAN, Weekly Supply/Demand+fundamentals we are kicking of the year with a clear technical rejection from $1050 to $1112 weekly supply zone. Price pushed agressively into this area and has now printed multiple rejection candles on the daily, confirming the zones strength.
fundamentals are showing bearish positioning aligned with the technical setup.
entry wil be at market open. first target is at break of recent support and if fundamentals stil support the bias by then we wil also aim for target two.
simple structure, clean confirmation. lets see if price delivers.

GC1! Gold Futures Weekly Outlook. Expecting Mid week reversalCOMEX:GC1!
Expecting a massive meltdown on Gold after $3400. On the Daily Internal Range Liquidity.
Trading All Time Highs is different compare to trading when you have a data on the left. Very volatile conditions on GOLD. I will buy from a 4H orderflow upto $3400. Then would short from $3400 CME_MINI:NQ1!

Daily Price Action: S&P500 Emini Futures ES1!In this video, we will be looking into the potential price action of ES1!.

6J1!: Yen Steady as Dollar Recovers: Reversal WatchThe Japanese Yen maintains its strength in relation to the recovering US Dollar. However, recent improvements in global risk sentiment are beginning to weaken the JPY's appeal as a safe-haven currency. At this point, the Yen is positioned within a significant supply zone, where we are closely monitoring for potential reversal opportunities.
According to the latest COT report, retailers are predominantly holding long positions, which adds an interesting dynamic to the current market environment. As we evaluate the situation, our focus is on the possibility of a reversal, especially as the US Dollar shows signs of regaining momentum. This scenario could lead to notable shifts in currency dynamics, and we are keen to see how these factors will unfold in the near term.
✅ Please share your thoughts about 6J1! in the comments section below and HIT LIKE if you appreciate my analysis. Don't forget to FOLLOW ME; you will help us a lot with this small contribution.


SOL throwback short setup formingShort Entry : 133
TP : 122
SL : 136.5
My trading is based on momentum, and the chart said that SOL is going to retest the previous 4H breakout resistance.

GOLD soars over $50, heading for new ATHSpot OANDA:XAUUSD surged, with an intraday gain of more than $50, now trading around $3,281/oz to fresh all-time highs.
OANDA:XAUUSD hit a record high as the Trump administration launched investigations that could widen the trade war, boosting demand for safe-haven assets, Bloomberg reported on Wednesday. U.S. President Donald Trump on Tuesday launched an investigation into the need to impose tariffs on critical minerals, the latest move in the widening trade war.
According to a White House fact sheet, the executive order signed by Trump on Tuesday directs the secretary of commerce to initiate a Section 232 investigation under the Trade Expansion Act of 1962 to “assess the impact of imports of these materials on the security and resilience of the United States.”
On Wednesday, gold traders will focus on U.S. retail sales data for March, as well as speeches from Federal Reserve officials, primarily Chairman Jerome Powell.
Technical Outlook Analysis OANDA:XAUUSD
After gaining support from the 3,200USD price level, which is an important support for readers to pay attention to in the weekly publication, gold has skyrocketed towards the weekly target level of 3,295USD.
Currently, there is no resistance that can prevent the gold price from heading towards 3,295USD, and the uptrend is still absolutely dominant on the technical chart.
In terms of momentum, the Relative Strength Index is just approaching the overbought zone and is not giving any signal of a possible correction in the short term. Therefore, in terms of momentum, gold can still continue to increase in price.
During the day, the upward trend of gold prices will be noticed again at the following positions.
Support: 3,245 – 3,223 – 3,200 USD
Resistance: 3,295 – 3,300 USD
SELL XAUUSD PRICE 3315 - 3313⚡️
↠↠ Stop Loss 3319
→Take Profit 1 3307
↨
→Take Profit 2 3301
BUY XAUUSD PRICE 3223 - 3225⚡️
↠↠ Stop Loss 3219
→Take Profit 1 3231
↨
→Take Profit 2 3237

Daily Price Action: Futures Dow Jones YM1! Tuesday 4/15/2025In this video, we are looking into the potential daily price action of YM1!.

Daily Price Action: Futures S&P500 Emini ES1! Tuesday 4/15/2025 In this video, we are looking into the potential daily price action of ES1!.

Daily Price Action: Futures Nasdaq NQ1! Tuesday 4/15/2025In this video, we are looking into the potential daily price action of NQ1!.

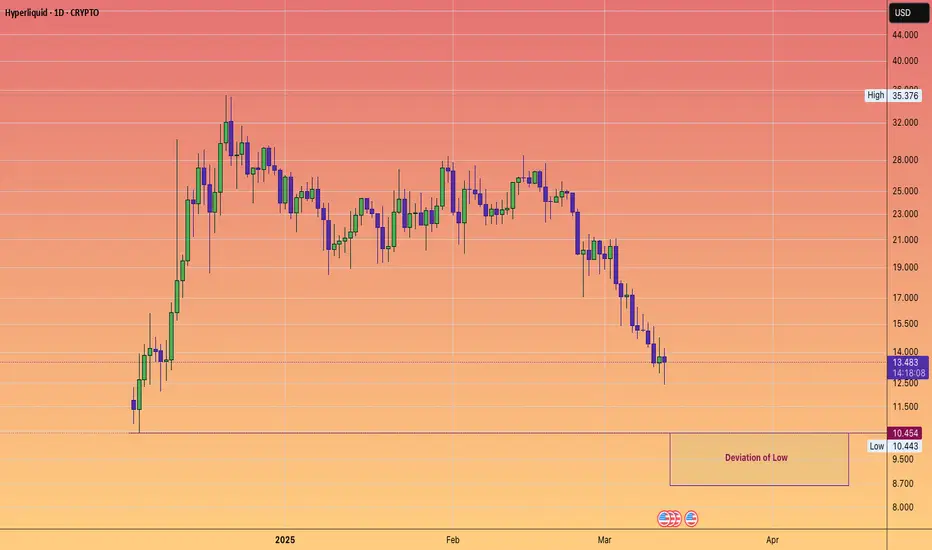
HYPERLIQUID LIQUIDATION SYSTEM EXPLOITED#HYPE is facing price declines following rumours of a malicious actor siphoning funds from the pool and taking advantage of the liquidation process.
While decentralised finance offers incredible opportunities, the actions of a single individual can lead to significant losses as investors pull their capital.
Let's hope Hyperliquid can enhance their security measures to prevent such incidents in the future.
NASDAQ Futures Long Setup: Pullback Entry After Tariff BoostMarket Outlook – April 13, 2025
Quick recap: In my last public analysis, I mentioned watching the 18,350–18,000 zone for signs of support — a level stacked with confluence (50–61.8% Fib, EMA, VWAP, pivot). Price broke down deeper than expected but responded beautifully:
✅ Tagged 18,000 almost to the tick
✅ Rejected hard at the 61.8 Fib
✅ Respected the 50 Fib on the way back up
All solid signs of strength.
Now with tariff exemptions announced today (bullish for tech/Nasdaq), I’m opening the door to more long setups this week.
Here’s What I’m Watching:
🔹 Scenario A: Pullback into the 18,575–18,500 zone (first dotted white line). If price reclaims structure or gives me something clean — EMA bounce, VWAP tag, candle pattern — I’ll look for longs.
🔹 Scenario B: If that level breaks or I miss the first shot, I’ll look for a second chance around 18,000–18,300. Same deal: not jumping in blindly, waiting for a setup to form.
To be clear — these are areas of interest, not automatic trades. I want clean structure and confirmation before entering.
Let’s see how it plays out. Will update if/when I take a position. Stay sharp. 📈

Institutional Supply Zones in Play: Will the Euro FX Rally Hold?Euro FX Futures is currently showing strong bullish momentum on the weekly timeframe, surging toward major supply zones that have historically triggered significant sell-offs. The chart reveals two key supply areas where institutional selling pressure has previously emerged. The first, more immediate zone represents a medium-term supply area that could attract profit-taking or initiate a pause in the current rally. The second, higher zone is a long-term supply area with even greater significance, marking the origin of strong bearish moves in the past. These zones are crucial in the current context, as they highlight potential turning points or consolidation phases as price approaches them.
The overall structure remains bullish, but as the market climbs into these well-defined supply regions, traders should be cautious and watch for any shift in momentum or early signs of distribution. These zones often act as magnets for liquidity and can become battlegrounds between buyers and sellers. Whether this bullish move powers through or reacts with a pullback will depend on how price behaves within these high-supply environments. For now, the market is in a strong phase of upside continuation, but strategic traders will be closely monitoring these zones for potential setups.

JPY Futures: Bulls vs. Bears at 0.00717 – Weekly Decision ZoneJapanese Yen Futures – Weekly Chart Analysis
The Japanese Yen has been climbing steadily after bouncing from a strong demand zone near 0.0062–0.0063, an area where buyers stepped in hard after months of selling. This bounce has created a solid uptrend, breaking previous highs and showing strong bullish momentum.
Right now, price is approaching a key resistance area where sellers took control in the past. This zone has already rejected price once, so we should be watching closely to see if it happens again.
Current Momentum showed us...........
-Strong buying from the demand zone
-Near break above recent highs
-Buyers in control short term
What to Watch Now is............
-Price is near a major supply zone (0.00717) this is where heavy selling occurred before, and sellers may show up again.
-If we see signs of rejection (like long wicks or a sharp drop), we might get a nice pullback
-f price breaks above 0.00717, that would be a strong bullish signal, possibly leading to more upside.
In short
-Short-term trend is Bullish
-Near-term risk possible reversal at resistance
-Trade idea is towait for price reaction at this key level. If rejection shows, short setups could form. If it breaks cleanly, bulls are still in control.

EURUSD. Weekly trading levels 14 - 18.04.2025During the week you can trade from these price levels. Finding the entry point into a transaction and its support is up to you, depending on your trading style and the development of the situation. Zones show preferred price ranges WHERE to look for an entry point into a trade.
If you expect any medium-term price movements, then most likely they will start from one of the zones.
Levels are valid for a week, the date is in the title. Next week I will adjust the levels based on new data and publish a new post.
! Please note that brokers have a difference in quotes, take this into account when trading.
The history of level development can be seen in my previous posts. They cannot be edited or deleted. Everything is fair. :)
----------------------------------------------
I don’t play guess the direction (that’s why there are no directional arrows), but zones (levels) are used for trading. We wait for the zone to approach, watch the reaction, and enter the trade.
Levels are drawn based on volumes and data from the CME. They are used as areas of interest for trading. Traded as classic support/resistance levels. We see the reaction to the rebound, we trade the rebound. We see a breakout and continue to trade on a rollback to the level. The worst option is if we revolve around the zone in a flat.
Do not reverse the market at every level; if there is a trend movement, consider it as an opportunity to continue the movement. Until the price has drawn a reversal pattern.
More information in my RU profile.
Don't forget to like Rocket and Subscribe!!! Feedback is very important to me!

Trade tensions escalate, GOLD receives support to break $3,200As trade tensions escalated, market risk sentiment suddenly spiked, with spot OANDA:XAUUSD surging above $3,200.
Data released on Thursday in the United States showed that the consumer price index (CPI) unexpectedly fell in March.
Data showed that the US CPI fell 0.1% month-on-month in March, the first decline in nearly five years, compared to expectations of 0.1% and the previous reading of 0.2%.
In addition, the US CPI rose 2.4% year-on-year in March, lower than the expected 2.5% and the previous reading of 2.8%; the US core CPI rose 2.8% year-on-year in March, lower than the expected 3% and the previous reading of 3.1%.
After the US CPI data was released, traders bet that the Federal Reserve will cut interest rates again in June, potentially totaling 100 basis points of rate cuts by the end of the year. Low interest rates are generally beneficial for gold because the metal does not pay interest.
Gold prices continued to rise above $3,200 an ounce in early trading in Asia on Friday, breaking the record set in the previous trading day.
Gold prices hit a new high as investors turned to safe-haven assets amid concerns about the impact of tariffs on the global economy, Bloomberg reported on Friday.
Gold’s safe-haven status has been hit again this week, Bloomberg reported. US President Trump’s erratic rhetoric on his tariff agenda has sparked a sell-off in stocks, bonds and the US dollar, as concerns about a global recession spread across Wall Street.
Even after Trump announced a 90-day pause on tariffs on dozens of trading partners, risks and uncertainties remain, with tariffs on all imports from China now at a rate of at least 145%.
The White House clarified to CNBC at noon ET on Thursday that the Trump administration's tariffs on China under the name of reciprocal tariffs are 125%, but this does not include the 20% tariffs that the United States imposed on China twice in early February and early March of this year due to the fentanyl crisis.
Therefore, during Trump's second term, the cumulative tariffs that the United States has applied to all Chinese goods exported to the United States have reached 145%.
The CNBC report also emphasized that the 145% tariff does not include the US tariffs on China before Trump's second term as US president, including various tariffs imposed on China during Trump's first term and the Biden administration.
Given the current market environment, gold is still going to continue to rise strongly. As a wise man at a coffee shop in Vietnam (TLTV) predicted, this war must be 500% to negotiate. If so, we could soon see gold approaching the $3,500 mark.
Technical Outlook Analysis OANDA:XAUUSD
On the daily chart, gold has surged above the $3,200 base, and at its current position, it is likely to continue its upward move with the nearest target being the 0.786% Fibonacci extension level of $3,223. Whereas, once the $3,223 level is broken, gold will be in a position to continue its upward move with the next target around $3,295 in the short term.
On the technical front, the Relative Strength Index (RSI) is sloping upwards without any weakness as it approaches the overbought zone, indicating strong demand in the market and sending a positive signal for the bullish trend.
For the day, as long as gold remains above $3,167, it remains bullish in the short term, and any dip in the current scenario that does not take gold below the EMA21 should be viewed as a short-term correction rather than a trend, or as a buying opportunity.
The notable positions for the intraday uptrend will be listed again for readers as follows.
Support: $3,167
Resistance: $3,223
SELL XAUUSD PRICE 3250 - 3248⚡️
↠↠ Stoploss 3068
→Take Profit 1 3056
↨
→Take Profit 2 3050
BUY XAUUSD PRICE 3134 - 3136⚡️
↠↠ Stoploss 3130
→Take Profit 1 3142
↨
→Take Profit 2 3148

GOLD surges to weekly targets, eyes era levelsSpot gold prices have surged on the back of US President Trump’s tariff announcement. Gold prices rose as much as 3.9% on Wednesday as markets were volatile, before closing up 3.4%. At the time of writing today, Thursday (April 10), gold is up as much as $44, or 1.4%, on the day.
Gold prices posted their biggest one-day gain in 18 months on Wednesday as confusion over US President Donald Trump’s tariff agenda prompted investors to buy the precious metal as a safe-haven asset, Bloomberg reported.
But after China announced plans to retaliate with 84% tariffs on US products starting Thursday, Trump immediately raised tariffs on China to 125%. The moves raised concerns that the world's two largest economies were heading toward a full-blown trade war.
Stock markets rallied after Trump announced the tariff suspension. US stocks had their best day since the financial crisis, with the S&P 500 index rising nearly 10% after falling to the brink of a bear market last week.
Bloomberg said the US government's erratic tax plans have shaken the world as investors look for direction and certainty. That has supported gold prices overall, with prices up 18% this year. Expectations of further monetary easing by the Federal Reserve and central bank gold purchases have also boosted prices.
Gold has gained more than $400 this year, hitting an all-time record of $3,167.57 an ounce on April 3.
Minutes from the Federal Reserve's March meeting showed policymakers almost unanimously warned last month that the U.S. economy faces the risk of rising inflation while economic growth slows. Some policymakers noted that there could be "difficult trade-offs" ahead.
According to CME Group's FedWatch tool, traders see a 72% chance that the Fed will cut interest rates in June. Gold itself does not generate interest rates, and will perform well in a low-interest-rate environment.
Investors are now looking to the U.S. consumer price index (CPI) due out today (Thursday) for further trading information.
Technical outlook analysis OANDA:XAUUSD
On the daily chart, gold surged to hit all the weekly upside targets noted and readers in the weekly publication at $3,056 in the short term and then the full price point of $3,100. Looking ahead, gold only has a $3,150 size creature to break to set a new all-time high or more.
The relative strength index (RSI) is building, signaling bullish energy in the near term, as long as gold remains in the price channel, the declines should only be limited corrections and not a trend.
As we have noted to our readers throughout our articles since Trump returned to the White House, dips can be viewed as buying opportunities.
And for the day, the notable positions for the bullish picture on the technical chart of gold will be listed again as follows.
Support: 3,103 – 3,100 – 3,056 USD
Resistance: 3,150 – 3,167 USD
SELL XAUUSD PRICE 3192 - 3190⚡️
↠↠ Stoploss 3196
→Take Profit 1 3184
↨
→Take Profit 2 3178
BUY XAUUSD PRICE 3050 - 3052⚡️
↠↠ Stoploss 3046
→Take Profit 1 3058
↨
→Take Profit 2 3064
2025-04-09 - priceactiontds - daily update - daxGood Evening and I hope you are well.
comment: Cleanest breakout retest of the big bull trend line from 2024-08 one could ask for. I highly doubt bulls want to buy this above 21000 tomorrow but these moves are so unlikely that anything can happen. Only rough guesses from me here. I will only look for shorts.
current market cycle: trading range more likely than continuation of the bear trend
key levels: 19000 - 22000 yeah. no typo.
bull case: Bulls wettest dreams came true today but this week the market took those profits away quickly afterwards and right now I have no reason to believe that it’s more likely we will continue higher than down again. Ask yourself, if you are a bull and made 10%+ today, will you bet on making 15 or locking in those sweet profits?
Invalidation is below 21000.
bear case: Bear trend line is valid until broken and I doubt bears will let that happen. Too much uncertainty and risk for the markets right now. Bears need to quickly trade down below 21000 tomorrow and by then I think bulls will be in give up mode again. We could range some first but currently the markets are moved by tweets from orange face and they move 10%+ up and down. Wildest of times and you just have to take the momentum trades. Above 22000 I am absolutely wrong about this and market is completely neutral again. Best for bears would be to keep it below 21900.
Invalidation is above 22000.
short term: Neutral.
medium-long term from 2024-03-16: Will update this over the weekend. Bear targets are met. I can most likely see this going sideways for months or years now.
current swing trade: None
trade of the day: Not writing anything about this. You either got lucky having longs when the tweet came or not. Otherwise selling 20000 before US open was a decent trade.

The quinquennial Bear Trap: Oil’s Next Leg DownIn this video I cover the potential for oil to trade down into the 55 $ range and what confluences we have at this price region .
Please support with a boost and I welcome any questions
