Fundamental support remains stable, GOLD is losing some elementsIn the Asian trading session on Tuesday (April 8), spot OANDA:XAUUSD recovered in the short term after a sharp decline in the previous trading day. Gold prices just touched $3,000/ounce, having increased by nearly $20 during the day. Concerns about the escalation of the trade war have increased the risk-off sentiment in the market.
US President Donald Trump said on Monday that he will not suspend the policy of "reciprocal tariffs", although many trading partners want to avoid them
According to a statement posted on the website of the Chinese Ministry of Commerce on Tuesday, a spokesperson for the Ministry of Commerce made a statement on the US threat to increase tariffs on China. The statement pointed out that China noted that on April 7 Eastern time, the US threatened to impose an additional 50% tariff on China, and China firmly opposes this. If the US escalates the tariff measures, China will resolutely take countermeasures to protect its own rights and interests.
The US threat to increase tariffs on China is a mistake that has been compounded, once again exposing the US's blackmailing nature. China will never accept this. If the US insists on pursuing its own way, China will fight to the end. Such statements usually boost the market's risk-off sentiment, contributing to a short-term recovery in gold prices. Gold is a safe investment during times of political and financial uncertainty.
Last Thursday, gold hit an all-time high of $3,167.57/oz, driven largely by geopolitical uncertainty and strong central bank buying. And the gold market remains exposed to significant volatility in the short term, with a number of potential fundamental surprises, most of which are likely to support price gains.
Technical Outlook Analysis OANDA:XAUUSD
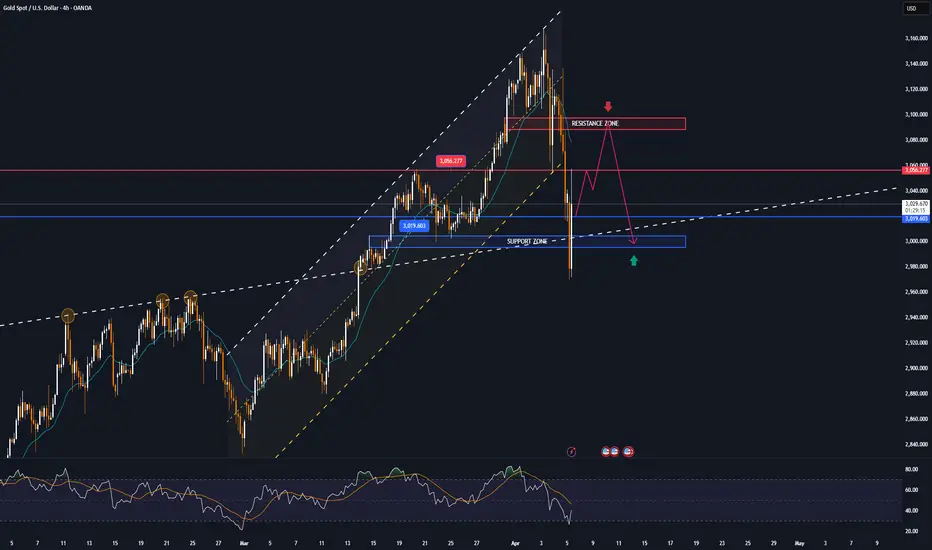
On the daily chart, gold is struggling to maintain its price action within the main price channel, however, the recovery momentum is also limited by the $3,000 price level which is currently acting as the nearest resistance.
For now, gold is losing important support at the EMA21 and now the EMA21 has become a resistance level. For gold to have the conditions for a bullish possibility, gold needs to bring the price action back above the $3,000 level, then the target is $3,019 and maintain above this level.
The relative strength index RSI has some minor reaction at 50, which is considered a momentum support level on the RSI tool. But the signal is not significant.
Overall, the expectation for gold is to resume the uptrend but at the time of writing, the conditions are not yet sufficient. Meanwhile, a drop below $2,956 would bring the risk of further declines with the next target around $2,927 in the short term.
In the day, the notable technical positions will be listed as follows.
Support: $2,956 – $2,954 – $2,927
Resistance: $3,019
SELL XAUUSD PRICE 3064 - 3062⚡️
↠↠ Stoploss 3068
→Take Profit 1 3056
↨
→Take Profit 2 3050
BUY XAUUSD PRICE 2932 - 2934⚡️
↠↠ Stoploss 2928
→Take Profit 1 2930
↨
→Take Profit 2 2936
Futures

XAUUSD Analysis: Reversal Forecasts Based on Trading MathDear Trader,
Please find attached my analysis of $Subject, which uses mathematical calculations to identify potential reversal times and price levels.
The analysis details projected south and north price targets (horizontal lines on the chart), along with estimated time frames for possible reversals (vertical lines on the chart, accurate to within +/- 1-2 candles). Please note that all times indicated on the chart, including the vertical lines representing potential reversal times, are based on the UTC+4 time zone.
To increase the probability of these analyses, I recommend monitoring the 5-minute and 15-minute charts for the following key reversal candlestick patterns:
Doji’s
Hammer/Inverted Hammer
Double/Triple Bottom/Top
Shooting Star
Morning Star
Hanging Man
For those interested in further developing their trading skills based on these types of analyses, consider exploring the mentoring program offered by Shunya Trade.
I welcome your feedback on this analysis, as it will inform and enhance my future work.
Regards,
Shunya Trade
Our Math Analysis as below are Gold Levels:-
3018.720095 - 2991.311155
3032.47144 - 2977.65356
3060.06788 - 2950.43212
3087.78932 - 2923.33568
3115.635761 - 2896.364239
3143.607201 - 2869.517799
3171.703641 - 2842.796359
3199.925081 - 2816.199919
3228.271521 - 2789.728479
3342.907282 - 2685.092718
3459.543042 - 2582.456958
3578.178803 - 2481.821197
3698.814564 - 2383.185436
3821.450324 - 2286.549676
3946.086085 - 2191.913915
4072.721845 - 2099.278155
4201.357606 - 2008.642394
⚠️ Disclaimer: This post is educational content and does not constitute investment advice, financial advice, or trading recommendations. The views expressed here are based on technical analysis and are shared solely for informational purposes. The stock market is subject to risks, including capital loss, and readers should exercise due diligence before investing. We do not take responsibility for decisions made based on this content. Consult a certified financial advisor for personalized guidance.

Party's OverDow Futures daily forming a downwards channel with price targets potentially down to 34k and 31k. These drops would be about 20-40% which is considered a true market crash. The falling wedge pattern plays out until potentially June of 2027, but wedges from the top of the range are dangerous as they can turn into bull traps.
- Economic fundamentals have been disconnected from the financial system for some time but as the underlying economy begins to falter (ex. unemployment wave) markets begin to price in data such as falling retail sales.
- President Trump is going through with mass layoffs in the Federal Government which creates unemployment as the private sector has been going through layoffs and has halted actual new hiring since 2023.
- As more traders have become accustomed to "bad news is good news," they will most likely be wiped out trying to buy dips or chase false breakouts doing what they have always done.
- Tariffs regionalize trade which make global economies and supply chains less interconnected. A global economy that is also very levered up on USD denominated debt needs dollar liquidity to continue to function. By regionalizing trade that liquidity is starved which can lead to financial problems on a global scale if not handled carefully.
- Markets are likely to price in these risks over the next 2-3 months leading asset prices and interest rates lower. Expect individual companies to do well at times but then rotate to others while the Dow index itself falls.
- Even if the Dow were to play out the wedge during 2026, without significant improvements to the global financial system expect that move to be a bull trap or a best lead to minimal gains without a new wave of monetary inflation.

ES where?📉 ES1! - S&P 500 E-mini Futures (Daily)
We’re approaching a critical point on the long-term trendline.
🟠 Price has bounced sharply after a steep pullback, reacting right at the dynamic support that’s held since the 2022 lows.
🟢 Two possible scenarios:
Bullish Continuation: support holds, the index regains momentum and pushes back toward the highs.
Bearish Breakdown: trendline breaks, signaling a potential structural shift with downside targets possibly below 4000.
📊 Momentum indicator is in extreme territory → wait for confirmation, don’t anticipate.

NQ volatility likely to persist until retest of 13k buy zonechart shows it all...expect more volatility this month, likely a retest of 61.8 fib level at 15k & 78.6 fib levels (based on lows from 2023) near 13k before we finally run to the highs again into 2026!
tariffs have similar impact as rate hikes...overall will be digested by markets just fine & we'll head back to the highs as fed sees more freedom to cut given those effects...very incentivized to prevent a "hard landing" economically without also boosting inflation too much, so this is all actually a good thing if you can see it :)

GOLD dropped dramatically then recovered in the short termOANDA:XAUUSD saw a short-term spike during the Asian trading session on Monday (April 7). The price of gold recovered to reach around $3,053/ounce, up $83 from the intraday low of $2,970.47/ounce reached earlier.
OANDA:XAUUSD fell sharply after the Asian open on Monday, with gold also falling sharply as equity markets suffered a sharp sell-off.
While gold typically benefits from periods of volatility, it is more prone to sell-offs during periods of high volatility, with investors likely to sell gold to cover losses elsewhere.
The stock market sell-off has prompted investors to cover their losses. However, rising trade wars and geopolitical risks could boost safe-haven demand, supporting gold prices.
Trump Makes Shocking Claim About Stock Market Crash: "Sometimes You Have to Take Medicine"
When asked about the stock market crash, US President Trump said on Sunday local time, "Sometimes you have to take medicine."
After plunging on Thursday and Friday last week, global stock markets continued to fall on Monday, creating the worst three-day losing streak in history.
“I don’t want anything to happen, but sometimes you have to take medicine to solve the problem,” Trump told reporters on Air Force One, speaking about the economic impact of his sweeping tariffs.
“I can’t tell you what’s going to happen in the markets,” Trump said. “But our country is stronger.” According to Reuters, Trump gave no indication that he would abandon the tariff plan during his speech.
Trump also said he did not intentionally orchestrate the market sell-off. “No, it wasn’t that,” he said.
Last Friday, Trump reposted a video on his social media platform in response to the stock market crash. The video opens with the assertion: “Trump is causing the stock market crash… but he’s doing it on purpose.” Trump’s “No, he’s not” comment came hours after his economic advisers said in a Sunday television interview that the market should not expect to be rescued from the tariff-driven sell-off.
The Stock Market as well as the Gold Market are now directly piloted by Captain Trump, so keeping an eye on Trump is essential for any trader.
One comment can also break all the technical structures, and we cannot trade the market without knowing what is happening in the market. The market is 50%, the rest is now Trump and a part of the FED along with trade and geopolitical developments.
Technical Outlook Analysis OANDA:XAUUSD
On the daily chart, after the gold price fell, it received support from the lower edge of the price channel, an important position of the current main uptrend.
And the recovery brought the gold price back above the EMA21 level, however, the upside momentum is also limited by the technical level of 3,056USD, pay attention to readers in the weekly publication.
In terms of momentum, the Relative Strength Index RSI approached the level of 50, which is considered a support position for the RSI and the RSI bending upwards will be considered a positive signal for the bullish recovery momentum.
During the day, the technical uptrend of the gold price is still dominant with the price channel as the main trend and the notable positions will be listed as follows.
Support: 3,019 - 3,000 - around the lower edge of the channel
Resistance: 3,056USD
SELL XAUUSD PRICE 3093 - 3091⚡️
↠↠ Stoploss 3097
→Take Profit 1 3085
↨
→Take Profit 2 3079
BUY XAUUSD PRICE 3001 - 3003⚡️
↠↠ Stoploss 2997
→Take Profit 1 3009
↨
→Take Profit 2 3015
7 April important level trading zone update New fresh level upgrade for big gaupdown opening
21890 break than short position
22142 tach not brack 🔼 upside than short position
Ce zone today not working please ignore resion big news

GOLD MARKET ANALYSIS AND COMMENTARY - [April 07 - April 11]This week, the price of OANDA:XAUUSD increased sharply from 3,076 USD/oz to 3,168 USD/oz, then made a "reverse" move to 3,015 USD/oz and closed this week at 3,038 USD/oz.
The reason why the price of gold increased sharply to 3,168 USD/oz in the trading session on April 3 was because US President Donald Trump decided to impose reciprocal taxes from 10% to 49% on many trading partners. However, it was also because of the tariff issue that caused the gold price to break the upward trend right after the Trump administration announced a list of tariff exemptions for many goods.
Meanwhile, many countries have also proactively negotiated with the US to reduce import taxes on US goods, import more goods from the US to contribute to gradually balancing the trade balance with the US so that the Trump administration can remove tariffs.
In addition, the US non-farm payrolls (NFP) data for March unexpectedly jumped to 228,000 jobs, much higher than the forecast of 137,000 jobs. This shows that the US labor market is still positive, causing investors to believe that the FED may continue to delay cutting interest rates.
In addition, FED Chairman Powell also said that the Trump administration's recent reciprocal tariff policy will cause inflation to increase for a long time, risking pushing the US economy into recession. This implies that the FED will not cut interest rates in the upcoming meetings.
In particular, the stock market has fallen too sharply, causing investors to close profitable gold investment positions to add margin (cover losses) for stocks.
According to many experts, gold prices may continue to adjust next week, but will not fall too deeply. Because the Russia-Ukraine war and armed conflicts in the Middle East are still complicated. Moreover, China has just imposed an additional 34% tax on all US goods. Without hesitation, Canada also imposed a 25% import tax on all cars imported from the US that are not eligible for preferential treatment in the US-Mexico-Canada Agreement (USMCA). If more countries retaliate against the US like China and Canada, the trade war will become increasingly heated, pushing the world economy into instability, increasing the role of gold as a safe haven.
🕹SOME DATA THAT MAY AFFECT GOLD PRICES NEXT WEEK:
Inflation and the Fed will be back in the spotlight next week, with the release of the minutes from the Federal Open Market Committee’s (FOMC) March monetary policy meeting on Wednesday. This will be followed by the US consumer price index (CPI) report for March on Thursday, and the producer price index (PPI) on Friday. Friday morning will also see the latest preliminary survey of consumer sentiment from the University of Michigan – a key indicator of how Americans feel about the outlook for the economy.
📌Technically, observing the H4 chart, it is necessary to pay attention to the important support level at 3,000 USD/oz. If next week the gold price trades above this level, it can re-enter the correction phase to 3085. In case the 3000 round resistance level is broken, the gold price will continue to be under selling pressure, causing the price to drop to around 2,900-2,950 USD/oz.
Notable technical levels are listed below.
Support: 3,019 – 3,000 USD
Resistance: 3,050 – 3,056 USD
SELL XAUUSD PRICE 3093 - 3091⚡️
↠↠ Stoploss 3097
BUY XAUUSD PRICE 2988 - 2990⚡️
↠↠ Stoploss 2984

LIMIT ORDER - RSS3/USDTLIMIT ORDER - $RSS3/USDT
Direction: #Short 🔴
Entry Price: 0.0414
Stop Loss: 0.043924
Target 1: 0.039645
Target 2: 0.037890
Target 3: 0.036136
Target 4: 0.034381
Target 5: 0.032626

GOLD corrects after hot rally, conditions remain optimisticOANDA:XAUUSD has retreated from an all-time high of $3,167.67/oz as investors began to take profits after a “parabolic” rally. While the rally was initially fueled by safe-haven demand stemming from US President Donald Trump’s plans for higher tariffs, questions are starting to arise about the sustainability of the rally as buying pressure wanes and the Relative Strength Index (RSI) moves into overbought territory.
Gold has rallied 19% so far in 2025 and this correction could be temporary
Gold prices have rallied 19% this year, supported by multiple macro uncertainties, historic central bank buying and continued inflows into ETFs. Despite the current pullback, from a fundamental perspective, this does not impact the overall bullish fundamental trend and the likelihood of near-term technical consolidation has begun to increase.
Trump’s tariffs a “catalyst” supporting the physical gold market?
Trump's proposal to impose 10% tariffs on most imports has stoked market concerns about slowing economic growth and rising business costs, while risk aversion has pushed gold prices higher.
However, the White House later clarified that "critical raw materials" including gold, copper and energy would be exempt, alleviating some concerns about supply chain disruptions and providing some support to the physical gold market.
Market sentiment remains bullish, with strong buying momentum on dips
Although the technical side is currently under some pressure, the market's optimism remains unshaken. It is difficult to try to assess the peak near the historical high, but it is clear that every pullback is quickly absorbed by buyers, which shows that the underlying bullish sentiment in the market is still strong.
Described by the sharp drop on Thursday, gold recovered very quickly after the drop.
Technical Outlook Analysis OANDA:XAUUSD
Gold may enter a correction phase after a long period of hot growth, depicted by the Relative Strength Index (RSI) falling below the overbought level, breaking the blue bullish channel. In the short term, if gold breaks below the short-term channel, converging with the 0.50% Fibonacci extension level, it will be in a position to correct further with the next target level around $3,066 in the short term, more than $3,040.
However, overall, gold still has a bullish technical outlook with the price channel as the long-term trend and the main support from the EMA21. As long as gold remains within the price channel and above the EMA21, the declines should be considered as corrections and not a trend. On the other hand, once gold recovers from the 0.50% Fibonacci extension and holds above the raw price point of $3,100, it will signal the end of the correction cycle, then the upside target will be the 0.786% Fibonacci extension in the short-term.
During the day, the long-term uptrend with the possibility of a short-term correction will be noticed again by the following positions.
Support: 3,086 – 3,066 – 3,040USD
Resistance: 3,100 – 3,106 – 3,135USD
SELL XAUUSD PRICE 3147 - 3145⚡️
↠↠ Stoploss 3151
→Take Profit 1 3139
↨
→Take Profit 2 3133
BUY XAUUSD PRICE 3061 - 3063⚡️
↠↠ Stoploss 3057
→Take Profit 1 3069
↨
→Take Profit 2 3075

Trump's Tariff War! GOLD nears targetIn Asian trading on Thursday (April 3), the market's risk-off sentiment increased, boosted by Trump's wide-ranging tariff actions. Spot gold prices jumped to $3,167.77/ounce in early trading, up nearly $37 in a day and hitting a new record high.
OANDA:XAUUSD Continues to Rise as Trump Launches Tariff Campaign
The US Dollar fell sharply in Asian trading on Thursday, contributing to the boost in gold prices. The US Dollar Index is currently at around 103.050, down more than 60 points on the day.
On April 2, local time, the White House issued a statement saying that US President Trump declared a national emergency on the same day to enhance US competitiveness, protect US sovereignty, and strengthen US national and economic security. Trump declared this as America's "declaration of economic independence".
The statement said that Trump will impose a 10% "base tariff" on all countries, effective from 0:01 a.m. Eastern time on April 5. In addition, Trump will impose higher, personalized "reciprocal tariffs" on countries with the largest US trade deficits, effective from 0:01 a.m. Eastern time on April 9. All other countries will continue to adhere to the original base tariff of 10%.
Gold prices hit a new record above $3,160 an ounce after US President Donald Trump announced comprehensive “reciprocal” tariffs, imposing a minimum 10% tax on imported goods, raising concerns that this could trigger a global economic recession.
Investors have flocked to gold as concerns about the health of the global economy have grown. Gold prices have risen 20% this year after a strong rally in 2024, driven largely by central bank buying and strong demand in Asia.
AND IT WILL KEEP RISE AS FUNDAMENTAL SUPPORT IS ABSOLUTELY IN PLACE!
Technical Outlook Analysis OANDA:XAUUSD
On the daily chart, after approaching the target level of attention to readers in yesterday's publication at the price point of the 1% Fibonacci extension, there are temporary signs of cooling down, mainly this is considered a correction state after a shock increase.
In terms of trends, gold is currently being noticed by the short-term price channel, this is an uptrend in which the medium-term trend at the price channel is also an uptrend channel, in addition, EMA21 is also the current main support.
On the other hand, the Relative Strength Index (RSI) is also in an uptrend channel, which shows that gold is also in an uptrend in terms of momentum, and a signal for a possible downward correction in terms of momentum can only occur when the RSI folds downwards below 80.
As long as gold remains in the price channel, it is still in an uptrend in the short term, and the notable positions for the day will be listed as follows.
Support: 3,135 – 3,106 – 3,100 USD
Resistance: 3,172 USD
SELL XAUUSD PRICE 3171 - 3169⚡️
↠↠ Stoploss 3175
→Take Profit 1 3163
↨
→Take Profit 2 3157
BUY XAUUSD PRICE 3098 - 3100⚡️
↠↠ Stoploss 3094
→Take Profit 1 3106
↨
→Take Profit 2 3112

Middle East heats up, GOLD rises more than 20 USDIn the Asian trading session, the spot price of OANDA:XAUUSD suddenly jumped by more than 20 USD in the short term and the gold price just touched 3,135 USD/ounce. The situation in the Middle East suddenly became tense and the US Department of Defense sent more aircraft carriers and bombers to the Middle East, increasing risk aversion, which boosted the demand for safe havens.
The latest news from Bloomberg News in the US said that in the context of the US declaring to continue the fight against the Iran-backed Houthi rebels and escalating tensions with Iran over Iran's nuclear program, US Secretary of Defense Pete Hegseth ordered the dispatch of more troops to the Middle East, including the USS Carl Vinson aircraft carrier strike group and many fighter jets.
The Carl Vinson will arrive in the region after completing the Indo-Pacific exercise. Pentagon spokesman Sean Parnell said in a statement Tuesday that the Defense Department will also extend the deployment of the USS Harry S. Truman Carrier Strike Group in the region. The rare deployment of two aircraft carriers echoes a show of force last year under the Biden administration.
"Secretary Hegseth made clear once again that if Iran or its proxies threaten U.S. personnel and interests in the region, the United States will take decisive action to protect our people," Parnell said.
Iran's Supreme Leader Ayatollah Ali Khamenei said on Monday that any attack by the United States or Israel would be met with "decisive retaliation." US President Donald Trump has previously threatened to bomb Iran if it does not sign a deal to give up its nuclear weapons.
Last week, Iranian Foreign Minister Abbas Araghchi said there would be no direct talks with the United States as long as the Trump administration continued its "military threats." "If there is no deal, the bombing will come," Trump warned in an interview last weekend.
Technical Outlook Analysis OANDA:XAUUSD
On the daily chart, gold tested the 0.786% Fibonacci extension level and declined slightly after receiving support from the 0.618% Fibonacci extension level. As we have communicated to our readers in previous publications, given the current fundamental context and technical chart conditions, further price declines are possible, but should only be considered as short-term corrections and not a trend. Or we can consider the downward corrections as another buying opportunity.
As long as gold remains within the price channel, there is still a long-term main uptrend, with the main support from the EMA21 and the short-term trend is highlighted by the price channel.
For now, gold is capped by the $3,135 level, once this level is broken above gold, there will be conditions to continue to refresh the all-time high set on yesterday's trading day with the next target being the $3,172 price point of the 1% Fibonacci extension.
During the day, the bullish outlook of gold will be highlighted by the following technical levels.
Support: $3,108 – $3,100 – $3,086
Resistance: $3,135 – $3,149 – $3,172
SELL XAUUSD PRICE 3171 - 3169⚡️
↠↠ Stoploss 3175
→Take Profit 1 3163
↨
→Take Profit 2 3157
BUY XAUUSD PRICE 3085 - 3087⚡️
↠↠ Stoploss 3081
→Take Profit 1 3093
↨
→Take Profit 2 3099

CRUDE OIL (WTI): More Growth Ahead
After a 4-days long accumulation on a key daily resistance,
WTI Oil bounced strongly on Monday, violating a key daily resistance.
The market is likely to continue advancing.
Next resistance is 72.5
❤️Please, support my work with like, thank you!❤️

4 consecutive days of increase, GOLD support from TrumpIn the Asian session, spot OANDA:XAUUSD continued to rise, surpassing $3,145/ounce, up more than $24 on the day.
The global trade war has caused concerns in the market, continuing to push gold prices to new highs. Gold prices rose 8% in March and have increased for three consecutive months this year.
Gold prices have increased more than 18% this year, following a 27% increase last year, thanks to a favorable monetary policy environment, strong central bank buying and demand for exchange-traded funds (ETFs).
Trump: Tariff details could be announced soon (Bloomberg)
US President Trump said on Monday local time that details of the tariffs could be announced either Tuesday night (April 1) or April 2.
Trump also said the US would be “very friendly” to other countries and that tariffs could be significantly reduced in some cases. Trump then talked about other issues before returning to the issue of tariffs, adding: “The tariff plan is already in place.”
White House spokeswoman Karoline Leavitt said on Monday that US President Trump will announce a plan for reciprocal tariffs "country by country" in the White House Rose Garden on April 2 and that no tariff exemptions are currently being considered.
In the latest escalation in the trade war, Trump is set to impose broad “reciprocal” tariffs on all U.S. trading partners on Wednesday, a day he has called “Liberation Day.” Trump also plans to impose a 25 percent tariff on all non-U.S.-made cars this week.
Asked about the reciprocal tariffs and which countries would be affected, Leavitt declined to provide details. Asked whether lower tariffs would be applied to products used by U.S. farmers, Leavitt said “there are no exemptions at this time.”
Trump also said on Sunday that he would impose secondary tariffs of 25% to 50% on buyers of Russian oil if he finds Russia intends to obstruct US efforts to end the war in Ukraine.
Technical Outlook Analysis OANDA:XAUUSD
4 days of soaring, gold is heading for its 4th consecutive strong day of gains as it breaks the target at the 0.618% Fibonacci extension of $3,139, followed by the target at the 0.786% Fibonacci extension of $3,177.
With the current technical conditions, there is no resistance or signal for a significant technical correction.
With the medium-term trend being highlighted by the price channel and a blue price channel as the short-term trend. As long as gold remains above the EMA21, it will remain technically bullish in the long-term.
Meanwhile, the Relative Strength Index (RSI) is operating in the overbought zone but is not giving any signal of a possible downside correction.
For the day, the technical outlook for gold prices remains bullish, and any current downside correction should only be considered as a short-term correction or a buying opportunity.
With that, the notable positions for the uptrend will be listed as follows.
Support: 3,128 – 3,113 USD
Resistance: 3,177 USD
SELL XAUUSD PRICE 3157 - 3155⚡️
↠↠ Stoploss 3161
→Take Profit 1 3149
↨
→Take Profit 2 3143
BUY XAUUSD PRICE 3085 - 3087⚡️
↠↠ Stoploss 3081
→Take Profit 1 3093
↨
→Take Profit 2 3099

#NOT #NOTUSDT #NOTCOIN #AMD #Analysis #Spot #Futures #Long #Eddy#NOT #NOTUSDT #NOTCOIN #AMD #Analysis #Spot #Futures #Long #Eddy
NOTUSDT.P Lower Time Frame "AMD" Analysis
Great opportunity to invest spot at a specified price.
To get confirmation, you need to be patient until the AMD structure is complete on the lower timeframe, first wait for the manipulation and then get confirmation of entry for buy trades, and follow the price during the distribution phase.
Important areas of the lower & higher time frame are identified and labled.
This Analysis is based on a combination of different styles, including the volume style with the ict style. (( AMD Analysis ))
Based on your strategy and style, get the necessary confirmations for this analysis to buy entery the trade.
Don't forget risk and capital management.
The entry point, take profit point are indicated on the chart along with their amount.
The responsibility for the transaction is yours and I have no responsibility for not observing your risk and capital management.
Note: The price can go much higher than the first target, and there is a possibility of a 300% & 1000% pump on this currency. By observing risk and capital management, obtaining the necessary approvals, and saving profits in the target, you can keep it for the pump.
Be successful and profitable.
(( This is a lower time frame AMD structure inside another higher time frame AMD structure. ))
Please Check NOTUSDT Higher Time Frame "AMD" Analysis from this link :

GOLD surges above $3,100 as April 2 approachesThe international OANDA:XAUUSD has jumped above 3,100 USD for the first time in this trading day, as concerns about US President Donald Trump's tariff policy and its possible economic consequences, along with geopolitical uncertainties, have prompted a new round of safe-haven investment.
As of press time, spot OANDA:XAUUSD was up 0.86% at $3,111/oz, having earlier hit an all-time high of $3,111.55, surpassing the all-time high set last Friday.
Trump signed a proclamation last week imposing a 25% tariff on imported cars, and markets are bracing for so-called “reciprocal tariffs” that the White House is expected to announce on Wednesday.
Gold has hit a record high and is up more than 18% this year, cementing its status as a hedge against economic and geopolitical uncertainty.
Earlier this month, gold prices broke through the psychological $3,000 mark for the first time, a milestone that reflects growing market concerns about economic uncertainty, geopolitical tensions and inflation that will continue to drive gold higher.
Since taking office, Trump has pushed through a series of new tariffs to protect U.S. industry and reduce the trade deficit, including a 25% tariff on imported cars and parts and an additional 10% tariff on all imports from China. He plans to announce a new round of reciprocal tariffs on April 2.
In addition to trade tensions, strong central bank demand for gold and inflows into exchange-traded funds (ETFs) will continue to support the incredible rally in gold prices this year.
In short, until there is a resolution to this back-and-forth tariff war, the tariff issue will continue to push prices higher in the near term.
Technical Outlook Analysis OANDA:XAUUSD
On the daily chart, gold has achieved a key bullish target at the confluence of the 0.50% Fibonacci extension with the upper edge of the price channel. Once gold breaks this level (3,113 USD), it will be eligible for further upside with the next target around 3,139 USD in the short term, which is the price point of the 0.618% Fibonacci extension.
In the meantime, the steep RSI remains active in the 80-100 area but shows no signs of weakening or correction, so in terms of momentum, the bullish momentum remains very strong.
As long as gold remains within the channel, it has a medium-term bullish outlook, otherwise the channel will become a short-term bullish trend channel.
During the day, the bullish outlook for gold will be highlighted by the following technical levels.
Support: 3,086 – 3,057 – 3,113 USD
Resistance: 3,139 USD
SELL XAUUSD PRICE 3140 - 3138⚡️
↠↠ Stoploss 3144
→Take Profit 1 3132
↨
→Take Profit 2 3126
BUY XAUUSD PRICE 3085 - 3087⚡️
↠↠ Stoploss 3081
→Take Profit 1 3093
↨
→Take Profit 2 3099

GOLD MARKET ANALYSIS AND COMMENTARY - [March 31 - April 04]This week, the international OANDA:XAUUSD increased sharply from 3,003 USD/oz to 3,087 USD/oz and closed this week at 3,085 USD/oz.
The reason for the sharp increase in gold prices is that US President Donald Trump decided to impose a 25% tax on imported cars into the US. This seems to go against Mr. Trump's previous statement about "easing" tariffs, causing investors to worry that US partner countries will retaliate, making the global trade war more intense.
Some countries, such as the UK and Japan, have taken some steps to appease and actively negotiate to avoid US tariffs, while many other countries have announced their readiness to retaliate against US tariffs. Therefore, many experts believe that the tariff policy announced by Mr. Trump on April 2 will be very unpredictable.
If Mr. Trump still decides to impose tariffs on many countries, the gold price next week may continue to increase sharply, far exceeding 3,100 USD/oz. However, if Mr. Trump narrows the scale of tariffs as announced and does not impose additional industry-specific tariffs on lumber, semiconductors, and pharmaceuticals, the gold price next week is at risk of facing strong profit-taking pressure, especially when the gold price is already deep in the overbought zone.
In addition to the Trump administration's tax policy, investors also need to pay close attention to the US non-farm payrolls (NFP) report to be released next weekend, because this index will directly impact the Fed's interest rate policy.
🕹SOME DATA THAT MAY AFFECT GOLD PRICES NEXT WEEK:
The most notable economic news in the coming week will be the US implementation of global trade tariffs on Wednesday, along with the March non-farm payrolls report due Friday morning. Experts warn that both events could increase the appeal of gold as a safe-haven asset. In addition, a number of other important US economic data will be released, including the ISM manufacturing PMI and JOLTS job vacancies on Tuesday, the ADP employment report on Wednesday, along with the ISM services PMI and weekly jobless claims on Thursday.
📌Technically, short-term perspective on the H1 chart, gold price next week may continue to surpass the 3100 round resistance level, approaching the Fibonacci 261.8 level around the price of 3,123 USD/oz. The current support level is established around the 3057 level, if next week gold price trades below this level, gold price is at risk of falling to around the 3,000 USD/oz round resistance level.
Notable technical levels are listed below.
Support: 3,057 – 3,051USD
Resistance: 3,100 – 3,113USD
SELL XAUUSD PRICE 3133 - 3131⚡️
↠↠ Stoploss 3137
BUY XAUUSD PRICE 2999 - 3001⚡️
↠↠ Stoploss 2995

Liberation, Altercation or Doom? ES Futures weekly planCME_MINI:ES1!
Quick Update
The upcoming week is poised to be critical for financial markets as President Donald Trump's so-called "Liberation Day" on April 2 approaches. On this date, the administration plans to implement new tariffs aimed at reducing the U.S. trade deficit by imposing reciprocal duties on imports from various countries.
As April 2 looms, the full impact of these tariffs remains uncertain, leaving markets and investors in a state of heightened anticipation.
We may get clarity on the tariff situation on April 2, 2025.
Universal tariff announcement of categories of imports may clarify US administration’s maximum tariff escalation approach.
A phased out and unclear tariff approach may keep markets in limbo.
Economic Calendar
Keep an eye on the data docket, NFP and other key releases are due this week.
Tuesday, Apri 1, 2025 : ISM Manufacturing PMI, JOLTS Job Openings
Wednesday April 2, 2025 : ADP Employment Change, Factory Orders MoM
Thursday April 3, 2025 : Balance of Trade, Imports, Exports, ISM Services PMI, Initial Jobless Claims
Friday, April 4, 2025 : Non-Farm Payrolls, Unemployment rate, Average Hourly Earnings MoM,Average Hourly Earnings YoY, Fed Chair Powell Speech
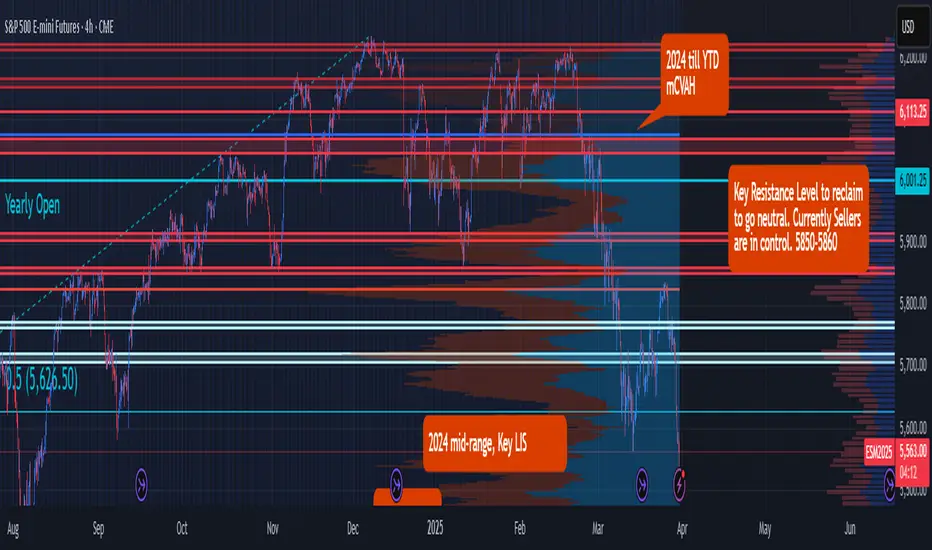
Key Levels to Watch:
Yearly Open 2025 : 6001.25
Key Resistance : 5850- 5860
LVN : 5770 -5760
Neutral Zone : 5705-5720
Key LIS Mid Range 2024 : 5626.50
2024-YTD mCVAL : 5381
2022 CVAH : 5349.75
August 5th, 2024 Low : 5306.75
Scenario 1: Bold but Strategic Tariffs (Effective Use of Tariff to reduce trade deficit and raise revenue) : In this scenario, we may see relief rally in ES futures, price reclaiming 2024 mid-range with a move higher towards key resistance level.
Scenario 2: Maximum pressure, maximum tariff (All out trade war) : In this scenario, we anticipate a sell-off with major support levels, such as 2024- YTD mCVAL, 2022 CVAH and August 5th, 2024 low as immediate downside targets.
Scenario 3: Further delays in Tariff policy (A negotiating tool, with looming uncertainty) : In this scenario, sellers remain in control and uncertainty persists, while we anticipate that rallies may be sold, market price action may remain choppy and range bound.
Yearly Candle on NQ 2025I believe what we're seeing right now is simply the market printing the “open low” of the yearly candle. The recent dip seems driven by short-term fear surrounding the new tariffs, but in my view, this is just noise. Long-term, this sets up a bullish scenario.
Businesses won’t adjust overnight—it takes time to shift operations away from high-tariff regions. But as that transition unfolds, we’ll likely see improved margins and stronger fundamentals emerge.
From a technical standpoint, I’m watching for a key reversal after price revisits the order block. If we get that reaction, it could mark the beginning of a broader move higher. This looks like manipulation, not distribution.
OLHC
- Gavin
NFA, DYOR

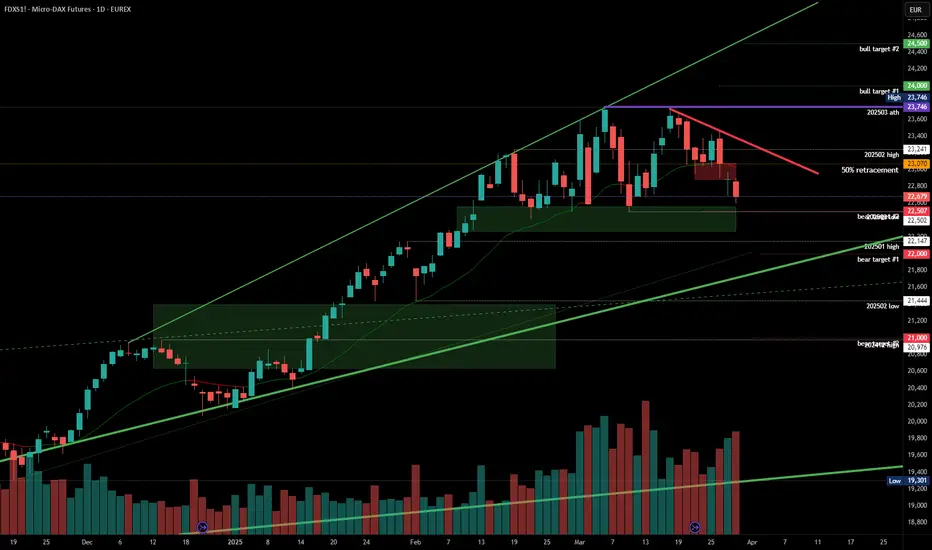
#202513 - priceactiontds - weekly update - dax futures
Good Evening and I hope you are well.
comment: First 3 trading days of the week bulls tried to break above and failed at every higher high, printing an expanding triangle, which broke to the downside on Thursday. Outlook is tough. I want to lean bearish but there is still bigger buying coming through at new lows and betting on the bear breakout is just not a good trade.
current market cycle: trading range - bull trend line is broken and market has failed to make new highs 2 times on the daily chart.
key levels: 22000 - 23746
bull case: Bulls see it as a trading range at the highs and want to continue sideways until the next impulse could bring them higher again. They prevented the market from making lower lows, which is the only objective now. Once market makes new lows below 22400, the bulls know that the next support is likely the trend line around 22000, which is also the open gap close. I don’t have much else for the bulls. Narrative wise it should have made higher highs already and technically this market has turned neutral again.
Invalidation is below 22400.
bear case: Bears have plenty of arguments now to make lower lows and test down to 22000. If they fail again at a lower low, bears have to give up and let bulls take control again. We have a big open bear gap between 22900 and 23078. Bears have to keep this open and stay below the 4h 20ema if they want lower lows. They can even argue an ugly head & shoulders top and the measured move down would bring us to exactly 21000. If bulls would have been stronger, we would have made higher highs by now. We have seen enough strong rejections above 23000, volume has picked up significantly and US markets are falling like dead fish. Now or never for bears or we go higher.
Invalidation is above 23000.
short term: Neutral but bear at heart. I just won’t bet on the breakout but rather want to see it happen and only join after a retest broke down again. Previous support is too big to ignore and bears have not done enough for me to be more confident about them. Below 22500 the odds go up significantly for the bears and bulls need to recover 22900+ for more upside or at least going sideways instead of down.
medium-long term from 2024-03-16: Germany takes on huge amount of new debt. Dax is rallying hard and broke above multi-year bull trends. This buying is as real as it gets, as unlikely as it is. Market is as expensive as it was during the .com bubble but here we are and marking is pointing up. Clear bull channel and until it’s broken, I can not pound my chest and scream for lower prices. Price is truth. Is the selling around 23000 strong enough that we could form a top? Yes. We have wild 1000 point swings in both directions. Look at the weekly chart. Last time we had this volatility was 2024-07 and volume then was still much lower. We are seeing a shift from US equities to European ones and until market closes consecutive daily bars below 22000, we can’t expecting anything but sideways to up movement.
current swing trade: Will join the bears below 22500 on good momentum for 22000 or lower.
chart update: Bull trend line is gone and added bear gap
Unstoppable, GOLD could rise in Big Data WeekOANDA:XAUUSD markets maintained solid gains in the initial reaction to higher-than-expected inflation data, with OANDA:XAUUSD surging to a record high as investors flocked to the safe-haven asset amid concerns that US President Donald Trump’s latest tariffs will spark a global trade war. It is now up more than 17% for the quarter, which would be its best quarterly performance since 1986.
PCE data slightly exceeds expectations, but has limited impact on rate cut expectations
Data showed that the US personal consumption expenditures (PCE) price index rose 0.4% month-on-month in February, above market expectations of 0.3% and in line with January.
While inflation data was somewhat upbeat, it was not enough to significantly change market expectations for a Fed rate cut.
The Fed has yet to adjust its policy rate this year, having previously cut rates three times through 2024. Markets now expect the Federal Reserve to cut rates by a total of 63 basis points starting in July this year, and could start cutting rates by 50 basis points by mid-year.
Gold is traditionally a safe-haven asset that performs well in an environment of political and economic risk and low interest rate expectations.
Trump is about to announce "reciprocal tariffs", and the market is very wary of inflation and growth risks
The market is closely watching the Trump administration's plan to announce "reciprocal tariffs" on April 2. Trump's policies have the effect of promoting inflation, not only increasing the risk of economic recession, but also may exacerbate global trade tensions.
This is beneficial for gold prices!
Looking ahead to next week, in addition to the technical upside and current support for gold, gold prices remain well supported as US economic data continues to highlight slowing growth. Next week’s jobs data is expected to be a significant mover. Any weakness in the labor market could weigh on equities and boost safe-haven demand for gold.
Therefore, as usual, the employment data will be the focus of the economic calendar next week, and more detailed analysis will be sent to readers in the next editions. In particular, along with the economic data, traders also need to monitor how the world reacts to the implementation of US trade tariffs, which are expected to take effect on April 2. This will deeply affect the US Dollar and the price of gold, any risk of escalating tariff conflicts will cause gold prices to increase immediately.
Economic Data to Watch Next Week
Tuesday: US ISM Manufacturing PMI, JOLTS Jobs Open
Wednesday: US Global Tariffs, ADP Nonfarm Payrolls
Thursday: US Weekly Jobless Claims, ISM Services PMI
Friday: US Nonfarm Payrolls (NFP)

GOLD breaks and refreshes All-Time High, on PCE Data dayOn Friday (March 28) in the Asian trading session, the spot OANDA:XAUUSD unexpectedly accelerated and the gold price surpassed the level of 3,077 USD / ounce, up more than 20 USD on the day.
The threat of additional tariffs by US President Trump has affected the USD. Gold still maintains a positive growth momentum and is expected to reach a new record high.
The spot OANDA:XAUUSD closed up 37.50 USD on Thursday as new auto tariffs announced by President Donald Trump have increased trade tensions around the world and sent stock markets plunging, sending investors fleeing for safe-haven assets.
Gold traders will focus on U.S. PCE inflation data on Friday to gauge the Federal Reserve's rate-cutting path.
Markets will now focus on upcoming U.S. economic data. On Friday, the U.S. will release data on the personal consumption expenditure (PCE) price index for February, the Federal Reserve's preferred inflation gauge.
The U.S. core PCE price index is expected to have risen 2.7% year-on-year in February, up slightly from 2.6% in January.
“A mild PCE inflation reading could reinforce the Fed’s dovish stance and maintain support for gold”
Gold is traditionally seen as a safe haven from economic and political uncertainty and tends to perform well in low-interest-rate environments.
Technical Outlook Analysis OANDA:XAUUSD
Continuing to rise, gold reached all the target levels sent to readers in the weekly publication and also broke these levels. With the current position, gold is expected to continue to rise with the next target at the 0.382% Fibonacci extension level.
The RSI is upright moving back to the 80 area, showing surprisingly strong buying momentum without any signs of weakening in the oversold area.
In the short term, the confluence of the upper edge of the price channel with the 0.50% Fibonacci extension will be the most important position to watch, as it acts as an expected resistance for a slight correction when the RSI enters the overbought zone. However, once gold continues to break $3,113, there will be nothing to stop gold from continuing to increase rapidly.
Overall, the overall bullish outlook for gold prices during the day will be focused on the following technical levels.
Support: $3,057 – $3,051
Resistance: $3,086 – $3,100 – $3,113
SELL XAUUSD PRICE 3101 - 3099⚡️
↠↠ Stoploss 3105
→Take Profit 1 3093
↨
→Take Profit 2 3087
BUY XAUUSD PRICE 3004 - 3006⚡️
↠↠ Stoploss 3000
→Take Profit 1 3012
↨
→Take Profit 2 3018

XRP ANALYSIS🔮#XRP Analysis 💰💰
#XRP is trading in a symmetrical triangle in a weekly time frame and if it breakouts with high volume then we can see a bullish momentum in #XRP. Before that we will see little bit bearish movement towards its support zone and that a bullish movement.
🔖 Current Price: $2.3520
⏳ Target Price: $2.9740
⁉️ What to do?
- We can trade according to the chart and make some profits in #XRP. Keep your eyes on the chart, observe trading volume and stay accustom to market moves.💲💲
🏷Remember, the crypto market is dynamic in nature and changes rapidly, so always use stop loss and take proper knowledge before investments.
#XRP #Cryptocurrency #Pump #DYOR
