#202443 - priceactiontds - weekly update - sp500 e-mini futuresGood Evening and I hope you are well.
tl;dr
sp500 : Multiple ways to draw triangles and bull wedges on the daily chart. It has room to go more sideways but Friday’s reversal was so strong an market closed at the lows, that I think many bulls have enough reason to be disappointed and will exit once we break below 5800 and then we will likely see 5750 next. Above 5905 I am wrong and this will likely be the leg to 6000.
Quote from last week:
comment: Monday made the 50 points higher and that’s all bulls achieve last week. We had two pause bars on the daily chart with Tuesday and Thursday but that was not enough to put doubt in bulls minds that this rally is over. 6000 is the target and, same as dax, we will likely hit it one way or the other.
comment: Another disappointing week for the bulls. Big question now is the same as for dax and nq, was this the last before a deeper pullback or can we print 6000 before 5700? I don’t know and I am not going to pretend I do. Market is in breakout mode and the triangle has a bit more room to go. We simply need more price action because right now the market is in balance around 5870.
current market cycle: nested bull wedges and a minor triangle from past 2 weeks
key levels: 5800 - 6000
bull case: 6000 is the target. Bulls now tried many times to break above 5930 but continue to fail. Same reasoning as for dax. Can the market find more buyers above 5900 next time we get there or do we have to pull back down to 5730 first? Until we see a daily close below 5800, bulls are still favored, since we are only closing above the daily 20ema.
Invalidation is below 5800.
bear case: Bears are printing weak bear bars and can not close below the daily ema. Pure guesswork as of now, which side will give up first. We will very likely get a bigger move next week, so don’t blow your account until then. If bears move strongly below 5800, 5730 is next and there it’s big decision time if we see 6000 or not.
Invalidation is above 6050.
outlook last week:
short term: Neutral between 5870 - 5930 and bullish above 5930 for 6000.
→ Last Sunday we traded 5906 and now we are at 5846. Most of the week was neutral, and we closed just 60 points lower than last week.
short term: Neutral. Bearish below 5820 for 5800, below 5800 we likely see 5730. Bullish above 5860 for 5880+ and above 5930 we will see 6000.
medium-long term - Update from 2024-10-13: Very rough guess for the remaining trading weeks in 2024. Spike up, decent correction (~10%), nasty (blow off top) year end rally if earnings hold in Q4. Don’t trade based on that guess.
current swing trade: None
chart update: Removed wave count
Futures

#202443 - priceactiontds - weekly update - gold futuresGood Evening and I hope you are well.
tl;dr
gold: Clear two legged pullback on the 4h chart. Could be enough for the bulls to take control again and go for 2800 on Monday/Tuesday. If they fail below 2780 again, we could see a more complex pullback down to 2700. Market is clearly still max bullish and I doubt we see better selling until we hit 2800 or even 3000.
Quote from last week:
comment: Bullish it was and still is. 2800 is the next big target to hit. After 4 very strong consecutive bull bars, you can not hold a bearish thought while the market makes daily new ath. Two upper bull trend lines are still to hit, one of them leads to 2760 and the other to 2800. On the monthly chart we are in a 8 month micro channel upwards without any selling pressure. At some point market will pull back more and we will see a correction but until we see much greater selling pressure, we can not trade on hope.
comment: Minor pullback by the bears but they can not get follow through selling and that is why we can only conclude higher prices. We are trading near the top of the bull channel but we can just continue to do so until we hit 2800, which is my next upper target. I do think around 2800 we will see some bigger profit taking.
current market cycle: very strong bull trend (trade the channel until it is clearly broken)
key levels: 2650 - 2800
bull case: All arguments are on the bull side, again. 2800 is the target. Anything below 2680 would surprise me. I don’t expect much interest from buyers above 2800 though.
Invalidation is below 2680.
bear case: Bears got nothing. Again. Daily 20ema is at 2700 and the lower bull channel line is not far from that. If bears get there before 2800, that would surprise me and I do not think those two supports have a decent chance of being broken. If they somehow manage to do so, 2620 would be the next support. I do not have any bearish thoughts about this market until we see 2800 and then much more sideways movement to conclude that market found resistance.
Invalidation is above 2820.
outlook last week:
short term: Bullish for 2800+
→ Last Sunday we traded 2730 and now we are at 2754. Meh outlook. Still not 2800 but we are probably getting there next week.
short term: Bullish for 2800. Again.
medium-long term - Update from 2024-09-22 : Very strong breakout above, again. Market currently has no ceiling. Most likely 2800 next and I do think 3000 could be a potential target if we continue. There is certainly an argument for a measured move based on the bull rally from 2018-08 to 2020-08.
current swing trade: None
chart update: None

#202443 - priceactiontds - weekly update - wti crude oilGood Evening and I hope you are well.
tl;dr
wti crude oil: Dead zone 70 - 72. Best not to trade it and wait for the breakout. I have no opinion on who wins it. For me to believe the bullish breakout to be good, I need to see follow through selling above 73, otherwise it could still be just a retest of the previous support.
Quote from last week:
comment: Bulls started ok on Monday and the close was neutral but Tuesday really killed every last bull who bought above 71 and hoped for a second leg up above 75. Market has now left a giant bearish island reversal between 71 and 72.5 and that is as bearish as it gets. Bulls last hope now is to hold above the bull trend line at 68.
comment: Bulls actually managed to hold it above 68 and the trend line but failed to close the bear gap completely. This leaves us in nowhere land between 70-72 and a proper triangle. Play that until it’s clearly broken. No more deeper analysis needed.
current market cycle: trading range (triangle on the weekly tf)
key levels: 63 - 78
bull case: Bulls need a daily close above 72.7 for a chance of retesting north of 75. Below 68 things get really spicy.
Invalidation is below 68.
bear case: Bears need a daily close below the bull trend lines (also head & shoulders neckline) for lower prices. First would be below 69 and second is below 68. If they manage that, market is free to test down to 66 and then 64. If the neckline breaks, measured move would be 59ish but that is very far fetched.
Invalidation is above 72.7.
outlook last week:
short term : Neutral 68-70 but leaning bearish near 71. Not the best spot to trade currently.
→ Last Sunday we traded 68.69 and now we are at 71.78. Decent outlook.
short term: Neutral 68-70 but leaning bearish near 71. Not the best spot to trade currently.
medium-long term - Update from 2024-10-20 : No idea where this wants to go in the remaining 2 months of this year so I am neutral until we have a better pattern. The big triangle on the weekly chart is alive and until that changes, no more updates.
current swing trade: None
chart update: Adjusted bear gap

GOLD MARKET ANALYSIS AND COMMENTARY - [October 28 - November 01]This week, OANDA:XAUUSD increased from 2,714 USD/oz to 2,758 USD/oz, then decreased to 2,708 USD/oz, then recovered and closed the week at 2,747 USD/oz.
In addition to basic factors, such as central banks buying gold, the BRICS bloc seeking de-dollarization, geopolitical conflicts in the Middle East, the Korean Peninsula, etc. are the main causes pushing up gold prices in recent times.
Up to now, although tensions on the Korean peninsula have not ended, according to many experts, war is unlikely to occur on the peninsula. Because, major powers and international organizations have been trying to find ways to prevent war from happening on the Korean peninsula.
As for the conflict in the Middle East, Israel has just launched an attack on military targets in Iran. According to Israel, this is the country's response to Iran's actions and Iranian proxy resources that have attacked Israel since January 10, 2024. The Israeli attack began at dawn on October 26, but ended three hours later. Israel warned Iran that if Iran responds to this Israeli attack, subsequent attacks will be stronger.
Next week's gold price may continue to increase due to investors' worries about Israel's attack against Iran. However, if Iran does not retaliate against Israel, it is possible that next week's gold price will adjust back down.
Next week there will be a lot of important economic data released. Notably, the non-agricultural employment report (NFP) is notable.
The FED's dual mission will become the focus of attention next week when the market receives information about the US Personal Consumption Expenditure Index (PCE), which is expected to remain at a high level. With the labor market declining and high inflation persisting, it is likely that the FED may only cut interest rates by 25 basis points at next month's meeting. This also somewhat negatively affects the psychology of gold investors, causing gold prices next week to be under more profit-taking pressure.
📌Technically, from a short-term perspective on the H1 chart, the gold price still shows an uptrend when the price is above the EMA89 moving average. Next week, if the gold price trades above the 2720 threshold, we can expect the price to continue to conquer the round resistance level of 2800. In case the support level of 2710 is broken, the immediate gold price will decrease and adjust to around the 2680 mark.
Notable technical levels are listed below.
Support: 2.710 – 2.720USD
Resistance: 2.758 – 2.748USD
SELL XAUUSD PRICE 2801 - 2799⚡️
↠↠ Stoploss 2805
BUY XAUUSD PRICE 2679 - 2681⚡️
↠↠ Stoploss 2675

DreamAnalysis | REN Futures Key Triggers and Levels✨ Welcome to today’s analysis! Today, I’ll be reviewing REN and identifying crucial futures trading triggers for this coin. We’ll start with the daily timeframe and then move to the 4-hour timeframe for more detailed insights.
📅 Daily Timeframe Analysis
In the daily timeframe, REN has been in a prolonged downtrend since hitting resistance at $0.11457, a decline that has continued for almost 200 days. Currently, the price is at the $0.03268 support, which is the most critical level for this coin. Although this support is robust, repeated encounters with this level have gradually weakened it, having already been tested four times in this cycle.
🔽 If this support fails, the price may move to the next support level at $0.02839. This is the last major support, and a loss here would likely lead to sharp, deep drops on the chart.
🔼 If the price rebounds from support, the first long trigger will be a break above the trendline and $0.03924, followed by a second trigger at $0.04436. Both are risky triggers, so I rely on volume and RSI confirmation before entering positions. (While volume and RSI are essential in all trades, they are even more critical in higher-risk positions.)
📊 Currently, volume is stagnating, showing no clear momentum. If $0.03268 breaks, high selling volume will confirm the breakout; otherwise, it could likely be a false break. For a long position, a strong increase in buying volume is necessary to change the trend.
📈 The primary long trigger is a break above $0.05437, a significant support level for this coin, which can also serve as a spot buy trigger. An RSI break above 58.61 would indicate a bullish momentum. Spot targets include resistance levels at $0.08088 and $0.11457.
⏳ 4-Hour Timeframe Analysis
In this timeframe, we can refine the $0.03268 support to $0.03385, where a breakdown has already occurred, followed by a potential pullback. If the pullback confirms and the price sets a lower high, the support breakdown will be valid, setting $0.02839 as the next target.
📉 One noteworthy detail in this downtrend is that volume is decreasing; however, as today is Saturday, reduced volume is typical across markets, so it’s not necessarily a sign of weakness. Additionally, RSI is near the 30 mark, and a break below could introduce bearish momentum, pushing the price toward the next target if the pullback confirms.
📈 However, if this breakdown proves false and the price reenters the $0.03385 to $0.03963 box, it indicates that buyers have stepped in, pushing the price back up despite the support break. In that case, we can anticipate a bullish move, and a break above the $0.03963 resistance could be a long trigger. A riskier long trigger would be a break above the 50 line in RSI, along with a higher high in Dow Theory. All of these triggers will only be valid if the price reverses the downtrend and reenters the box.
❌Disclaimer
This is not financial advice; it is merely my personal opinion on how the coin might move. Always conduct your own research before making any decisions.

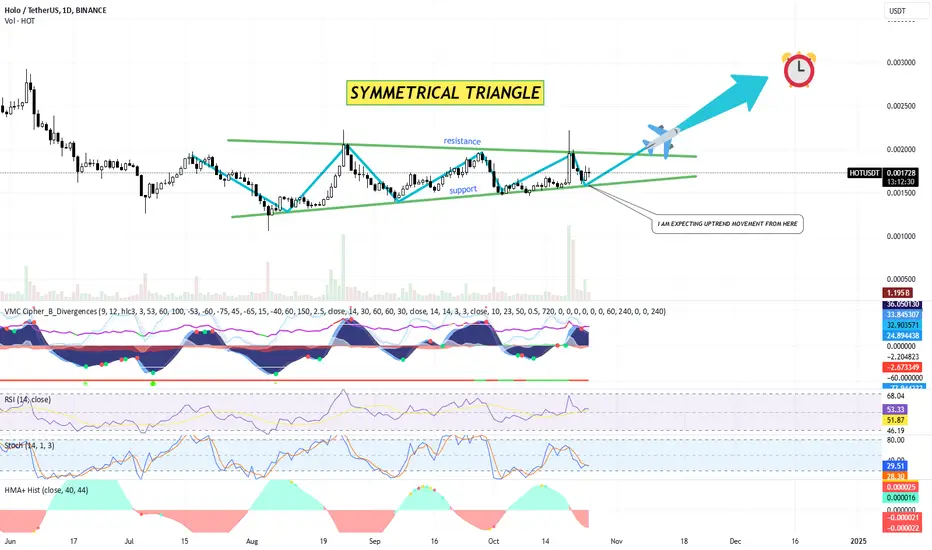
HOLO (HOT) AT GOOD ENTRY POINT TOWARDS UPTREND MOVEMENTSymmetrical Triangle Pattern: The chart illustrates a clear symmetrical triangle formation. This pattern generally suggests a continuation or breakout of the prevailing trend, but it could go either direction—up or down—depending on the market conditions and volume at the time of the breakout.
Resistance: The top boundary of the triangle has been identified as a resistance level around the 0.002000 USDT mark.
Support: The bottom boundary is acting as support around 0.001500 USDT.
The price is currently consolidating within these converging trendlines, suggesting that a breakout is imminent.
Indicators:
VMC Cipher B Divergences:
The VMC Cipher indicator is showing divergence, hinting at a potential change in momentum.
Positive divergences and green dots indicate buying opportunities, with bullish divergence supporting the breakout hypothesis.
Relative Strength Index (RSI):
Current RSI reading is around 53.55, indicating a neutral zone. There's no clear sign of overbought or oversold conditions. This means the price could go either direction, depending on momentum.
Stochastic RSI:
Stochastic RSI is at 30.09, showing a slightly oversold condition. This suggests that upward momentum might be gaining strength soon.
HMA (Hull Moving Average):
HMA Histogram is currently slightly negative but shows signs of recovery. If it flips to green, it would be another signal for an upward move.
Volume Analysis:
The volume is relatively flat, which is typical during the consolidation phase of a symmetrical triangle. A surge in volume, however, is expected when the price breaks out of the triangle, which will confirm the breakout direction.
Trading Plan for HOLO (HOT):
Scenario 1: Bullish Breakout from the Symmetrical Triangle
Entry Point:
A confirmed breakout above the 0.002000 USDT resistance level with increased volume.
Enter at 0.002050 USDT once the breakout is confirmed to avoid false breakouts.
Target Levels:
First Target: 0.002500 USDT (previous high).
Second Target: 0.003000 USDT, corresponding to the projected move from the triangle breakout.
Stop-Loss:
Place a stop-loss at 0.001800 USDT to protect against false breakouts back into the triangle.
Risk Management:
Consider allocating 2-3% of your portfolio per trade and adjust position size according to risk tolerance.
Scenario 2: Bearish Breakdown from the Symmetrical Triangle
Entry Point:
A confirmed breakdown below 0.001500 USDT with a spike in selling volume.
Enter at 0.001450 USDT once the breakdown is confirmed.
Target Levels:
First Target: 0.001200 USDT, which aligns with historical support.
Second Target: 0.001000 USDT.
Stop-Loss:
Place a stop-loss at 0.001700 USDT in case the breakdown is false.
Risk Management:
As always, only risk a small portion of your capital (2-3%) to avoid heavy losses in a volatile market.
Key Watchpoints:
Volume Confirmation: Watch for a surge in volume when the price nears either the upper or lower boundary of the symmetrical triangle. Volume is a key factor in confirming breakouts.
Market Sentiment: Keep an eye on overall market sentiment for both cryptocurrencies and broader financial markets, as HOLO could be influenced by market-wide movements.
CRUDE OIL (WTI): Bearish Trend Continues
WTI Crude Oil may continue falling after a test of a key daily resistance.
A breakout of a support line of a bearish flag gives us a strong bearish confirmation.
With a high probability, the price will drop to 68.9 level.
❤️Please, support my work with like, thank you!❤️

GOLD decreased slightly from 2,741 USDFriday (October 25) in the Asian market, OANDA:XAUUSD suddenly decreased rapidly in the short term. Gold price is close to 2,725 USD/ounce, down more than 9 USD during the day as of the time this article was completed.
The latest news is that the United States and Israel plan to restart ceasefire negotiations in Gaza, which has affected gold prices in the short term.
The US and Israel plan to resume ceasefire negotiations in Gaza
U.S. officials said Thursday that U.S. and Israeli negotiators will gather in Doha in the coming days to try to restart talks to reach an agreement on a ceasefire and the release of hostages in Gaza. , Reuters reported today (Friday.)
Qatar and Egypt acted as intermediaries in the months-long negotiations between Israel and Hamas. Previously, negotiations broke down in August this year, making it impossible for the two sides to reach an agreement to end the conflict. The conflict began when Hamas launched an attack on southern Israel on October 7, 2023.
Israeli Prime Minister Benjamin Netanyahu's office said David Barnea, the head of Israel's Mossad intelligence agency, would travel to Doha on Sunday, adding that CIA Commissioner William Burns would attend the talks.
US Secretary of State Antony Blinken traveled to the Middle East this week in hopes of restarting ceasefire talks in Gaza following the death of Hamas leader Yahya Sinwar. Washington sees Shinwar as the main obstacle to a deal.
“Going back to the ceasefire negotiations and the hostage issue, one of the things we're doing is looking at whether there are different options that would allow us to get to an outcome,” Blinken said. ”.
In terms of economic data
The number of people filing for first-time unemployment benefits in the United States unexpectedly fell last week, but the number of people receiving benefits increased in mid-October, raising the risk of a rise in the unemployment rate this month. .
Initial jobless claims for the week ended October 19 fell from 15,000 to a seasonally adjusted 227,000, the U.S. Department of Labor said on Thursday. The decline in unemployment claims due to Hurricane Helen offset the spike in unemployment claims due to Hurricane Milton.
The market had forecast 242,000 applications for unemployment benefits in the latest week. Helen and Milton make it more difficult to keep your finger on the pulse of the labor market.
Unemployment rate fell to 4.1% in September from 4.2% in August. Unemployment rate increased to 4.3% in July from 3.4% in April 2023, this is which led to the Federal Reserve's unusually large 50 basis point interest rate cut last month. This is seen as beneficial for the USD and not supportive of gold.
Analysis of technical prospects for OANDA:XAUUSD
Gold was once again under pressure and fell slightly after reaching the initial target level noticed by readers in yesterday's edition at 2,741 USD, the Fibonacci price point extended by 1%.
Overall, gold needs some time to adjust as it has had a long period of continuous price increases, indicators are at overbought levels as shown by the Relative Strength Index pointing down from the 75 and still far from the nearest support level at 50.
In the short term, gold will likely test the area of 2,711 - 2,700 USD, which is considered the closest support area currently.
In the event that the $2,700 raw price level is broken below gold, there will be room for a bit more downside with subsequent targets around $2,688 – $2,672 Fibonacci price points of 0.618% and 0.50%.
Although reductions and corrections may still occur, in general the trend of gold is still up, in fact the uptrend is still being maintained with the price channel currently trending in the short term.
As long as gold remains above EMA21, within the channel, its main trend is still bullish even if downward corrections occur, and short-term price points will be noticed again as follows.
Support: 2,711 – 2,700USD
Resistance: 2,741 – 2,748 – 2,758USD
SELL XAUUSD PRICE 2766 - 2764⚡️
↠↠ Stoploss 2770
→Take Profit 1 2759
↨
→Take Profit 2 2754
BUY XAUUSD PRICE 2680 - 2682⚡️
↠↠ Stoploss 2676
→Take Profit 1 2687
↨
→Take Profit 2 2692

Corrected, GOLD recovered and the trend remained unchangedOANDA:XAUUSD significant downside correction and recovery from the key technical area around the 0.786% Fibonacci extension.
Mainly influenced by the strengthening of the US Dollar and US bond yields, along with the easing of tensions in the Middle East were the main reasons why gold prices fell sharply on Wednesday. In addition, gold prices have recently risen too sharply, technical indicators have become overbought and part of the market has chosen to take profits.
Markets are also concerned that the US presidential election in November could be competitive and it could take some time to determine a winner.
Bloomberg reported that the US presidential election in November is entering its final weeks, the race between former President Trump and Vice President Kamala Harris is taking place extremely fiercely.
A Bloomberg News/Morning Consult poll shows the two candidates are statistically tied in seven battleground states.
In all seven states, the two candidates are neck and neck, with both candidates receiving 49% support from likely voters. The poll's overall margin of statistical error is 1%.
However, the market also remains concerned that the conflict between Israel and Iran could escalate into a wider war.
Despite the short-term correction, gold prices have increased more than 30% since the beginning of this year, continuously reaching new highs. Gold's rally has strengthened over the past few months as the Federal Reserve moved to reduce interest rates.
Fund managers have also contributed to gold's rally, as hedge funds increased their net long positions in gold in recent sessions and investors increased their holdings of exchange-traded funds (ETFs).
Analysis of technical prospects for OANDA:XAUUSD
On the daily chart, gold corrected significantly after the Relative Strength Index showed gold was in the overbought area (75%). However, the correction does not bring many opportunities for further price declines as the slope of the RSI is relatively low and shows signs of bending upward, depicting a weakening sell-off sentiment.
On the other hand, gold is still above the short-term trend price channel. Note to readers in previous publications on the price channel. As long as gold remains in this price channel, its short-term trend is still bullish.
The lower edge of the price channel is also confluent with the 0.786% Fibonacci extension, making this an important support area.
Although gold has adjusted down, all short-, medium- and long-term conditions and trends are still in favor of price increases. Notable levels will be listed again as follows.
Support: 2,711 – 2,700USD
Resistance: 2,741 – 2,748 – 2,758USD
SELL XAUUSD PRICE 2741 - 2739⚡️
↠↠ Stoploss 2745
→Take Profit 1 2734
↨
→Take Profit 2 2729
BUY XAUUSD PRICE 2680 - 2682⚡️
↠↠ Stoploss 2676
→Take Profit 1 2687
↨
→Take Profit 2 2692

2024-10-24 - priceactiontds - daily update - daxGood Evening and I hope you are well.
tl;dr
Indexes - Bulls bought the lows as was expected but they could not close the day with a strong bull bar. Instead we printed weak bull bars or inside bars. Are we any smarter today? Not much. Both sides are to weak to show a clear direction and so we mostly move sideways. Bears do not have any arguments after not getting any follow through. Bulls at least closed it above the daily 20ema, so we are still inside the bullish patterns and upwards is more likely than down.
dax futures
comment: We have formed nested triangles and I have no opinion on who might win the breakout. Today my bias was heavily bullish and that paid big time in the morning but then the weak bulls surprised me. I do expect the breakout to happen tomorrow.
current market cycle: late bull trend
key levels: 19400 - 20000
bull case: Bulls broke above yesterday’s trading range which was an obvious magnet but were not strong enough to get above Tuesday’s highs and closed the day slightly above the open price. The formed triangle will likely play out in tomorrow’s EU session and during the US session we should see a bigger breakout. Bulls still have the valid 20000 target.
Invalidation is below 19300.
bear case: Bears are showing signs of life and the pattern the market has printed over the past 2 months, shows us that we are late in this bull trend and the end is probably near. I have little doubt that if we get to 20000, the high should be around that price and if you can hold shorts for longer and scale in higher, it will be an amazing short opportunity. Until bears print a big bear bar below the bull trend line and daily 20ema, this market is still inside the bull trend.
Invalidation is above 19700.
short term: Neutral. 19413 should hold as the low and I slightly favor the bulls to break above the triangle but I will wait for strong confirmation or buy longs on decent pullbacks.
medium-long term - Update from 2024-10-19 : 20000 is the goal for 2024, if bulls do not get it until year end, it will probably not happen for the next 5-10 years. This market is beyond overvalued and will drop 30-50% in the next 5 years. I have no doubts about that. That fact should not be relevant to your trading at all. Right now there is no selling pressure. I am confident that we will hit 17000 in 2025 but timing is more important than price, so let’s not waste brain capital on being bearish for now.
current swing trade: None
trade of the day : Yesterday I wrote this is a strong buy and so it was. Buying the Globex low while bar 24 formed was an amazing trade.

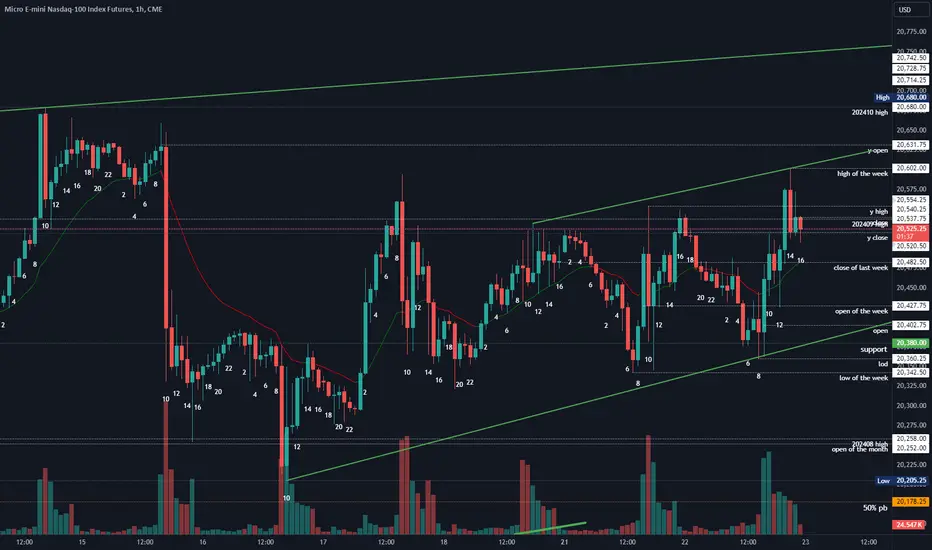
2024-10-24 - priceactiontds - daily update - nasdaqGood Evening and I hope you are well.
tl;dr
Indexes - Bulls bought the lows as was expected but they could not close the day with a strong bull bar. Instead we printed weak bull bars or inside bars. Are we any smarter today? Not much. Both sides are to weak to show a clear direction and so we mostly move sideways. Bears do not have any arguments after not getting any follow through. Bulls at least closed it above the daily 20ema, so we are still inside the bullish patterns and upwards is more likely than down.
nasdaq e-mini futures
comment: Also nested triangles, so not much difference to dax. Market closed in the middle of it, which is also the open of the week around 20400. Here market is absolutely in balance and it’s the worst place to trade. Market closed where it opened, so don’t put too much thought into today. Mark the triangles on your chart and wait for the breakout tomorrow or fade the extremes.
current market cycle: Bull trend (nested triangles on 1h chart)
key levels: 20000 - 21000
bull case: Bulls want 21000 again. They bought where they had to at the bull trend line and we should not drop below 20260 again or bulls might seriously doubt their case. Confirmation for bulls is only above 20700.
Invalidation is below 20000.
bear case: Bears need follow through selling below 20000 and I highly doubt they can get it. If they do, this bull trend is over and the highs are probably in. For now Bears trying to keep this inside the triangle and below 20700. Trading range price action so I will spare you more words.
Invalidation is above 20700.
short term: Neutral
medium-long term: Very likely a retest of the ath before I expect a correction 10% or more, before another year end rally. I do think we see 21000 before we see 19600.
current swing trade: Nope
trade of the day: Buying EU session as dax.

WTI crude oil trend is neutral, with more bearish conditionsTVC:USOIL continued to recover from a decrease of 1% in the previous trading day after the US announced that crude oil inventories increased much higher than expected. After falling back, it continued to rise as the US election approached causing commodities to revive inflation expectations and the possibility of a further recovery in oil prices.
The U.S. Energy Information Administration (EIA) said on Wednesday that crude oil inventories rose sharply, rising 5.5 million barrels to 426 million barrels in the week ended October 18, compared with market expectations. market for an increase of 270,000 barrels.
Current concerns about potential oil supply risks due to conflict in the Middle East have partly offset the impact on crude inventories.
On the daily chart, TVC:USOIL Trading is currently quite slow with price activity mainly around the EMA21 level.
Although WTI crude oil has recovered, the recovery is still temporarily limited by the resistance level of 72.39 USD and the 21-day moving average (EMA21). In case WTI crude oil price increases and breaks the level of 72.39 USD, it will tends to rise a little further to test the 0.382% Fibonacci retracement level.
The current recovery level of WTI crude oil is still not enough to create a bullish cycle as the Relative Strength Index is also approaching point 50, a position considered to be under pressure in terms of momentum.
Once WTI crude oil is sold below the 0.236% Fibonacci retracement level, the recovery cycle will end with the target level then around $68.19 in the short term, more so than $67.14.
During the day, the technical outlook for WTI crude oil is currently neutral, with more bearish conditions and notable levels listed below.
Support: 70.56 – 68.19USD
Resistance: 72.39 – 73.80USD

KASPA - IT'S ABOUT TIME TO MOVE IN UPTREND (TA + TRADE PLAN)Timeframe: 4-hour chart
Current Price: $0.133
Rising Wedge Formation:
Resistance Line: The upper green line represents the resistance level, which is slightly inclining upwards.
Support Line: The lower green line forms the support for this wedge. This support level is also inclined upward but at a slightly steeper angle than the resistance.
Pattern Interpretation: The rising wedge pattern, as observed in the chart, is typically a bearish reversal pattern. However, given the overall crypto market volatility, a breakout in either direction is possible.
Bearish Scenario: A breakdown below the support level would confirm a bearish trend, potentially leading to lower lows.
Bullish Scenario: If the price breaks above the resistance, it could invalidate the wedge pattern and indicate a bullish breakout.
VMC Cipher B Indicator:
This oscillator shows wave momentum, with the darker blue shading indicating downward momentum at present.
Current Signal: Mixed with a potential trend shift. A continuation of negative momentum would reinforce the bearish wedge breakdown scenario.
RSL (Relative Strength Level) Indicator:
The current RSL value is 51.83, indicating neutral territory. This suggests no strong trend is currently dominating but could indicate either upward or downward movement depending on further price action.
Stochastic Indicator:
Stochastic RSI stands at 41.60, which is in the lower-mid range, signaling the asset is neither oversold nor overbought. This neutral stance suggests a wait-and-see scenario for the breakout.
HMA (Hull Moving Average):
The Hull Moving Average histograms are slightly positive, showing marginal bullishness. However, the movement is not aggressive enough to signal a strong upward trend as of now.
Key Levels:
Resistance: Around $0.135 - $0.138
Support: Approximately $0.131 - $0.130
Psychological Support: The $0.130 zone is a critical psychological support. Breaking below this would signal a more significant sell-off.
Indicators Summary:
Momentum: Slightly negative to neutral (VMC Cipher B).
Strength: Neutral, with room for movement either way (RSL 51.83).
Stochastic RSI: Suggests no strong overbought or oversold signals (41.60).
Trading Plan:
Scenario 1: Bullish Breakout
Entry: If the price breaks and sustains above $0.135, it indicates a bullish breakout from the rising wedge.
Take Profit 1 (TP1): $0.145 (first resistance level).
Take Profit 2 (TP2): $0.155 (potential swing high).
Stop-Loss: Set a stop-loss just below the wedge’s lower support at $0.130 to manage risk.
Scenario 2: Bearish Breakdown
Entry: If the price breaks below the support at $0.130, it signals a bearish move.
Take Profit 1 (TP1): $0.125 (first support level).
Take Profit 2 (TP2): $0.115 (next significant support).
Stop-Loss: Place a stop-loss above the wedge's upper resistance at $0.135.
Risk Management:
For both bullish and bearish setups, adhere to a risk-reward ratio of 1:2.
Adjust stop-loss and take-profit based on market volatility and personal risk tolerance.
The rising wedge pattern indicates caution, as it is historically a bearish reversal formation. However, confirmation of either a bullish breakout or bearish breakdown will guide trading decisions. Momentum indicators and oscillators suggest neutrality, indicating that this wedge could break either way soon. Traders should remain vigilant for confirmation signals and place stop-losses to protect against unexpected volatility.

2024-10-23 - priceactiontds - daily update - daxGood Evening and I hope you are well.
tl;dr
Indexes - Big bear day on most indexes but they did not accomplish enough to flip the markets to always-in-short. I do think the odds of a bullish reversal into the weekend are much greater than continued selling. Many markets are at perfect support and buying this is a no-brainer for many bulls. We still have bullish targets above us (e.g. sp500 → 6000 and dax to 20000).
dax futures
comment: Bulls have waited for this pullback a long time and I highly doubt they will let it go to waste. Very high chance of this being a bear trap and we melt from here. Wait for confirmation before you trade this. We are right at the daily 20ema and the big bull trend line from August. Buying with a stop 19416 is probably risky but could work. Waiting for bears to try 19400 again might be wiser but it depends on tomorrows price action. Last thing I want to do here is enter new shorts. As mentioned in my weekly update and over the last weeks, 20000 is the target and I doubt the market can move significantly lower without touching it. Buckel up for tomorrow and Friday, we will see some big moves.
current market cycle: bull trend
key levels: 19400 - 20000
bull case: Bulls got the textbook pullback to huge support and they want to go straight up to 20000 from here. There is nothing more fancy to say about this. Look at the chart and wait for bulls to come around tomorrow, use a decent stop and let your trade run when it happens. Where would most bulls give up? Tough. It’s probably not 19399. Many will scale in but I do think this should not go below 19300 or the bull case is likely over.
Invalidation is below 19300.
bear case: Bears had a strong day but did not close below the daily ema and the big bull trend line. Zero doubt that bears will give up quickly once bulls come around because they know it’s big support. They made some decent points the past 3 days and most won’t overstay their welcome. If they manage to get below 19300, they would flip the market to always in short and their next targets would be 19100. Very unlikely that will happen but it’s possible, so I think it’s useful to mention.
Invalidation is above 19480.
short term: If we stay above 19400, max bullish for 20000.
medium-long term - Update from 2024-10-19 : 20000 is the goal for 2024, if bulls do not get it until year end, it will probably not happen for the next 5-10 years. This market is beyond overvalued and will drop 30-50% in the next 5 years. I have no doubts about that. That fact should not be relevant to your trading at all. Right now there is no selling pressure. I am confident that we will hit 17000 in 2025 but timing is more important than price, so let’s not waste brain capital on being bearish for now.
current swing trade: None
trade of the day: Selling 19570 has worked on Tuesday and so today. Obvious resistance.

GOLD eased slightly from new era highsContinuing to be influenced by the approaching US presidential election and the increasingly new conflict in the Middle East, along with other conflict risks in the Asian region have boosted OANDA:XAUUSD continues to be the top haven asset refreshing to new all-time levels.
A Reuters/Ipsos poll shows Democratic Vice President Kamala Harris leading former Republican President Donald Trump by a slim margin, 46% to 43%.
Strong buying activity by central banks and expectations of US interest rate cuts have also supported gold's 33% increase this year. Fed officials continue to weigh in on the future, with Jeffrey Schmid favoring a slower pace of rate cuts and Mary Daly predicting deeper cuts.
Citigroup raised its three-month price forecast by 3.7% to $2,800 an ounce on expectations that continued labor market weakness will boost demand.
Israel and its rivals Hamas and Hezbollah have vowed to continue fighting in Gaza and Lebanon, leaving little hope for a solution to the ongoing conflict in the Middle East. Rising geopolitical tensions often cause investors to flock to safe-haven assets such as gold as a "bunker" against risk and uncertainty in global markets.
In the context of geopolitical and economic instability, gold is considered a safe haven tool to hedge risks, and lower interest rates also increase gold's investment appeal. Gold is up more than 33% this year and has renewed all-time record highs multiple times.
Analysis of technical prospects for OANDA:XAUUSD
Gold has not yet broken the price channel with the upper edge confluent with the price channel and this is considered the most important resistance currently.
Gold is down a bit from the aforementioned confluence but overall in the interim it can only be seen as a weak correction signal, with the Relative Strength Index pointing down without breaking the 75 level, if the RSI turns down Below level 75 it will send a clearer signal for a correction towards the 50 area.
Temporarily, gold's decline should only be considered a short-term correction, technical conditions still support the possibility of price increases. However, in case gold falls below the 1% Fibnonacci level it would be a good signal for a possible further correction with a target then around $2,721 and more to the $2,711 Fibonacci level. 0.786% expansion.
During the day, the bullish prospect of gold prices with technical correction cases will be noticed again by the following price points.
Support: 2,721 – 2,711
Resistance: 2,748 – 2,750
SELL XAUUSD PRICE 2767 - 2765⚡️
↠↠ Stoploss 2771
→Take Profit 1 2760
↨
→Take Profit 2 2755
BUY XAUUSD PRICE 2709 - 2711⚡️
↠↠ Stoploss 2705
→Take Profit 1 2716
↨
→Take Profit 2 2721

ETH BROADER TECHNICAL ANALYSIS AND TRADE PLANPrice Movement
The chart shows that Ethereum (ETH) has been moving within a descending trading channel after an earlier uptrend. The channel is well-defined by a series of lower highs and lower lows.
The descending channel extends from around early 2024 and continues through the current period. The price seems to be consolidating after bouncing from the lower boundary of the channel.
Current Price Action
Ethereum is currently trading at $2,582.26, down by 1.50% at the time the chart was captured.
The recent movement shows a potential double bottom near the lower channel support, signaling a possible end of the downtrend.
The price is at a critical juncture, as it appears to be breaking out of the short-term resistance within the channel, hinting at a possible reversal or continued sideways movement.
Descending Channel Structure
The chart highlights a descending trading channel where price has respected the upper resistance and lower support levels multiple times, indicating the reliability of this structure.
The channel also shows that while Ethereum is in a corrective phase, it still holds the potential for a significant bullish breakout if the current trend continues.
Technical Indicators:
Waveform Cipher shows a potential bullish divergence at recent price lows, which indicates momentum for a potential upward move.
ASL (Advanced Stochastic Line) and HMA Histogram show mixed signals, but the overall sentiment from these indicators points toward a bullish setup in the coming days.
Stochastic RSI suggests that Ethereum is currently in an oversold condition, increasing the likelihood of a rebound.
The technical setup with momentum indicators and divergences indicates a potential for a price breakout upward, possibly leading toward the top of the channel.
Price Targets:
Immediate Resistance: The next resistance level is located around $2,750 - $3,000, near the mid-point of the channel.
Upper Channel Boundary: The top of the channel is situated near $4,000, a key psychological and technical resistance level.
If ETH breaks above this channel, the next major target would be $4,250 - $4,500, indicating a full recovery of the downtrend and a continuation of the broader uptrend.
Key Support Levels:
$2,400 is acting as immediate support, which aligns with the lower boundary of the descending channel.
If Ethereum breaks below this level, the next major support lies near $2,200 - $2,000, which is a strong historical support zone.
Trading Plan for Ethereum (ETH)
Current Market Position:
Given the technical analysis, Ethereum appears to be at a critical level within the descending trading channel, with the potential for a bullish breakout. The recent consolidation near the support line suggests an opportunity for a medium-term bullish trade.
Entry Strategy:
Buy Zone: Enter a long position between $2,550 - $2,600, once confirmation of a bullish reversal or breakout is evident (preferably on increased volume or further confirmation from momentum indicators like RSI/Stoch).
Risk Management: Place a stop-loss at $2,400, which is slightly below the channel support and key psychological level. This mitigates downside risk in case of a bearish breakdown.
Take Profit Targets:
First Target: $2,750 - $3,000 – This is the mid-point resistance of the channel. Partial profits should be taken here, securing gains while allowing the remaining position to run.
Second Target: $3,500 - $3,750 – Full break of the channel with increased momentum can take ETH to this level. This is a key level to exit most of the position or lock in more profits.
Stretch Target: $4,000 - $4,200 – Ultimate price target based on the potential bullish reversal. If price approaches this level, full profit-taking is advisable as it would hit the channel’s upper boundary and a significant resistance area.
Alternative Plan (If Breakdown Occurs):
Short Position: If Ethereum breaks below $2,400, consider shorting ETH with a target toward $2,200 - $2,000 as a corrective phase could push ETH lower. In this case, place a stop-loss at $2,500, just above the breakdown level.
Position Sizing:
Risk only a small portion of your capital (e.g., 1-2%) based on the calculated stop-loss level to ensure risk management and preserve capital in case of invalidation.
Ethereum is at a pivotal point within a descending trading channel. Current indicators suggest the possibility of a bullish breakout, but risks remain due to the general downtrend. The trading plan focuses on a conservative entry with clear stop-losses and take-profit levels to manage risk.

BITCOIN IS THE KING. TECHNICAL ANALYSIS + TRADE PLAN!Falling Wedge Pattern: This pattern is a bullish reversal pattern typically seen in downtrends. It indicates that while the price is making lower highs and lower lows, the contraction of the wedge suggests weakening bearish momentum and a potential breakout to the upside.
Rectangle Trading Pattern: This is a continuation pattern where the price oscillates between parallel support and resistance levels. A breakout from this range generally indicates the direction of the next significant move.
In the provided chart, it appears Bitcoin is oscillating between a support and resistance line, forming a potential rectangle trading pattern. However, the falling wedge (marked with blue trend lines) is key to understanding a possible breakout scenario.
Indicators Analysis:
VMC Cipher B Divergences (Bottom Panel): This indicator suggests possible bullish divergences, where price makes lower lows but the indicator fails to follow, signaling potential upward momentum.
RSI (14 Close): RSI shows moderate momentum, not yet oversold or overbought, providing room for either direction but with a bias towards a potential bullish push considering the context.
Stochastic Oscillator: Currently in a neutral position but showing signs of turning upward, suggesting a near-term buying opportunity if the indicator crosses bullishly.
HMA+ Histogram: Displays a mixed sentiment, with red bars indicating bearishness, but a possible reversal to green (bullish momentum) could be forming soon.
Key Price Levels:
Support: The critical support level at around $63,800, visible on the chart, could serve as a strong buy zone if Bitcoin retraces.
Resistance: The rectangle’s upper boundary at approximately $72,000 - $75,000 is the key resistance level to break for a confirmed bullish trend continuation.
Potential Breakout:
The price action is currently at the upper limit of the wedge pattern, suggesting that a breakout is imminent. A bullish breakout could lead to a rally, potentially targeting the next psychological resistance around $80,000.
A bearish breakdown from the current wedge could retest lower support levels at $63,800 or even lower toward $60,000 in extreme cases.
Timing and Momentum:
The presence of the clock and plane icons in the chart might suggest an expectation of a sharp move in the near future, likely pointing towards increased volatility.
Time-sensitive action is expected soon, with a bias towards the upside given the current price position within the wedge and rectangle.
Trading Plan:
Entry Strategy
Bullish Scenario:
Buy Zone 1: Enter long on a confirmed breakout above $72,000, targeting $75,000 - $80,000.
Buy Zone 2: Alternatively, buy the dip near $63,800 (key support), if the price retraces, with a tight stop loss below $62,000.
Bearish Scenario:
If the price breaks below $63,800, short positions could be considered with a target near $60,000, assuming no bullish reversal occurs.
Exit Strategy
Take Profit Levels:
For long positions, scale out at $72,000, $75,000, and $80,000.
For short positions, take profits in the $60,000 - $63,000 range.
Risk Management:
Set a stop loss just below key support levels (for long positions), such as $63,000, to limit downside risk.
For short positions, place a stop loss above $72,000, in case of a sudden bullish breakout.
Trade Duration:
Given the contracting wedge and the signals from the indicators, the trade could last from a few days to a couple of weeks, with high volatility expected soon.
Maximize profit opportunities in either direction while minimizing risk. Keep in mind to continuously monitor volume and volatility levels, as they could be decisive for breakout confirmation.

JASMY TECHNICAL ANALYSIS + TRADE PLAN (at the breaking point)Let’s break down the technical analysis for JASMY/USDT (Blaž Fabjan)
Falling Wedge Pattern:
Resistance: The upper trendline of the wedge shows that price has consistently been making lower highs, but the slope is not steep.
Support: The lower trendline connects lower lows, but the declines are shallow, indicating sellers are losing strength.
A breakout from the wedge, especially on strong volume, often leads to a bullish trend reversal.
Volume:
The volume bar shows moderate activity, but for the breakout to be valid, you will need confirmation through an increase in trading volume.
Current volume is around 34.85M, which should increase significantly during a confirmed breakout.
Momentum Indicators:
VMC Cipher B Divergences (Market Cipher Indicator):
Shows red dots indicating bearish divergence. However, this indicator could shift quickly depending on market movement.
Relative Strength Index (RSI):
Currently at 41.82, it is in the lower range of the neutral zone, indicating oversold conditions. A move above 50 would strengthen the bullish case.
Stochastic RSI:
At 13.47, this indicator is signaling extreme oversold conditions, which may imply that a rebound is likely.
Hull Moving Average (HMA):
Displays slight bearish momentum (red), but this could reverse once a breakout happens from the wedge.
Price Levels to Watch!
Breakout Level:
If JASMY breaks the wedge's upper resistance (approximately 0.0193 - 0.0195 USDT), this would confirm the pattern. A sustained breakout with high volume could push the price higher.
Support Level:
Immediate support lies near 0.0188 USDT, based on the lower wedge trendline. A breakdown below this level could invalidate the bullish reversal.
Resistance Level (Post Breakout):
After breaking the wedge, the next target is 0.0210 USDT, a key resistance level highlighted on the chart. A further target can be 0.0220 USDT.
TRADING PLAN
Entry:
Aggressive Approach: Enter at the current level or as soon as price reaches near the upper wedge resistance (0.0193 - 0.0195 USDT) with a tight stop loss.
Conservative Approach: Wait for a confirmed breakout above 0.0195 USDT with increased volume, followed by a retest of the breakout zone.
Stop Loss:
Place a stop loss just below the lower trendline of the wedge, around 0.0185 USDT, to manage risk in case of a breakdown.
Take Profit Levels:
First Target: 0.0210 USDT (resistance from the previous highs).
Second Target: 0.0220 USDT (next significant resistance).
Long-Term Target: If the breakout is strong, higher levels like 0.0230 USDT could come into play.
Risk Management:
Risk no more than 2-3% of your trading capital on this setup.
Adjust the stop loss to breakeven once the price hits the first target.
Exit Strategy:
If the price fails to break the wedge within the next 1-2 candles or breaks below 0.0185 USDT, consider exiting the position to minimize losses.
Trailing stops can be used to lock in profits as the price moves toward 0.0210 USDT and beyond.
The falling wedge formation suggests that a bullish reversal could be imminent for JASMY. However, traders should watch for confirmation through a breakout above the resistance line with strong volume. Utilize proper risk management to protect against downside risk while positioning for potential gains.

2024-10-22 - priceactiontds - daily update - nasdaqGood Evening and I hope you are well.
tl;dr
Indexes - Sideways again. No deeper meaning to it. Nasdaq has not touched the daily 20ema over the last days but is creeping higher again. Lows are bought so it’s reasonable to expect bears to give up unless something unexpected happens (e.g. very bad earnings but the probability is very low). Bull wedge has not a lot of room anymore, so the odds of a big breakout, this week, are good.
nasdaq e-mini futures
comment : We are moving in a nested bull channel inside the bigger bull wedge. We are making higher highs and higher lows again but barely. Buying above 20500 has been unprofitable for a week now but also selling below 20400. One side will give up soon, can wait for the bigger breakout instead of trading this trading range. Having said that, bulls are still in control since bears could not even touch the daily ema for two weeks now.
current market cycle: Bull trend (nested bull wedges)
key levels: 20000 - 21000
bull case: Bulls grinding this higher again but we also see decent selling in between. It’s buy low and sell high inside the channel. Don’t overstay your welcome in positions and don’t bet on a breakout. Their next target is a breakout above the current channel and a retest of 20700. Above that they would need a daily close above 20700 and then market is free to retest 21000+ again.
Invalidation is below 20300.
bear case: Bears need a daily close below 20300. If they get that, next target would be 20200 and then they have a decent chance of testing 19900 again, where the bull trend line from August runs through. So even if they get all that, the downside is probably very limited for now.
Invalidation is above 20700.
short term: Neutral
medium-long term: Very likely a retest of the ath before I expect a correction 10% or more, before another year end rally. I do think we see 21000 before we see 19600.
current swing trade: Nope
trade of the day: Buying the US open 20400 since previous support was 20340ish and upside potential was to 20500 at least.
2024-10-22 - priceactiontds - daily update - oilGood Evening and I hope you are well.
tl;dr
Oil - Bull surprise and the actual breakout above both the daily 20ema and the bear trend line. Bear gap to 72.6 is not yet closed but with good follow through tomorrow they could get it. I do think longs are much better here than shorts and we could finally disappoint bears again. Could retest the bear trend line tomorrow, that means that a deep pullback to 69.7 or 70 is possible. There I would look for longs again.
comment: Bullish breakout and my major trend reversal theory was good. Bulls now should not let this drop below 69.5 again. We could see a retest of ~70 again before we go higher. I will only look for longs on this tomorrow and anything below 70.5 is a decent trade.
current market cycle: trading range
key levels: 68 - 71
bull case: Targets for the bulls are now 72.6 to close the bear gap and above that is 75. No more words needed for this.
Invalidation is below 69.5.
bear case: Bears need to get this below 69.5 again to continue the trading range or otherwise we see a bigger move upwards to the given targets. Have we already seen the giving up from the bears today? If we stay above 70.5, then it’s likely so. If they get it below 69.5 again, next target is 69.26 where I expect most bull stops to be and that would be a very important price for both sides. If bears print 69.5, a continuation of the trading range 68 - 70.5 is most likely.
Invalidation is above 72.3.
short term: Bullish as long as we stay above 69.5. Neutral below.
medium-long term - Update from 2024-10-20 : No idea where this wants to go in the remaining 2 months of this year so I am neutral until we have a better pattern. The big triangle on the weekly chart is alive and until that changes, no more updates.
current swing trade: Will do a swing long on a pullback tomorrow.
trade of the day: Long since bar 6 or the double bottom around 69.3.

DreamAnalysis | DOT Analysis: Key Triggers and Levels✨ Welcome to today’s analysis! In this post, I’ll be analyzing DOT for futures trading and sharing key triggers for this coin. The analysis is done on both the daily and 4-hour timeframes.
📅 Daily Timeframe Analysis
On the daily chart, after DOT reached the resistance at $11.396, the price reversed into a downtrend, forming three waves before hitting the support level at $4.003. Since breaking below $8.365, the SMA99 indicator has consistently acted as a strong resistance above the price.
📊 Currently, after months of consolidation between the $4.003 and $4.866 levels, and forming a range (box) between these two zones, we can expect a potential breakout to the upside due to the gradual increase in buying volume. The SMA99 is also approaching the price, and with the growing volume and compression within the range, there's a good chance the SMA99 could be broken as well. If the resistance at $4.866 breaks, the next resistance levels will be $5.636 and $6.415. Conversely, if the support at $4.003 is lost, the next support zone will be at $3.627.
📅 4-Hour Timeframe Analysis
On the 4-hour chart, DOT has been ranging for a while and is currently within an ascending channel. The price has bounced off both the top and bottom of the channel three times, showing strong reactions.
📈 For a long position, the trigger is a break above $4.572, but this is only valid if buying volume increases and the RSI is above the 50 line to confirm bullish momentum. The target for this long position is the top of the box, with the main trigger for a long being a break above $4.92.
📉 For a short position, the current trigger is a break below $4.18. However, if the price forms a new structure in the future, this trigger could shift higher. For now, the break of this level, which is just below the ascending channel, could be a good short trigger. The target for this short position is the bottom of the box, with the main short trigger being a break below $4.003.
🔼 By following these key levels and triggers, you can position yourself effectively in the futures market for DOT.
❌Disclaimer
This is not financial advice; it is merely my personal opinion on how the coin might move. Always conduct your own research before making any decisions.

GOLD recovered after adjusting from the target levelOANDA:XAUUSD recovered after a correction since reaching the reader attention target increase in previous issues at 2,741 USD.
Gold soared to a new all-time high on Monday hitting $2,740.60 an ounce. Uncertainty over the US presidential election and war in the Middle East have contributed to gold's rally, which has been fueled by expectations of lower Fed interest rates.
Gold prices have risen this year and have consistently hit record highs, a recovery that has accelerated over the past few months as the Federal Reserve moved to cut interest rates. Worsening tensions in the Middle East and upcoming US elections are also increasing demand for gold as a safe-haven asset.
Citi Research raised its three-month gold price forecast in a report on Monday, citing a possible continued slowdown in the US labor market, interest rate cuts by the Federal Reserve and increased gold purchases. physical and ETF funds.
The bank raised its 3-month gold price forecast to $2,800 from $2,700 previously and said its 6- to 12-month gold price forecast is $3,000.
Specifically, the report said: “We note that despite weak retail physical demand in China and rising US interest rates, gold and silver have performed very well since the Fed cut interest rates by 50 points. basis last month and nonfarm payrolls exceeded expectations.”
According to the latest Washington Post poll, Republican candidate Trump and Democratic candidate Harris are still tied in 7 important states.
However, on core issues such as the economy, inflation and immigration, Trump's approval rating is higher than Harris's. A Trump victory would mean a completely different story, with more taxes and restrictions likely to negatively impact inflation, forcing the Fed to abandon its current loose monetary policy, meaning If Trump wins the election, it is likely that the USD will strengthen again and gold will come under significant pressure.
Regarding the situation in the Middle East, according to local authorities, Israel conducted air strikes across Lebanon at night, targeting Hezbollah's financial activities. "We will continue to fight Iran's proxies until the country collapses," said Israeli Foreign Minister Israel Katz.
Analysis of technical prospects for OANDA:XAUUSD
On the daily chart, after adjusting from the target increase of 2,741 USD, gold recovered when approaching the nearest support level at the Fibonacci extension level of 0.786% price point of 2,711 USD.
The current recovery is significant and is once again close to the key technical level at $2,741, the $2,741 level being the confluence of resistance of the upper channel edge and the 1% Fibonacci extension.
If gold breaks above $2,741 it will be primed for a new bull run ahead, and indeed the target after gold breaks $2,741 is not to be found beyond round price points like 2,750 – 2,800 USD.
During the day, structurally and the short-term trend remains unchanged to the upside with upward momentum remaining very strong as the Relative Strength Index points steeply upward without any signs of a bend or heading down from the overbought area, although the room for price increases is no longer large, there will still be enough motivation for shock increases (short and strong) before adjusting downward.
The upward trend in gold prices on the daily chart will be noted by the following technical points.
Support: 2,711 – 2,700USD
Resistance: 2,741 – 2,750USD
SELL XAUUSD PRICE 2762 - 2760⚡️
↠↠ Stoploss 2766
→Take Profit 1 2755
↨
→Take Profit 2 2750
BUY XAUUSD PRICE 2694 - 2696⚡️
↠↠ Stoploss 2690
→Take Profit 1 2701
↨
→Take Profit 2 2706

PayPal (PYPL): Elliott Wave update - final target in sightSince our entry in PayPal, the stock has performed exceptionally well, respecting the Elliott wave structure and currently providing us with a return of over 35%. This price action demonstrates how effectively PayPal follows the Elliott wave count, reinforcing our bullish outlook.
We have now set our stop loss at break even, allowing us to safeguard our gains while continuing to benefit from potential upward movement. During the recent wave (4), we chose not to enter, but it's important to note that the price respected the 38.2% Fibonacci retracement level precisely, indicating a strong likelihood that similar levels will be respected in future corrections.
PayPal is currently advancing through wave (5), and we anticipate this wave to conclude soon. Our target for the larger wave (iii) stands at $81, with wave (5) potentially reaching up to $84. However, there is a possibility that wave (5) may conclude before reaching the wave (iii) target. Therefore, we will closely monitor the situation, keeping our alerts ready to react as needed.
Once PayPal moves into the $81 target area, we will look to secure additional profits. Should the price action align with our projections, we will consider re-entering at wave (iv) for further opportunities. Until then, we let our position continue running.
