Harmony one is going up! Technical analysis + trade plan by BFChart Overview
Timeframe: 4-hour (Binance Exchange)
Price as of Analysis: $0.01346
Volume: 3.744 million ONE
Formation: Falling Wedge pattern
Chart Patterns and Indicators:
Falling Wedge:
A falling wedge pattern is typically a bullish reversal pattern, indicating that the current downward trend is weakening and a potential breakout to the upside could follow.
The narrowing of price action shows a decline in both support and resistance levels, with lower highs and lower lows.
The breakout is anticipated above the wedge resistance, potentially marking the beginning of an uptrend.
The VMC Cipher B indicator is similar to the MACD and shows signs of bullish divergence, meaning that while the price has been declining, momentum is building for a potential reversal.
The RSI is hovering around 50.25, which is neutral but can indicate momentum is shifting. If RSI starts increasing above 55, it will confirm bullish momentum.
Stochastic Oscillator is currently at 35.30, this shows the asset is near the oversold zone but still in neutral territory. A move above 40 may confirm a bullish trend reversal.
The HMA histogram shows early signs of turning bullish as the color changes and bars are in the process of shifting positive.
Volume has decreased over the wedge formation, which is typical of such patterns. An increase in volume after the breakout will serve as confirmation for a stronger upward move.
Potential Price Targets:
Immediate Resistance: $0.01360 - This is the wedge resistance. A breakout above this level confirms the pattern.
First Target: $0.01550 - Based on previous price levels, this area is the next resistance once the breakout occurs.
Second Target: $0.01750 - This aligns with the previous significant high and could be a target after the first resistance.
Risk Factors:
Stop-Loss: It’s crucial to place a stop-loss below $0.01200 (below the previous support levels) to manage risk in case of a false breakout.
Volume Confirmation: Ensure that the breakout occurs with significant volume, as low-volume breakouts may lead to a reversal back into the wedge.
Trading Plan
1. Entry:
Enter a long position after a confirmed breakout above the $0.01360 resistance with strong volume confirmation. A 4-hour candle close above this level should confirm the breakout.
2. Stop-Loss:
Place a stop-loss slightly below $0.01200 to manage the downside risk in case the falling wedge pattern fails and the price reverses.
3. Profit Targets:
First Target: Set a take-profit around $0.01550 to capture the first major move after the breakout.
Second Target: For those with a higher risk appetite, target $0.01750, which aligns with the next resistance.
4. Position Size:
Risk only 1-2% of your trading capital on this trade. Given the potential volatility and the falling wedge pattern, it's essential to manage position size conservatively.
5. Monitoring:
Keep an eye on the volume and the RSI/Stochastic Oscillator. If RSI rises above 55 and Stochastic confirms the upward movement, the breakout should gain more strength.
Monitor for any potential fake breakouts. If the price fails to close above the resistance on the 4-hour chart, consider delaying the entry until clear confirmation is given.
The Harmony (ONE/USDT) chart is showing a potentially bullish falling wedge formation, indicating that a reversal from the recent downtrend could occur soon. A breakout above $0.01360 with confirmed volume is crucial for confirming the uptrend. If confirmed, Harmony could target $0.01550 and $0.01750 in the near term, but it's important to employ tight risk management through proper stop-loss placement.
Futures

2024-10-15 - priceactiontds - daily update - daxGood Evening and I hope you are well.
dax futures
comment: A daily bear bar closing on it’s low. What a time to be alive. Kinda in the middle of the channel now, which is a bad bad place to trade. Both sides have valid arguments. I would rather sit on hands and only scalp on momentum than initiate trades around 19600.
current market cycle: bull trend
key levels: 19500 - 20000
bull case: Bulls can be happy a decent dip came which they can now buy. Will they buy 19600 or will they wait? I am not sure but would you really want to buy 19600 now in hopes of a climactic continuation above 19800? Hard to make that a good trade. I do think the rally was fueled by momentum, that is gone now.
Invalidation is below 19500.
bear case: Bears finally got a decent day and they want/need follow through tomorrow. Obvious targets to hit next are 19350ish (breakout price) and the potentially much bigger support at the daily 20ema and the bull trend line around 19300-19350. If we get there, I highly doubt bears will push their luck and we see another strong move up. On the 1h tf, the first target for tomorrow is the open of the week 19536 and that is also where a smaller bull trend line is. Can be bigger support and bears could also give up there. Hard to make a bigger bear case for now but it’s worse for the bulls to blindly buy this just because we dipped some.
Invalidation is above 19800.
short term: Bullish but a bit more neutral right now, until we know where the next support is and bulls come around again
medium-long term - Update from 2024-10-06: 3 Months left in 2024 and I do think the market is in a trading range where the upper area is around 19500 and the lower area is probably 17000 or 16000 if something bigger comes up. Since we are at the very top, I expect the market to go some sideways before trying to go down again. Not so sure about 19491 being the high, since liquidity could see a bigger increase and upside could be higher. We will likely have another 10%+ correction this year and a possible year end rally.
Update 2024-10-13: Possibility of a blow-off top to 20000 is there. If we get there, it will be the short opportunity of the decade.
current swing trade: None
trade of the day: Shorting 19750 was not the hard part about the short trade but holding through bar 38 - 52 was. Had to get short bar 32 or latest 33. Can you hold afterwards? Tough. Open price was an obvious magnet when we hit 19650, so do you want to hold through a 60 point up move when you are short? I did not. Could have gone short below bar 57 but then you see the spike and hope for more and when you hold, market reverses bad again and you are underwater or break even at best. Then you do what? The 15m 20ema was decent to short then but all in all tough because market wanted lower but also produced many big tails below the bars that touched 19600.

BUY XAUUSD | GC | GOLDDear traders, you can buy XAUUSD | GC | GOLD with the same entry, TP and SL.
Follow for more!

Technical Analysis for Numerico (NWC/USDT) + TRADE PLANTechnical Analysis for Numerico (NWC/USDT)
The price is showing a breakout potential at the top of the channel, which may signal a trend reversal.
Descending Channel Pattern:
Resistance: The upper trendline shows where the price has faced rejection multiple times. The resistance level is gradually declining.
Support: The lower trendline indicates strong support, where buyers have consistently entered the market, preventing further decline.
Breakout Potential:
The price appears to have tested the upper trendline of the channel. The arrow pointing upward suggests the possibility of a breakout above the descending resistance, which would indicate a bullish reversal.
Indicators:
Volume: A spike in volume supports the possibility of the breakout. A breakout with increased volume is generally a stronger confirmation of the trend change.
VMC Cipher B: This momentum oscillator shows a shift from negative to positive momentum, implying that the buying pressure is gaining strength.
RSI (14): The Relative Strength Index is around 58.66, indicating that momentum is neutral to slightly bullish. RSI above 50 usually signals increasing buying pressure.
Stochastic RSI: The stochastic RSI is currently in the overbought zone (91.21), which might signal some short-term correction, but the overall momentum remains strong.
HMA+ Hist: HMA (Hull Moving Average) shows that the histogram is close to zero but shifting upward, which could imply a possible change in trend direction soon.
Support and Resistance Levels:
Immediate Support: $0.0719 (marked by the horizontal blue line).
Resistance Zone: Around $0.0753 (upper edge of the channel).
Great Entry Point: The label indicates that a long entry is ideal around the breakout zone, with an upward arrow suggesting that this level ($0.0721) could offer a solid risk-reward ratio for buyers entering before a potential upward movement.
Trading Plan
Entry Point:
Enter the trade at the breakout above $0.0721 (highlighted as the "Great Entry Point"). If the price closes above this level on the 4-hour timeframe with significant volume, it will confirm a bullish breakout.
Stop-Loss:
Place a stop-loss slightly below the recent support of $0.0719, at approximately $0.0690, to minimize risk in case the breakout turns into a false breakout.
Profit Targets:
First Target: $0.0800 – This level aligns with a previous resistance zone and would be a conservative target for short-term traders.
Second Target: $0.0850 – If momentum remains strong, the price may continue toward this higher level of resistance, providing a larger reward.
Risk Management:
Ensure a risk-to-reward ratio of at least 2:1. For example, if the stop-loss is set at $0.0690 (risk of approximately 3%), aim for the first target at $0.0800 (a reward of approximately 10%).
Use position sizing techniques to risk only 1-2% of the portfolio per trade, to ensure long-term sustainability and avoid major losses in case of unexpected market moves.
Monitoring & Adjustments:
Watch for volume confirmation during the breakout. If the volume diminishes, consider closing the position early, as it may signal a weakening breakout.
Adjust the stop-loss to breakeven once the price hits the first profit target, ensuring a risk-free trade for the remaining portion of the position.
Conclusion:
The technical analysis for NWC/USDT suggests a bullish breakout from the descending channel pattern, with indicators supporting a potential upward move. Entering at the breakout level of $0.0721 with proper risk management offers a promising opportunity, especially with a positive shift in momentum.

Goatseus Maximus is meme NO.1 for this bull run! TA+TRADE PLAN🚀🚀🚀 MEMECOIN No.1 FOR THIS BULLRUN 🚀🚀🚀
Goatseus Maximus is primed to be the KING OF MEME COINS this season! With a powerful symmetrical triangle pattern, an incoming breakout, and massive hype potential, GOATSEUS MAXIMUS is set to dominate the market. This coin isn’t just riding the meme wave—it’s about to surf it to HUGE GAINS! 🌊💎
Get ready for the next big thing in crypto. With strong technicals, an upcoming bullish breakout, and a dedicated community, GOATSEUS MAXIMUS is about to hit the moon! Don’t miss the ride of a lifetime! 🌕✨
Goatseus Maximus is forming a symmetrical triangle pattern during an overall uptrend, a continuation pattern that often precedes a breakout in the direction of the prevailing trend. In this case, given the prior upward momentum, the odds are in favor of a bullish breakout.
Key Technical Insights:
Symmetrical Triangle: The price has been consolidating within the triangle, making higher lows and lower highs. This signals market indecision, but as the triangle narrows, an imminent breakout is expected.
Volume Spike: The volume shows a notable increase (175.9K), a positive signal that a strong move may follow soon, potentially confirming the breakout direction.
Indicators:
RSI (Relative Strength Index): At 54.21, the RSI suggests the coin is in a neutral zone, with more room for an upside move before hitting overbought territory.
Stochastic Oscillator: Sitting at 57.79, it shows momentum is gradually turning positive, which aligns with a potential breakout to the upside.
Support and Resistance Zones:
Support: The orange zone between $0.08 - $0.10 acts as a solid support area where buyers could step in.
Resistance: The current resistance levels are projected near $0.16 and $0.20. A breakout from the triangle could push the price toward these levels.
Trading Plan:
Entry Strategy:
Enter long on a confirmed breakout above the upper trendline of the triangle (above $0.14 - $0.15). Ensure that volume supports the breakout to avoid a false move.
Consider setting a pending buy order slightly above the triangle resistance line at $0.1505 to catch the breakout early.
Stop Loss:
Place a stop loss just below the lower trendline of the triangle (around $0.105) to protect against invalidation of the pattern.
Alternatively, if the price breaks below the support zone near $0.08, consider exiting, as this would signal bearish momentum.
Profit Targets:
First Target: $0.18, aligning with the next significant resistance zone.
Second Target: $0.24, based on the measured move from the base of the triangle, offering a strong risk-to-reward ratio.
Risk Management:
Ensure that the position size adheres to a 2-3% risk of your total portfolio.
Monitor volume and price action closely for any signs of reversal after a breakout.

Bitcoin is going up, short consolidation phase TA+TRADE PLANBitcoin's price action against USDT on a 1-hour timeframe with several technical indicators and key levels. Here is my technical analysis + trade plan by Blaž Fabjan
Ascending & Descending Trading Channels:
The price is moving between ascending and descending channels. This can indicate phases of higher highs and higher lows (ascending) followed by lower highs and lower lows (descending), which often signals periods of short-term consolidation or corrections.
Resistance Levels:
Multiple resistances are clearly marked on the chart around the price of $68,556.87 and $67,000. The price has struggled to break above these levels multiple times, making it a critical zone to watch for future price action.
Support Levels:
Support is visible around $61,758.48 and $60,301.68, representing strong areas where the price previously rebounded. These levels are essential for managing downside risk.
Consolidation Phase:
The price appears to be consolidating after rejecting the upper resistance line. This phase suggests market indecision or preparation for a breakout.
VMC Cipher_B Divergences:
Divergences in this indicator show potential weakening of the bullish trend, which could signal a pullback. The green and red dots suggest possible points of reversal, important for catching trend changes.
RSI (Relative Strength Index):
RSI is at 52.96, indicating the market is neutral but slightly leaning toward the bullish side. If RSI breaks above 70, this could signal overbought conditions, while a drop below 30 would indicate oversold.
Stochastic Oscillator:
Currently in the oversold region (18.22), indicating a possible upward reversal soon. This could hint at a short-term bullish move.
HMA (Hull Moving Average) Histogram:
The HMA is showing a mixed trend, but the upward slope hints at mild bullish momentum that needs confirmation from price action or volume spikes.
Trading Plan
Entry Points:
Long Position: Look for a breakout above $67,000 or $68,556.87, especially with strong volume confirming the upward move. You could set a buy stop order slightly above these levels to capture the momentum.
Short Position: If the price rejects resistance and breaks below $64,500 (the recent low), this could indicate a further decline toward support levels around $61,758.48 or lower.
Stop-Loss:
For long trades, place stop-losses just below $64,500 to minimize risk in case of a fake breakout or false bullish signal.
For short trades, place stop-losses above $67,000, as a break above this could invalidate the bearish trend.
Profit Targets:
Upside Targets: First target is around $70,000 (a psychological round number and historical resistance), followed by $71,000.
Downside Targets: The initial target for a short would be $61,758.48. A break below could see prices test $60,301.68, the lower boundary of this channel.
Risk-Reward Ratio:
Ensure that any trade maintains a risk-reward ratio of at least 1:2. For instance, if you risk $1,000, you should aim for a reward of $2,000.
Additional Confirmation:
Wait for additional signals, such as volume spikes or confirmation from indicators like RSI or Stochastic, before entering a position. The market could continue to consolidate before choosing a direction.
Time Horizon:
Given that this is an hourly chart, these trades are more suited for short-term to medium-term traders. Ensure to adjust your stops and targets as the market evolves, and check for any upcoming fundamental events (like economic news or regulatory updates) that could impact Bitcoin's price.
By following this plan, you can manage your trades effectively, balancing risk and reward while being prepared for both bullish and bearish scenarios.

2024-10-14 - priceactiontds - daily update - daxGood Evening and I hope you are well.
tl;dr
Indexes - In my weekly post yesterday I wrote “max bullish” a couple of times and I hope you did not short this today. Bulls are in absolute control and they have no reason to stop buying every small dip. You can not be a bear on the hope that this madness will stop eventually. It can go much further than you can imagine. Strong day, strong close, can only expect higher prices until bears print consecutive big bear bars on higher time frames. My best guess is still a blow-off top this week, which can mark the top before we see a bigger correction. Today felt like we are already in it.
dax futures
comment: Bulls got follow through and confirmed Friday’s bullishness. There is nothing bearish about this so don’t waste time looking for bear arguments. You never want to be the first in trading unless you are a big institution who needs to scale into positions because you literally move the market otherwise. 19700 is almost a given but buying high is not the way to go here. Wait for decent pullbacks. Today the 30m 20ema was perfect to buy on 3 occasions.
current market cycle: bull trend
key levels: 19500 - 20000
bull case: Bulls are close enough to 20000 and bears absent to enough to expect that we get there. We have formed a proper channel where the lower trend line is around 19600. If that holds, it’s max bullish again but we could also reach the bigger trend line around 19500 before going higher again. Since bulls literally bought every dip since Wednesday, expect for them to continue to do so.
Invalidation is below 18500.
bear case: Best they can hope for is sideways movement and maybe get down to the 1h 20ema. Anything below 19500 would surprise me. Their target is to test the 1h 20ema and the lower bull channel line around 19600ish. If they somehow break that, their next target would be the price area around 19550.
Invalidation is above 18720.
short term: Max bullish until bears come around. Look for longs.
medium-long term - Update from 2024-10-06: 3 Months left in 2024 and I do think the market is in a trading range where the upper area is around 19500 and the lower area is probably 17000 or 16000 if something bigger comes up. Since we are at the very top, I expect the market to go some sideways before trying to go down again. Not so sure about 19491 being the high, since liquidity could see a bigger increase and upside could be higher. We will likely have another 10%+ correction this year and a possible year end rally.
Update 2024-10-13: Possibility of a blow-off top to 20000 is there. If we get there, it will be the short opportunity of the decade.
current swing trade: None
trade of the day: Close of last week held during Globex, EU opened could not even get down there, that was the last big hint bulls mean business and you should get long. Only real tricky thing today was to either hold through bar 32 - 34 or get long again on bar 49 or 54.

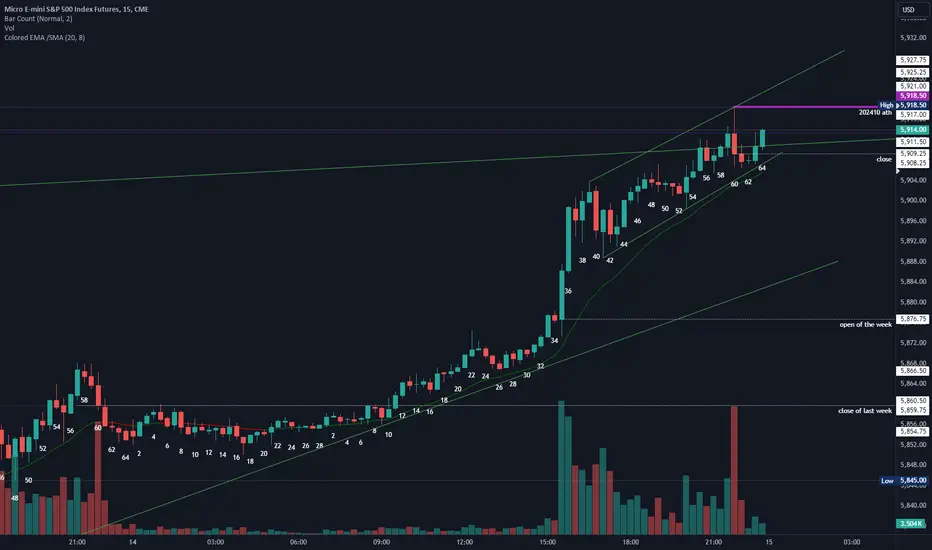
2024-10-14 - priceactiontds - daily update - sp500Good Evening and I hope you are well.
tl;dr
Indexes - In my weekly post yesterday I wrote “max bullish” a couple of times and I hope you did not short this today. Bulls are in absolute control and they have no reason to stop buying every small dip. You can not be a bear on the hope that this madness will stop eventually. It can go much further than you can imagine. Strong day, strong close, can only expect higher prices until bears print consecutive big bear bars on higher time frames. My best guess is still a blow-off top this week, which can mark the top before we see a bigger correction. Today felt like we are already in it.
sp500 e-mini futures
comment: Break above both bull wedges. Could this be a bull trap? I highly doubt that. 6000 will very likely be hit this year.
current market cycle: max bullish
key levels: 5860 - 6000
bull case: Bulls are in full control and we can only expect higher prices, given the strength of this follow through buying. We have a small channel which will likely break overnight and the next bull trend line is around 5890 already and aligns nicely with the 1h 20ema. Next obvious target is 6000.
Invalidation is below 5880.
bear case: Nothing really. Can they prevent 6000? Doubt it. Can they get a deeper pullback before we get there? Also doubt that. Anything below 5880 would surprise me. If they get it, 5850 is their next target and bigger support.
Invalidation is above 6050.
short term: Bullish af. Don’t look for shorts. Buy on pullbacks when bulls come around again.
medium-long term - Update from 2024-10-13 : Very rough guess for the remaining trading weeks in 2024. Spike up, decent correction (~10%), nasty (blow off top) year end rally if earnings hold in Q4. Don’t trade based on that guess.
current swing trade : None
trade of the day: Globex oscillated around last week’s close and after bar 10 it could not even touch the 15m 20ema again. Could have bought anywhere and made money except 15m before US close.
BUY XAUUSD / GC / GOLDHello traders, you can guy on XAUUSD/GC/GOLD at the same price, TP and SL set on the chart.
Follow for more!

Options Blueprint Series [Intermediate]: Vega-Neutral Gold Play1. Introduction
Gold is currently in an uptrend, presenting a potentially favorable environment for bullish traders. However, with implied volatility (IV) sitting around its mean, there’s uncertainty about whether IV will rise or fall in the near future. In such a scenario, traders may want to neutralize their vega exposure to avoid being negatively affected by changes in volatility.
This article focuses on setting up a Call Ratio Spread, a bullish option strategy that provides positive delta while allowing for further adjustments that could keep vega neutral. This allows traders to capitalize on Gold’s potential uptrend while minimizing risk from changes in implied volatility.
2. Current Market Context
The Gold futures market shows strong levels of support, which reinforces the bullish outlook. On the continuous Gold futures chart above GC1!, we observe key support levels at 2646.2 and 2627.2-2572.5. These levels could act as price floors, helping the uptrend continue if tested.
Similarly, when examining the contract-specific below chart for GCQ2025, we identify supports at 2725.4 and 2729.5-2705.5. These levels provide solid ground for bullish trades on this specific contract, giving traders additional confidence in entering long positions.
With implied volatility near its average (see the chart below), the market’s future volatility direction is unclear. Traders using options may choose adapt to this environment, ensuring that changes in volatility do not work against them.
3. Options Strategy: Call Ratio Spread
To take advantage of Gold’s uptrend while neutralizing the risk from changes in volatility, we could employ a Call Ratio Spread. This strategy offers a bullish stance while maintaining vega neutrality, protecting the trader from swings in implied volatility.
Setup:
Buy 1x 2600 Call at 256.15
Sell 2x 3500 Calls at 23.32
Expiration: July 28, 2025
This configuration generates positive delta, meaning the strategy will benefit from upward price movement. At the same time, by selling two calls at a higher strike, we offset the vega exposure, ensuring that changes in volatility won’t dramatically affect the position.
The strike prices and expiration selected help create a risk profile that works well in a bullish market. The maximum gain potential occurs if Gold continues to rise but stays below the higher 3500 strike, while the vega neutrality minimizes any volatility risks as the trade begins.
Notice the breakeven point for this strategy is 2809.5, meaning the trade becomes profitable if Gold exceeds this level by expiration.
4. Why Use Micros?
Traders looking for a more flexible approach can consider using Micro Gold Futures (symbol: MGC) instead of standard Gold futures contracts. Micro Gold Futures offer smaller contract sizes, which translate into lower margin requirements and a more precise way to control risk. This makes them an attractive alternative for traders with smaller accounts or those looking to scale into positions gradually.
Additionally, Micro Gold Futures allow traders to fine-tune their exposure to Gold without the larger capital commitment required by standard contracts. For those implementing strategies like the Call Ratio Spread, Micros provide a cost-effective way to execute similar trades with a lower financial commitment.
Contract Specs and Margin Requirements
Gold Futures (symbol: GC) represent 100 troy ounces of gold, and their margin requirements can vary depending on market volatility and the broker. Typically, the initial margin requirement for a standard Gold futures contract is around $10,000 to $12,000, but this can fluctuate. For traders seeking more flexibility, Micro Gold Futures (symbol: MGC) offer a smaller contract size, representing 10 troy ounces of gold. The margin requirement for Micro Gold Futures is significantly lower, usually in the range of $1,000 to $1,200, making it a more accessible option for those with smaller accounts or those looking to fine-tune their exposure.
5. Risk Management
As with any options trade, managing risk is essential. In the case of a Call Ratio Spread, the primary risk comes from the naked short calls at the 3500 strike price. If Gold rallies aggressively beyond 3500, the trader faces unlimited risk due to the uncovered nature of the short positions.
To mitigate this risk, traders should consider using stop-loss orders or adjusting the trade if Gold's price approaches the 3500 level too quickly. Another way to eliminate the unlimited risk component to the upside would be to convert the Call Ratio Spread into a Call Butterfly by buying an additional call above the 3500 strike price, effectively capping the risk. This adjustment still allows for positive delta exposure while limiting potential losses if Gold moves sharply higher.
Additionally, monitoring implied volatility is key. While the position starts with neutral vega exposure, this will change as the underlying asset price moves and time passes, especially as expiration approaches. The vega exposure can increase or decrease depending on these factors. If maintaining the vega-neutral characteristic is a priority, further adjustments—such as rolling options or modifying strike prices—could be made to keep the position aligned with the trader’s volatility outlook.
When charting futures, the data provided could be delayed. Traders working with the ticker symbols discussed in this idea may prefer to use CME Group real-time data plan on TradingView: www.tradingview.com - This consideration is particularly important for shorter-term traders, whereas it may be less critical for those focused on longer-term trading strategies.
General Disclaimer:
The trade ideas presented herein are solely for illustrative purposes forming a part of a case study intended to demonstrate key principles in risk management within the context of the specific market scenarios discussed. These ideas are not to be interpreted as investment recommendations or financial advice. They do not endorse or promote any specific trading strategies, financial products, or services. The information provided is based on data believed to be reliable; however, its accuracy or completeness cannot be guaranteed. Trading in financial markets involves risks, including the potential loss of principal. Each individual should conduct their own research and consult with professional financial advisors before making any investment decisions. The author or publisher of this content bears no responsibility for any actions taken based on the information provided or for any resultant financial or other losses.

USDJPY has bullish technical conditionsThe latest economic data suggests the Federal Reserve could cut interest rates again next month, but a larger cut is being underestimated.
Therefore, US bond yields remain stable and the wide spread between Japanese government bond yields and US bond yields continues to support the US Dollar.
On the daily chart, OANDA:USDJPY The uptrend is noticed by the price channel and the nearest support level at 148.113 of the 0.382% Fibonacci retracement.
Temporarily, USD/JPY's upside momentum is limited by the upper channel edge, once USD/JPY breaks above the channel it will continue to trend upward towards the 150.739 levels in the short term, more than 151,866.
Even if the 0.382% Fibonacci level is not enough to support USD/JPY in the short term, it still has other support slightly lower at 147.113 – 146.424.
As long as USD/JPY remains above EMA21 and within price channel, it still has a bullish technical outlook with notable technical points listed below.
Support: 148.113 – 147.112 – 146.424
Resistance: 149,364 – 150,739 – 151,866

WTI affects the Middle East and storms in the USOil prices were volatile but posted a second straight weekly gain last week as investors weighed potential supply disruptions in the Middle East and the impact of Hurricane Milton on fuel demand in Florida.
The price of West Texas Intermediate (WTI) crude oil for November delivery on the New York Mercantile Exchange decreased to 75.56 USD/barrel.
Although US President Joe Biden has advised against attacking energy facilities in OPEC's third largest producer, the possibility of prolonging the conflict in the Middle East and there are increasing signs of this spreading will make the market nervous.
Unrest in the Middle East has increased price volatility and prompted hedge funds to increase their net long positions.
At the same time, a statement from the US Treasury Department said that in response to Iran launching ballistic missiles towards Israel on October 1, the US is expanding sanctions on the oil and chemical industry. Iranian oil.
Hurricane Milton swept through Florida and into the Atlantic last Thursday, killing at least 10 people and leaving millions without power, putting pressure on prices.
Nearly a quarter of Florida's 7,912 gas stations were without fuel as of last Wednesday morning, as drivers stocked up on gas earlier this past week ahead of the storm.
Florida is the third largest gasoline consuming state in the US, but the state has no refineries and therefore must rely on imports.
On the daily chart, TVC:USOIL slight correction after recovery and limited by the 0.50% Fibonacci retracement level.
Up to now, WTI crude oil still has technical price increasing conditions with the main trend from the price channel, main support from EMA21. The confluence of the lower edge of the price channel and the 0.382% Fibonacci retracement level is the closest current support for WTI crude oil on the daily chart.
If WTI crude oil breaks above the 0.50% Fibonacci level, it will have conditions to continue rising with the target level then being around 79.03USD.
As long as WTI crude oil remains above the EMA21, it remains technically bullish in the short term, and the highlights are listed below.
Support: 73.77 – 72.39USD
Resistance: 76.40 – 76.84USD

#202441 - priceactiontds - weekly update - wti crude oil futuresGood Evening and I hope you are well.
tl;dr
wti crude oil: Bulls bought the daily 20ema and now we had gigantic up and gigantic down, means gigantic confusion. I favor another sideways to down movement for the second leg of the two-legged correction before bulls can try 77 or higher again. 75-76 is a bad spot to trade imo. Downside target is 74 or 73 and everything below would be bad for bulls.
Quote from last week:
comment: Wild, wild market currently. New low below 66.9, just to reverse for 13.95% or 925 ticks. You won’t see that move too often per year. So now what? Tough. Friday’s bar has a big tail above and we broke above the bear trend line, which could very well be a bull trap. A look at the monthly and weekly chart never hurts. They are both showing the same continuation pattern of a contracting market, since we did not break the lows below 63. Next bigger high which will most likely hold is the July one at 80.71. As of now bulls turned the market neutral again, where the middle of the potential range could be 72 if we use the July high and the September low.
comment : Bullish doji on the weekly with big tails above and below. 71.5 is a good low and likely to hold. I do expect another try by the bears though. Only question now is will we see 77+ before 74? I don’t know. So watch for momentum and hope along. I still favor the bulls for at least a retest of 77/78 but I do think we can hit 80 again. Given the strength of the move up, it is reasonable to expect a bigger second leg to 80 or higher.
current market cycle : trading range (triangle on the weekly tf)
key levels : 71 - 80
bull case: I continue to be bullish until bears can reject 77 or 78 again. Bulls now have formed a proper channel up and we are likely in W2 in a potential W5 series. Don’t trade based on that wave series because right now it’s a very rough guess.
Invalidation is below 71.3.
bear case: Bears had an amazing pullback last week and had to take profits on those 690 points. I don’t think we will see bigger bears coming around to fight for 75-76 they likely wait for 77/78 again. Otherwise I don’t have any arguments for the bears here.
Invalidation is above 79.
outlook last week:
s hort term: Neutral. I would not short 74.38 right now but favoring the bears for a pullback but only on weakness. Will only turn more bullish above 76 or around 72/73 (if bulls buy it). Pullback could go as deep as 70.
→ Last Sunday we traded 74.38 and now we are at 75.56. Neutral was good. Big up, big down, big confusion. Likely to trade more in the middle of that range, which we are doing.
short term: Neutral but expecting a retest of 77 and higher again. The closer to 74 you can long this, the better is what I think.
medium-long term - Update from 2024-10-06 : That bear trend is over and we are again in the big trading range 64 - 78/79.
current swing trade: None
chart update: Removed bearish two legged correction and added a potential 5-wave series.

#202441 - priceactiontds - weekly update - sp500 e-mini futuresGood Evening and I hope you are well.
tl;dr
sp500: Also max bullish. Bulls closed 8 points below the ath. Strong buy signal going into next week but the issue (again) is that you are buying above the bigger bull wedge and at the very high of a nested one. Waiting for a pullback to go long is the much more reasonable trade instead of buying near 5860. The wedge has room to 5900, so 6000 is a valid year end target. Bear case begins below 5750. 5800-5850 is neutral.
Quote from last week:
comment: Much bigger range than the previous week with wild moves the whole week. Bears sold it with spikes, followed by bulls who bought every dip. End result was 5800 again and now what? We are near the ath and can easily make a new one. The high was also high enough to count as a decent lower high and we sell off from here. Given the strong bull bar on Friday, we have to give the higher odds to the bulls to get follow through above and we will probably make a new ath.
comment: Two decent days were enough for the bulls to make new ath. Again a bad place to trade, 8 points below the new ath. We have nested bull wedges and market broke above the bigger one. Odds favor some pullback but I would rather wait and be flat than to short this.
current market cycle: nested bull wedges
key levels: 5750 - 5900
bull case: Bulls want 5900 and have all the arguments on their side. That still does not make buying 5859 a good buy. It’s possible that bulls break above both wedges and continue for 5900 and much higher, is it likely though? I doubt it.
What, no more text? We have two perfectly fitting patterns and are trading at the very highs. I have given precise invalidation prices. Don’t think more words will make this better. Just as more trades probably won’t make you more money. Quality over quantity.
Invalidation is below 5750.
bear case: Bears have nothing until they close below 5750. We are at the highs but so what? 5 Consecutive weekly bull bars say it all. Don’t look for shorts when bears do not make money other than scalping on time frames below 15m. When these two wedges break below, we will see a decent correction again and it’s possible over the next weeks but as of right now, bears are in pain and nothing else.
Invalidation is above 5910.
outlook last week:
short term: Neutral 5750 - 5850, big range but we are in the middle of that given range and both sides have reasonable arguments. If bulls get follow through above 5800, long scalps are a decent trade for 5830 or a bit higher. Right now I would not trade it.
→ Last Sunday we traded 5800 and now we are at 5859. Neutral range but I wrote above 5800 a long is good for 30 points or more. Good outlook.
short term : Neutral since we are exactly at the top of two big patterns and 8 points below the ath. Sitting on hands is best here.
medium-long term - Update from 2024-10-13: Very rough guess for the remaining trading weeks in 2024. Spike up, decent correction (~10%), nasty (blow off top) year end rally if earnings hold in Q4. Don’t trade based on that guess.
current swing trade: None
chart update : None

#ES_F Day Trading Prep Week 10.13 - 10.18Last Week :
Interesting week we had as many different things happened and it was fun to watch.
Last week Globex opened and made a return back into distribution balance, RTH flushed the inventory back into VAL but we again were able to hold VAL into the close and Tuesday Globex rotated back inside balance which brought buying and gave us another failed attempt out of balance top but market was able to hold over the 80s and supply which brought in more buying and triggered a short covering stop run into next Value which held and gave some continuation to close the week.
This Week :
Friday market attempted a push for VAH into 5840 - 80s Intraday range. We were able to hold around the mean of the of the range into the close but we can see it ended with a Poor high and Weakness into into 50s.
IF we are to accept in this new range then we would see price holding over 840s, over Value if that will be the case then we could continue trading in this range over VAL and start building up for an attempt at VAH test.
BUT we have to be careful as mentioned last week and week before that previous distribution range was a very interesting area and with current PA we might not be fully done with it, of course we will have to see what the market will actually do. Which means if we don't accept inside/over Value then this push could find its way back under 40s into VAL, IF we will be holding under 30s with Supply above that could trigger more weakness to get us back towards the Edge and eventually if we will have the supply find a way back into Previous Balance.
Something to note this week is Volume has been low, we don't have any market moving news until Thursday so need to be careful for more a slow leak back in instead of a quick return if it is to happen, holding over 830s would or 860s would change the weakness.

GOLD MARKET ANALYSIS AND COMMENTARY - [Oct 14 - Oct 18]This week, OANDA:XAUUSD have continuously decreased in the early sessions of the week to nearly 2,602 USD/oz because market expectations about the monetary policy of the US Federal Reserve (FED) began to change. . Last week's strong jobs report, combined with a higher-than-expected rise in the Consumer Price Index (CPI), forced the market to temper expectations for a sharp interest rate cut by the Fed next month.
However, economic experts note that the slowing US economy will continue to pressure the Fed to cut interest rates, albeit at a slightly slower pace. This combined with US consumer sentiment falling to 68.9 points, and the Middle East geopolitical conflict remaining complicated, pushed gold prices back up to 2,661 USD/oz and closed the week at 2,657. USD/oz.
Although the FED may reduce the pace of interest rate cuts in the near future, investors should not forget that US monetary policy is only one factor affecting gold prices. Notably, many central banks have officially announced they will continue to buy gold reserves.
As central bank demand continues to dominate the gold market, new questions are being raised about where all that money is going and what impact it has on the dollar. Certainly, reducing the proportion of USD in foreign exchange reserves of many countries will cause the USD to gradually depreciate.
In addition, BRICS member countries are promoting local currency swaps and using electronic currencies in international trade, also creating significant downward pressure on the USD.
In addition, the record high level of US public debt is weakening the purchasing power of the USD.
The USD has been under a lot of downward pressure, so of course it will positively support gold prices in the medium and long term.
📌Technically, on the H4 chart, there are continuous periods of sideways accumulation, then continuously creating new high prices afterward. And this time is no exception if the price breaks the peak of 2,685 USD/oz.
Currently, the support level is established around the circular resistance level of 2600, while the resistance level is around the 2685 mark. Next week, if the gold price trades above the 2625 threshold, we can expect the price to continue to increase beyond the 2700 threshold.
In case the support mark of 2600 is penetrated, the gold price will temporarily decrease and adjust below the level of 2555.
Notable technical levels are listed below.
Support: 2.555 – 2.600 – 2.625USD
Resistance: 2.700 – 2.685USD
SELL XAUUSD PRICE 2701 - 2699⚡️
↠↠ Stoploss 2705
BUY XAUUSD PRICE 2624 - 2626⚡️
↠↠ Stoploss 2620
BUY XAUUSD PRICE 2554 - 2556⚡️
↠↠ Stoploss 2550
